Gold & Precious Metals

The Babylon Bee captured the current state of the Republican Party in all of its hypocritical glory. The satirical website proclaimed “Republicans announce plan to pretend to be fiscally conservative again the moment a Democrat takes office.”

The GOP said it would begin to decry deficit spending and the $20 trillion debt in order to win votes as soon as political power swung back to the opposing party.

“‘The second a Democrat is back in the White House, we will once again start yelling about fiscal responsibility,’ Speaker Paul Ryan said in an address to the House of Representatives Friday. ‘For now, we will continue to vote for unsustainable and irresponsible budgets that your children’s children’s children will pay for for centuries to come.’”

The Bee was poking fun at the budget passed by the GOP Congress last week – the budget that added some $300 billion in deficit spending and raised the mythical debt ceiling. According to the Committee for a Responsible Federal Budget, $300 billion in additional spending will ensure the annual budget deficit will exceed $1 trillion in 2019.

In his podcast Friday, Peter Schiff made the exact same point.

If you really were against the deficits when Obama was president, then why aren’t you doing something to rein them in when Trump is president? Why are you actually voting in even bigger deficits now than the ones you opposed when you were the minority? And this is all hypocrisy. I’ve said this all along – that the Republicans are only fiscal conservatives when they’re in the minority and they can’t do anything about it. But the minute you turn over government to Republicans, they can run up the debt even faster than the Democrats.”

Peter noted that the US Treasury Department plans to auction off about $1.4 trillion in Treasuries this year to finance all of this spending. That raises an interesting question: Who is going to buy all this paper? The last time the Treasury sold more than $1 trillion in bonds, the Federal Reserve was buying. Supposedly, the Fed is now in the process of shrinking its balance sheet. In fact, the Fed plans to allow billions in bonds to mature and fall off its books. That means the government will have to sell even more Treasuries to make up that difference.

Good luck. How can anybody think it’s not going to be a problem to sell all that paper? Especially given how low the yields are. I mean, yeah, if this was like the Reagan administration and we were offering 15% yield on long-term bonds, yeah, maybe people would line up to buy them. But at 3% for 30 years? I mean, are there really that many buyers?”

Meanwhile, the entire world is already holding onto a pile of low-yielding, overpriced US Treasuries. Now they know that the US government is about to sell somewhere in the neighborhood of $2 trillion more.

What do you think they’re thinking? Do you think they just want to hold on? No! They want to get out from in front of that freight train … Everyone is going to want to get out the same door. So, there is no way to stop the bond market from just imploding.”

That means interest rates are going to have to go up.

Now, consider the context here. The bond market is teetering on the brink, meanwhile, the “fiscally conservative” GOP is adding billions to the debt.

Think about it. We’re going to be trying to borrow more money than we’ve ever tried to borrow before – by a massive magnitude. Why would that not push interest rates up?

Peter made the point that the rising interest rates – particularly long-term bond rates – is actually good for gold.

People still believe, falsely, that rising interest rates are bad for gold. And they’re not. But where they’re really not bad for gold is rising long-term interest rates. I mean, you can make a better argument that rising short-term interest rates are bad for gold, but there’s no way that you can argue that if the 30-year bond is going up then somehow that is bad for gold. Especially when long-term interest rates are mainly a function of inflation expectations. And if long-term interest rates are rising, it’s because people expect more inflation in the future. And if you expect more inflation in the future, that’s bullish for gold, because gold is a hedge against inflation, and it’s a much better hedge than a 30-year Treasury that gives you 10 or 20 basis points more in yield.”

Get Peter Schiff’s latest gold market analysis – click here for a free subscription to his exclusive monthly Gold Videocast.

Gold – Next Stop Below $1300?

February 6, 2018 

We continue to believe that gold is in the saucering stage of its eight-year cycle. The fireworks on the upside are likely a few years away, so you want to be patient, buying dips when available.

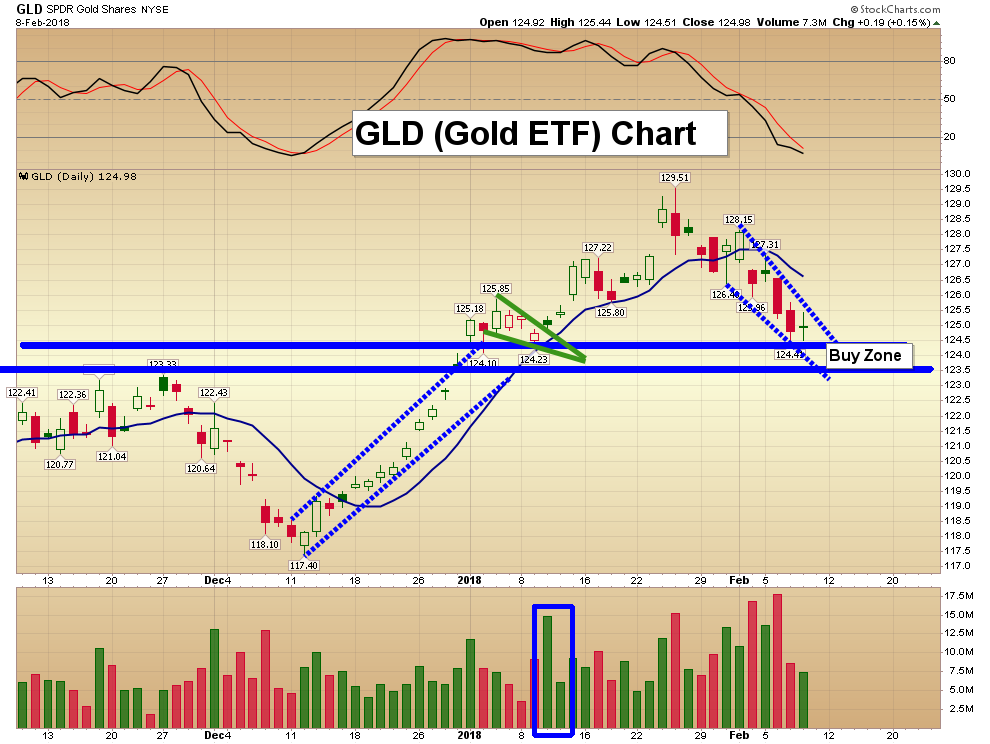
The normal action coming out of the last such six cycle bottoms was an interim high in the 55th to 64th week (58th as of January 26th). A optimum buying opportunity for bullion and the miners occurred when gold dropped to the 20-day moving average band (now $1269) and generated an oversold weekly CCI(8) of -100.

Having broken the lows of the last two weeks we could be on the way to such a correction. 

Click image to Enlarge 

bhoyye.

BOB HOYE,

INSTITUTIONAL ADVISORS

EMAIL bhoye.institutionaladvisors@telus.net

WEBSITE www.institutionaladvisors.com

Opinions in this report are solely those of the author. The information herein was obtained from various sources; however, we do not guarantee its accuracy or completeness. This research report is prepared for general circulation and is circulated for general information only. It does not have regard to the specific investment objectives, financial situation, and the needs regarding the appropriateness of investing in any securities or investment strategies discussed or recommended in this report and should understand that statements regarding future prospects may not be realized.

Investors should note that income from such securities, if any, may fluctuate and that each security’s price or value may rise or fall. Accordingly, investors may receive back less than originally invested. Past performance is not necessarily a guide to future performance. Neither the information nor any opinion expressed constitutes an offer to buy or sell any securities or options or futures contracts. Foreign currency rates of exchange may adversely affect the value, price or income of any security or related investment mentioned in this report. In addition, investors in securities such as ADRs, whose values are influenced by the currency of the underlying security, effectively assume currency risk. Moreover, from time to time, members of the Institutional Advisors team may be long or short positions discussed in our publications


Feb 13, 2018

  1. Gold has staged a superb rebound from the $1310 support zone, but that was overshadowed by the truly spectacular reversals taking place in most of the Western world’s gold stocks!
  2. Please  click here now. Double-click to enlarge this gold chart. I like the technical action being displayed right now. Here’s why:
  3. First, $1370 is massive resistance. It’s understandable that gold would build a modest head and shoulders top pattern after arriving at this key price zone.
  4. What’s especially positive is that gold has only modestly declined in the face of this resistance and top pattern. My key 14,7,7 Stochastics oscillator is also modestly oversold now, which is good news.
  5. For even better news, please  click here now. Double-click to enlarge.  This morning, the dollar broke below key support in the 108 price area against the yen.
  6. When investors bet against central banks, they tend to lose. When they bet against the President of the United States, they can get blown right off the financial map.
  7. The bottom line is that President Trump was elected on a mandate to bash the dollar lower, and it is getting beat on like a rag doll by the yen right now.
  8. The bear flag-like action occurred as the dollar approached this support zone. That is ominous for the dollar bugs, and fabulous news for gold.
  9. Investors don’t need to “back up the truck” when buying precious metal assets right now, but they should be emotionally positive and focused more on gold stocks than bullion.
  10. That’s because there is so much news taking place fundamentally in the gold market that favours the miners. Inflation is rising, mainly because quantitative tightening is pushing money out of government bonds and into the banking system.
  11. That’s raising interest rates, incentivizing banks to lend, and putting pressure on the US government’s ability to finance itself. Please  click here now. Double-click to enlarge. Since breaking the neckline of a daily chart head and shoulders top pattern, the US T-bond hasn’t even staged a minor rally!
  12. Another of Trump’s election pledges was that US bond market creditors were going to take a haircut on what they get paid. Looking at the price action in the bond market and statements from new Fed chair Powell, it appears that a haircut is on the cusp of really happening.
  13. Trump is acting like he doesn’t care if the US government defaults, and I would suggest that’s the right course of action to take. Inflate, default, or die. It looks like a combination of inflation and “defaultation” is what Trump has planned to end the US government’s horrific levels of excess size, debt, and abuse of citizens around the world.
  14. The rising risk of a joint bond and dollar market meltdown is why gold has acted like a champ while quantitative tightening and rate hikes accelerate. 
  15. While QT and rate hikes are the main gold fear trade theme, there are many other supporting factors. 
  16. For example, powerful money managers are beginning to voice concerns that Trump’s spending on infrastructure and his tax cuts could cause “overheating” in the US economy. 
  17. When institutions get into that mindset they buy… gold stocks!
  18. On that key note, please  click here now. Double-click to enlarge this GDX chart. There may be a classic non-confirmation signal in play for the entire precious metals sector, with most gold stocks breaking their December lows, while gold bullion did not.
  19. The GDX break of its December low was immediately followed by a V-Bottom pattern. Note the position of my key 14,7,7 Stochastics series oscillator. It’s adding to the power of the buy signal in play.
  20. Please  click here now. That’s another look at GDX, with an emphasis on the trading volume.
  21. Both Powell and Trump seem more interested in the success of Main Street than in Wall Street or the government bond market. I’ve predicted that Powell will attempt to reverse US money velocity by the summer of this year, and that he will succeed.   
  22. That change in focus is great news for citizens who have been encased in vile government red tape for far too long, and it is spectacular news for gold, silver, and mining stocks. 
  23. With the dollar, T-bond, and the general stock market on very shaky and inflationary ground, institutional money managers have started to take a serious look at gold stocks. By the summer, I expect them to be consistent buyers every month. It doesn’t take a lot of institutional money to blast gold stocks to significantly higher price levels. 
  24. To profit from the imminent inflationary fun, aggressive investors should buy GDX call options. Investors who don’t own gold stock at these price levels or lower should be firmly pressing the buy button today! 

Thanks! 

Cheers
st

Feb 13, 2018
Stewart Thomson  
Graceland Updates
website: www.gracelandupdates.com
email for questions: stewart@gracelandupdates.com 
email to request the free reports: freereports@gracelandupdates.com

What the Stock Market Decline Means for Gold and Gold Stocks

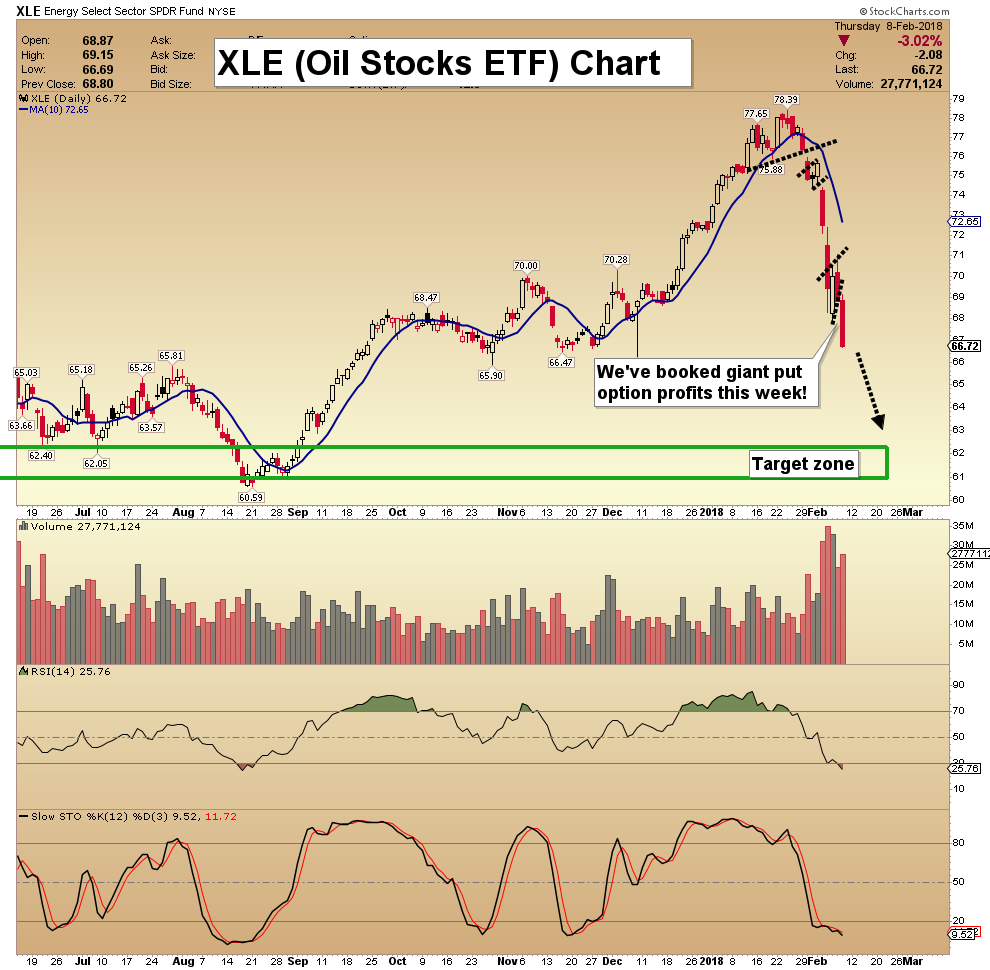
It was a rough week for investors in stocks and stocks of all kinds. The S&P 500 lost 5%. Emerging Markets also lost 5%. Gold Stocks, which had weakened before the broader equity market have been hit hard. They (GDX, GDXJ) also lost 5% last week. The HUI Gold Bugs Index (which excludes royalty companies unlike GDX) lost 7%. After a strong start to the year, gold stocks have essentially given back all their gains. Nevertheless, we remain extremely optimistic on gold stocks over the next 12-18 months as trends in the economy and stock market should begin to support Gold after the second quarter.

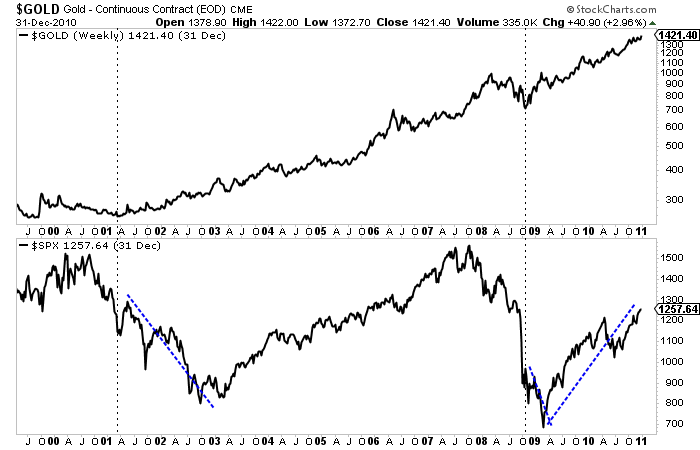
Historically speaking some of the best performance in Gold and gold stocks occurred during or after a bear market in stocks. The best examples can be found in the 1970s and 2000s as the charts show. Gold surged after the bottom in stocks in 1970 and continued to perform very well during the 1973-1974 bear market. After a brief but sharp bear in 1975-1976 Gold rebounded strongly as the S&P 500 began a mild bear market in 1977. Years later Gold emerged from a significant bottom in 2001 while the stock market endured its worst bear market in a quarter century. Gold continued to perform even after the market bottom in late 2002. Gold emerged from the global financial crisis before the stock market but continued to make new highs after the stock market bottomed in March 2009. 


02092018goldspx70s

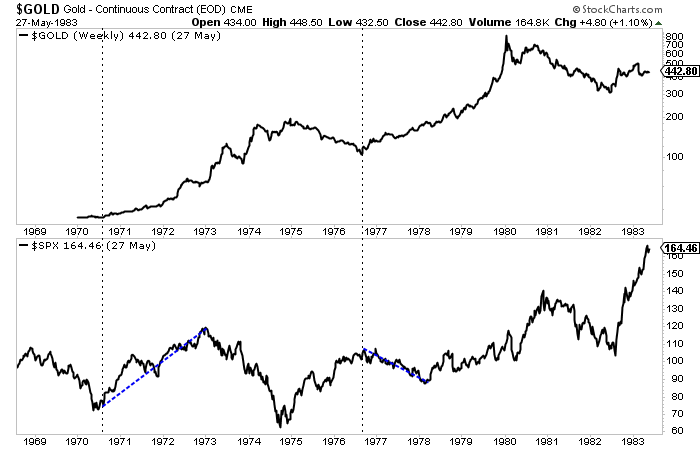
This performance is not just random. It makes quite a bit of fundamental sense. As we know, Gold is driven by falling or negative real rates. Typically policy makers in response to a recession or bear market will pursue policies that lead to falling or negative real rates. These policies are not reversed until the economy gains strength. Gold can also benefit from inflationary recessions, which we saw in the 1970s. Perhaps we are headed for that outcome at somepoint but I digress.

The best comparison to today may be the mid 1960s. Although the Gold price was fixed until 1971, we can use gold stocks to study the macro picture of the 1960s and how it may relate to today. 

Gold stocks and the stock market were positively correlated during the 1960s but gold stocks dramatically outperformed and especially from 1964 to 1968. That outperformance accelerated after 1963 as inflation and bond yields began to rise to higher and higher levels in the years ahead. That would soon negatively impact the stock market in both nominal and real terms. The Dow peaked in 1966 while the S&P 500 did not peak until 1973 (as it made marginal new highs in 1969 and 1973). In real terms stocks would peak in 1966 or 1968 (depending on which index you use). 

Economic fundamentals appear to be headed in a direction that is bullish for Gold and gold stocks and less positive for the stock market. While inflation has yet to be unleashed, the markets are showing that inflationary pressures are forming. This will impact corporate margins (which are extremely high) as well as profits. Higher inflation also leads to higher bond yields which means higher costs to service debt. That is a problem for the economy and equity market due to the debts that have piled up in recent years.

So the question now is where is the threshold for when inflation and bond yields start affecting the economy and stock market in a way that is favorable for precious metals?

With respect to the 1960s and 1970s, the answer would be 1964. 

When precious metals begin and sustain outperformance against the stock market it will signal that the threshold or inflection point has been reached. That outperformance will also go a long way in helping Gold make its major breakout. 

It is not yet time for Gold and gold stocks to shine but it is getting very close. Gold remains in a bullish consolidation pattern that should give way to a breakout later in the year. Meanwhile, gold stocks and Silver are lagging badly but that does not have us concerned. The next few months could prove to be the best buying opportunity in precious metals since the end of 2015. Quality juniors that are bought on weakness over the medium term should deliver fantastic returns over the ensuing 12 to 18 months. 

Jordan@TheDailyGold.com

To follow our guidance and learn our favorite juniors for 2018, consider learning more about our premium service.

Gold Stocks Decline: Key Tactics