
Gold & Precious Metals
Some things to remember amid the volatility of the gold price…
WHEN VOLATILITY prevails in the gold market, I love seeing so many different opinions because it promotes critical thinking and healthy markets, writes Frank Holmes, CEO and chief investment officer of US Global Investors.
But because gold is unlike any other commodity, many perspectives can be extreme, such as “goldenfreudes” who take pleasure in gold bugs’ pain.
I continue to persuade readers to take a balanced and thoughtful approach to the yellow metal. With this in mind, here are four facts to remember about gold that should help neutralize those extreme bullish and bearish views.
1. You can’t print more gold
The Federal Reserve continues to print fresh, crisp stacks of US Dollars amounting to $85 billion every month, driving up the balance sheet to almost $3 trillion Dollars. If Ben Bernanke continues churning out Dollars at this rate, by 2016, the balance sheet will more than double to $7 trillion Dollars.
And research has found that the price of gold moves in near-lockstep to each increase in the Fed’s balance sheet.
Even with the incredible two-day drop in gold prices, US Global portfolio manager Ralph Aldis calculated that the correlation between the rise in gold and the US balance sheet is 0.96. Perfect correlations of 1 are extremely rare in markets, but gold and the balance sheet have moved in sync with each other since 1999, before gold’s bull run began.

2. Gold is viewed as a currency by central bankers
As gold was falling on April 15, Carl Quintanilla from CNBC asked me what I thought about how investors viewed currencies. I feel investors should look at how central banks around the world are viewing their own reserves. Although Cyprus and Italy were possibly forced to sell their gold holdings to pay down debts, take a look at the actions of emerging countries central bankers who are scooping up gold.
The World Gold Council (WGC) reported that in 2012, central banks purchased 535 tons when only a few years ago central banks were net sellers of gold. And it’s important to keep in mind that these central banks love these corrections, as they can purchase gold at cheaper prices.
Russia bought 75 tons, bringing its gold holdings to the seventh largest in the world, with about 1,000 tons. Last year, Brazil, Paraguay and Mexico purchased gold, as did South Korea, the Philippines and Iraq.
Turkey is another country that has been building reserves, though not from purchases. Rather the WGC says its growing gold reserves “reflect the increasing role that gold plays more broadly in the Turkish financial system as these reserves are substantially pledged from commercial banks as part of their required reserves.”
While the tonnage is only a fraction of the overall gold market, it is widely acknowledged that central banks are building their supplies of gold as a means to diversify their holdings away from the US Dollar and the Euro. As a percent of total reserves, many of these emerging countries mentioned above own very little gold. In fact, Pierre Lassonde, chairman of Franco-Nevada, has noted that even if emerging market central banks wanted to increase their gold reserves to 15 percent of total reserves, they’d have to buy 1,000 tons every year for the next 17 years!

3. A lack of love from the Love Trade is affecting fundamentals
Too many people focus on the Fear Trade, which is when investors buy gold coins or a gold ETF out of a fear of the fallout that may result from governments’ rising debt levels and weakening currencies.
The Love Trade, on the other hand, is the buying of gold out of an enduring love for gold. Two emerging countries that make up almost half of gold demand—China and India—have had a long relationship with the precious metal that is intertwined with their culture, religion and economy. With half of the world’s population buying gold for their friends and family, it’s important to put into context what is happening in their countries.
It was announced this week that China’s income growth slowed in the first quarter of 2013, with urban household disposable income rising only 6.7 percent on a year-over-year basis. This is down from 9.8 percent in the first quarter of 2012, and “the slowest pace since 2001,” says Sinology’s Andy Rothman.
This is very important to gold, as China’s income growth has been shown to be highly correlated to the price of the precious metal over the past decade.

4. Corrections happen, but have historically offered buying opportunities
As of mid-April, the gold price on a year-over-year percentage change basis registered a -2.6 standard deviation. While minor corrections in the gold price happen frequently, a move this severe has never occurred before over the previous 2,610 trading days.

With gold’s standard deviation drastically below the “buy signal” blue band, we consider the yellow metal to be in an extremely oversold position on a 12-month basis. The probability that gold will move higher over the next several months is high.

We thought we would share with our readership an important change in the positioning of large U.S. banks in the monthly futures-only Bank Participation Report(BPR) issued by the Commodity Futures Trading Commission (CFTC). The most recent report was published Friday, May 10 for positions as of the close on Tuesday, May 7.
The main reason we are going to the trouble of doing this short report is that there is a surprising dearth of accurate information about the new data available on the Web.
One of our members forwarded to us some coverage by others which we found utterly useless and inaccurate (showing a preconceived bias on the part of the author), so perhaps this report will provide some clarity for those who closely follow the CFTC commitments of traders reports as well as the positioning of banks in futures.
U.S. Banks Net Shorts Fall to Lowest Since Summer, 2008
Let’s start this review with our comments shared with GGR Subscribers on Sunday, May 12. After mentioning that the combined commercial traders – the Big Hedgers, which includes the U.S. banks in the Legacy COT reports – had reduced their collective net short positioning for gold to the lowest since the 2008 panic and at a “very fast pace,” we said:
“An aggressive pace of LCNS reduction with none more aggressive than U.S. banks. The Bank Participation Report (not to be confused with the weekly Legacy COT report, which is separate) shows that over the past month U.S. banks covered or offset a whopping 24,855 (60%) of their net shorts (from 41,666 to just 16,781 contracts net short). The number of U.S. banks reporting falls below 4, a tell. We have not seen the U.S. banks show so low a net short position since they briefly went slightly net long in the summer of 2008 during the panic.”
So in just one month, as gold fell a net $123.45 or 7.8% (from $1,575.67 on April 2 to $1,452.22 May 7), U.S. banks covered or offset 60% of their net short bets on gold, down to an extremely small 16,781 contracts net short. We have to go all the way back to the June 3, 2008 BPR to find a time when the U.S. banks, including bullion banks, showed a lower number of net short bets held.
In fact, in that June 2008 report the U.S. banks were actually net long gold then by 5,381 lots. (But as the graph below clearly shows they would not stay net long. By the next monthly report in July they had put on an amazing 82,228 contracts net short in just one month.)
Below is a graph showing the nominal net short positioning reported by U.S. banks to show it visually.
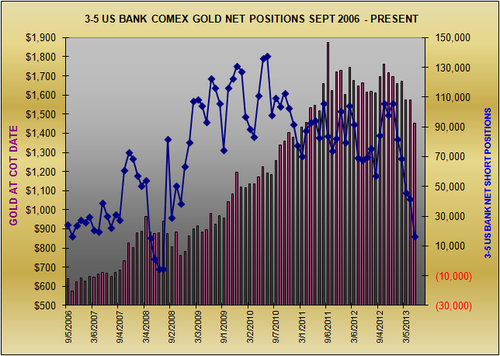
Interestingly, the U.S. banks net short positioning did not decline because they were reducing their short bets. Instead, 21,653 contracts of the change is attributable to the banks adding long contracts to their positioning for just this past month. They were not dumping their short contracts so much as adding longs in other words.
In just the five reporting months since December 4, 2012 as gold declined a net $245.10 or 14.4%, U.S. banks’ net shorts fell from 106,393 to 16,781, a plunge of 89,612 lots or a whopping 84.2%.
The net effect is clear to see in the graph above on a nominal basis. As gold fell down to test the $1,300s U.S. banks very strongly reduced their collective net short positioning and came within a whisker of becoming actually net long for the first time since the 2008 panic.
To standardize the results and show that there are no material anomalies in the data above, we compare the U.S. banks’ nominal net position with the total COMEX open interest in the graph below. From December 4 to last Tuesday, May 7, as gold fell from near $1,700 to as low as $1,321 before settling at $1,452, the U.S. banks’ net short positioning fell from a significant 24.5% to a miniscule 3.8% of all COMEX contracts open .

Clearly the U.S. banks, presumably including U.S. bullion banks, are not, that’s not, positioning as though they believe there is a great deal more downside left in gold futures.
If they did or do believe that gold could probe even lower than the $1,320s, they are not positioning for it in COMEX futures. That does not necessarily mean they are “right,” but it is a window into how the largest, best funded and presumably the best informed traders of gold futures on the planet – the U.S. banks – are positioning, both for their own book and for their clients.*
It is rare to see the U.S. banks put on 21,000 or more long contracts in a month.** We have to believe that the U.S. banks would not have done that unless they meant to reduce their collective net short positioning in a relative hurry.
(A long contract benefits if prices rise. A short contract benefits if prices fall.)
* The U.S. bullion banks trade for their own account and for clients, which include a broad cross section of businesses in the gold trade (large bullion dealers, large holders of physical metal, jewelry merchants and manufacturers, producers, some refiners, bullion management firms and other middlemen, etc.).
** This is the largest increase in our records going back to 2006. Before this report the largest one month increase in U.S. bank longs was with the September 2, 2008 report, when the U.S. banks reported adding 17,567 lots with gold then about $805. By the following report, on October 7, gold had moved 9% higher to the $880s.
(Source for data CFTC for bank positioning, Cash Market for gold, GGR.)

In May 2011 we presented the following chart, displaying the key support levels for silver at $34, $27 and $23; representing retracements of 38%, 55% and 65% from the 2008 low. The April 2013 low has held around the 65% retracement. Our modeling calls for an interim low in precious metals now as ‘B’ of an A-B-C rally into mid-June, possibly stretching into July.
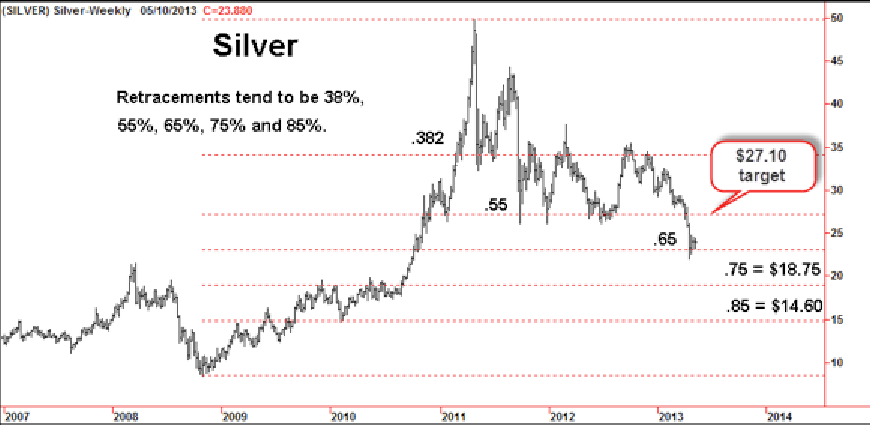
The most common reaction after giving back 65% of a major advance (i.e. $8 to $50) is a 38% retracement rally of the most recent decline. (Previous examples are 1969, 1983, 1998 and 2003.) The 38% retracement from October’s interim high of $35.44 produces a target of $27.10.
When looking for a catalyst for the potential rally one only needs to recognize that selling pressure has been unabated recently, with fifteen of the last sixteen weeks having made lower highs. This is similar to the pressure seen into the 2008 bottom and the inverse of the rallies into December 2010 and April 2011. Once the sellers have satisfied their needs there should be a reasonable vacuum permitting a breakout through $24.
A decisive weekly close exceeding $27.10 would then suggest a continuation to $35. However, a failure would suggest that the lower supports at $18.75 and $14.60 (75% and 85% from 2008) could be challenged.
CHARTWORKS – 2013/05/14
The opinions in this report are solely those of the author for the private information of clients. Although the author is a registered investment advisor at CIBC Wood Gundy, this is not an official publication of CIBC Wood Gundy and the author is not a CIBC Wood Gundy analyst. The views (including any recommendations) expressed in this report are those of the author, and are not necessarily those of CIBC Wood Gundy. The information contained in this report is drawn from sources believed to be reliable, but that accuracy and completeness of the information is not guaranteed, nor in providing it does the author or CIBC Wood Gundy assume any liability. The information given is as of the date appearing on this report and neither the author nor CIBC Wood Gundy assume any obligation to update the information or advise on further developments relating to the information provided herein. This report is intended for distribution in those jurisdictions where both the author and CIBC Wood Gundy are registered to do business in securities. Any distribution or dissemination of this report in any other jurisdiction is strictly prohibited. The author and / or CIBC Wood Gundy may have holdings in the companies discussed and may offer advice or have an investment banking relationship with the companies discussed in the report.
Why does silver move so much further, and faster, than gold…?
The SILVER MARKET often gets a bum rap. The reason is that often its gyrations are much greater than those of the gold market.
What causes this? There are theories that bankers and investment companies are conspiring to try to manipulate the market. However, buying or selling alone is not a conspiracy. It is called a speculation. Where conspiracy begins is poorly defined in law, especially where it’s one through market trading. But one factor is true: market perception can be changed by those with big wallets.
There have been times over my 30 years in the precious metals markets that I felt perception was being directed, if not manipulated, by bigger players. One ploy used in the past was to move silver stocks off of the Comex to give the appearance of a supply shortage. Such a shortage would, other things being equal, eventually drive up the price, at which time the big holders could sell into the marketplace. Anyone doing this successfully would make a hefty sum of money. They might counter by saying they still took a risk, just like any other speculator, and as such earned their reward. Because such a plan may have failed and caused them to lose money as well.
That being said, I want to go back and look at the silver market versus the gold market. You will see why we have greater volatility – meaning fluctuations – in the silver price. In the following illustration let’s take a quick snapshot of the tradable instruments in gold and silver investment.

In the illustration I took Comex open interest for both gold and silver contracts, and the holdings of the largest single gold and silver ETFs. Combining them to see their total dollar valuation, we can see that of all the dollars transparently held in these markets, gold commands 82% of the value. What this tells you is that the silver market, meaning the investment and trading side of its business, is significantly smaller than that of gold.
Why is this? The primary reason I believe is because gold is considered a currency. Whereas silver has had that position in the marketplace in the past, it does not in reality hold that weight currently. Because of this disparity, we have tremendous volatility in the silver market. In the following illustration I took the volatility index of the silver ETF and the gold VIX (volatility index) and graphed the two.

In the illustration you can see the darker line is gold and that line is significantly lower than the silver line. Silver’s volatility traded over 50% while gold only once reached 30% in this one-year chart. Though the prices often move together, and even though volatility seems to move together, it is still obvious that silver’s volatility is much greater.
I use both these illustrations to make my point. It is not because of market manipulation that silver is so difficult to trade day to day. It is simply that gold is a much larger market and more liquid. When a market has many more participants, and a greater number of committed long-term buyers, this creates greater price stability. It is the size of the market that dictates volatility.
But does this mean that silver is a bad investment? I don’t think so. Another reason that silver does not hold the same cachet as gold is because of the difficulties of handling the metal in larger quantities. Because it is less dense than gold it occupies more space, which means that storage and shipping costs are much higher. Due to these holding costs a lot of investors do not want to pay this expense.
But if demand were to grow significantly the holding costs would move lower as the turnover and volumes moved up, and that would help reduce the operating costs for active traders. One of the factors that are being looked at more and more in the silver market is its demand as a currency. Many economists (although not those that work for governments or banks) believe that we will be entering a period of significant systemic problems in the fiat currency system. Were this to come to fruition then gold supplies are not enough to support such a shift. However, silver offers an answer during these foreboding times. At that point volumes and market participants could increase to where silver volatility would not be significantly greater than its partner gold.
Miguel Perez-Santalla
Miguel Perez-Santalla is vice president of business development for BullionVault, the physical gold and silver exchange founded a decade ago and now the world’s #1 provider of physical bullion ownership online. A fierce advocate for retail investors, and a regular speaker at industry and media events, Miguel has over 30 years’ experience in the precious metals business, previously working at the United States’ top coin dealerships, as well as international refining group Heraeus.
(c) BullionVault 2013
Please Note: This article is to inform your thinking, not lead it. Only you can decide the best place for your money, and any decision you make will put your money at risk. Information or data included here may have already been overtaken by events – and must be verified elsewhere – should you choose to act on it.

-
I know Mike is a very solid investor and respect his opinions very much. So if he says pay attention to this or that - I will.
~ Dale G.
-
I've started managing my own investments so view Michael's site as a one-stop shop from which to get information and perspectives.
~ Dave E.
-
Michael offers easy reading, honest, common sense information that anyone can use in a practical manner.
~ der_al.
-
A sane voice in a scrambled investment world.
~ Ed R.
Inside Edge Pro Contributors

Greg Weldon

Josef Schachter

Tyler Bollhorn

Ryan Irvine

Paul Beattie

Martin Straith

Patrick Ceresna

Mark Leibovit

James Thorne

Victor Adair