
Gold & Precious Metals
GOLD SINKS TO $1600 AS SLIDE ACCELERATES, SILVER UNDER $30, OIL & NATGAS TUMBLE
Commodities fell across the board this week, even as stock markets remained near five-year highs. Speculation about the end of the Federal Reserve’s quantitative easing programs pressured gold to the lowest level of the year, while a bearish inventory report sent natural gas skidding.
Stocks, as measured by the S&P 500, were essentially unchanged in the period. The index is up 6.5 percent year-to-date.
Macroeconomic Highlights
This week’s economic data in the U.S. were mostly positive, but disappointing news in Europe dampened sentiment. The Census Bureau reported that retail sales in the United States rose by 0.1 percent in January, as expected. Excluding autos and gas, sales rose by 0.2 percent, slightly less than the anticipated 0.4 percent.
The Department of Labor said that the number of people filing for unemployment benefits in the United States fell from 368K to 341K last week, while the Empire Manufacturing Index in the U.S. rose from -7.78 to 10.04 in February—the highest level since May 2012.
On the bearish side, gross domestic product in the eurozone shrank by 0.6 percent in the fourth quarter, more than the 0.4 percent decrease that was expected and the third-straight quarterly contraction.
Of particular note was a 0.6 percent decline in Germany’s GDP, the worst downturn in that economy since the 2009 recession.

…..read more HERE


Jim Sinclair is one of the most outspoken commentators on gold. In his long career in the business of metals, mines and money, he has built a prominent record of having been right with his predictions. This has made him a man that many people like to listen to when he speaks. Recently, he has spoken out again and how! Let me quote a part of his recent message:
![]() “Gold is going to and beyond $3500 based entirely on this initiative certain to become completed as a reality. It is already happening right in front of your eyes, but the world is still blind to it.
“Gold is going to and beyond $3500 based entirely on this initiative certain to become completed as a reality. It is already happening right in front of your eyes, but the world is still blind to it.
This is why gold will rise to $3500 and beyond, but never do a 1980 fall again. This is why silver is a great trading vehicle, but not a great long term holding. This is why I have invested $32,000,000 in my own approach towards gold. This is why I sold ALL of my personal material treasures to make this investment when only I would do it. This is why I took on large debt to accomplish my plan.
This was the basis for my career interview by Forbes in Dec 2000.
No government fund, no gold bank, and no long cycle analyst can stop the progression of gold. The capitalization of the forces behind gold will overcome all these other bearish considerations. I say this because I know this, not because I think this.
I knew gold’s first most important number was $1650 11 years ahead of time. I did not think it. I am telling you now because I know it that gold will go to and beyond $3500. It will be gold that saves a financially collapsing world of debt.” ◄
I am pretty sure that some of you will recognize the above as a typical gold comment coming from the USA, but like I said, Jim Sinclair is not just a typical USA commentator. He knows what he is talking about and he is not afraid to tell us about his views. I was most impressed when I attended one of his speeches in the past and I have been alert on what he said ever since.
…..read pages 2-11 HERE (includes info on 21 Stocks)
Gold and silver might move in the same direction each day. But they aren’t blood related…
A LOT OF TALK on the web right now says silver is significantly undervalued versus gold.
Many of these pundits and talking heads like to point to the historical relationship between gold and silver prices, sometimes known as the “ratio”. People even comment as to this connection as far back as thousands of years ago. Let’s take a quick look at this.
Silver, thousands of years ago, was originally thought of greater value than gold, both because it was relatively scarce in great civilizations such as the Egyptians, and because it was easier to work into useful materials. Both silver and gold have been used abundantly for ornamentation and as a thing of beauty in homes, temples and palaces. Then of course as jewelry their beauty was very much esteemed.
However, once gold was found in increasing abundance and man’s metallurgical skills improved, gold soon took over as the leader and the metal given greater value. Though silver would not lose completely that position, it would fall into the number two spot. One of the main reasons is gold’s ability to be beaten and stretched to great lengths with out and still maintain it beauty. But the most important of its properties was that it did not tarnish. In a thing of art and beauty this is an important factor and one that still to this day maintains Gold’s lead over silver for prominence in the jewelry industry.
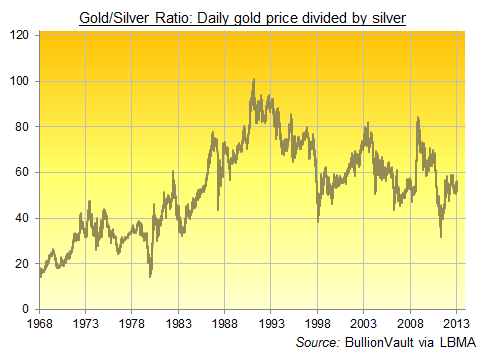
Getting back to the ratio, as time went by silver would continue to be found in greater abundance than gold. So the differential moved to a 10 to 1 relationship in medieval Europe, and was then fixed at 15.5 in England by Isaac Newton when he was Master of the Mint in 1717. That’s almost exactly the ratio of unearthed silver to gold in the ground worldwide. As recently as the early twentieth century we had gold and silver at a 20 to 1 ratio when silver was coined as One Dollar and gold was Twenty Dollars in the USA.

Now we are looking at the current ratio 53.15 as of this writing. It sounds high looking at historical standards. What about recent history?
Some people will point to the 1980 low of 14 to 1. But at that time the silver market was said to have been cornered by the Hunt brothers, making that level an artificial low as silver prices jumped. In 1991 we saw the high of 100 as gold hit $412 per ounce and silver remained around the $4 level. In the last ten years we have been as high as 80 and as low as 31.60.
So is this a good barometer to the direction of the price of silver or gold? I don’t believe so. But the ratio between gold and silver prices is an exciting spread to trade at times, even though the two metals move in the same direction almost each and every trading day.
Both metals are precious, and silver is often found with gold in the ground. Yet they are not blood related, and it’s the differences which might explain the widening or narrowing of the ration in prices.
Silver is produced in abundance as a byproduct of many other processes as well. Zinc and copper mining are among some of the principal producers. According toThomson Reuters GFMS in a report prepared for the Silver Institute, nearly two thirds of the world’s annual production of silver is as a by-product.
In the same report it is stated that in recent years silver production has increased by 25% while gold becomes ever rarer at a slower growth rate of only 6% over a ten year period. Even with the high price of gold it can’t seem to keep pace with silver. So supply and demand would have us believe that silver is increasingly more available.
Then what are these talking heads saying when they believe silver has a better opportunity for price growth than gold? Where do they come up with their belief?
Silver for sure is always in demand and though photography and x-ray film once the major consumers of the white metal are quickly disappearing new and exciting applications have come online. Photovoltaic, a major consumer, came into the fold a few years back. It continues to grow. Though, it is off significantly from its 2011 high, which still did not reach the annual consumption of silver by the photographic industry in the early part of this century.
Thomson Reuters GFMS states that world industrial demand will have dropped 8% in 2012. According to the USGS (US Geological Survey) 2011 Minerals Yearbooktotal US industrial consumption of silver was down 5% from 2010. So it is the investment market that has truly come in to fill the gap in silver.
In the same report we read that Coin & Medal demand was up 19% in 2011 over 2010 globally. The silver ETPs (exchange traded products) has grown to be holding currently around 623 million ounces which is 83% of a year’s annual production. And this January the US Mint had record sales of their silver eagle bullion coins of 7.42 million ounces as the public fears of currency devaluation weighs heavily on their minds.
Still even with this information can we be certain that silver has more upside? This is a very difficult look into the future. I believe the precious metals class will continue to perform for the foreseeable future, at least another five years while the global economy keeps languishing. The global credit problems are not over. Spain and Italy remain in crisis to mention a few and this illness will cause the doctors to keep prescribing easing, or increasing cash liquidity (printing more money).
But what of the fundamentals cost of production? The Silver Institute reports a cash cost of $7.25 per ounce for 2011. Using this as a baseline I believe most people would believe silver to be overvalued. But this number does not reflect the actual final cost to market of the metal in a form that is ready for consumption. It lacks all the detail necessary to make an informed decision. This is why it is not trading anywhere near these numbers.
In a very well thought out article, Silver Deceptions: Large Surpluses & Low Production Cost, Steve St. Angelo at SilverSeek argues that the actual cost of production for mining silver is much higher. Using his method of calculation, the cost of production of silver for 2011 should be $28.02 and for gold should be $1359.80. This would mean that silver at a little over a 10% premium at these market levels while gold is at over a 20% premium to today’s price.
I guess there you have it. Before considering the industrial or monetary use of silver in future, investors looking for more upside potential in silver than gold might start with that 10% differential in cost of production.
Miguel Perez-Santalla
BullionVault
Miguel Perez-Santalla is vice president of business development for BullionVault, the physical gold and silver exchange founded a decade ago and now the world’s #1 provider of physical bullion ownership online. A fierce advocate for retail investors, and a regular speaker at industry and media events, Miguel has over 30 years’ experience in the precious metals business, previously working at the United States’ top coin dealerships, as well as international refining group Heraeus.
(c) BullionVault 2013
Please Note: This article is to inform your thinking, not lead it. Only you can decide the best place for your money, and any decision you make will put your money at risk. Information or data included here may have already been overtaken by events – and must be verified elsewhere – should you choose to act on it.
In the last update we called a bottom in silver the day after it put in a high-volume bull hammer early in January, and while it did reverse as expected, the short-term uptrend that developed has since stalled out in recent weeks and it now looks like it is about to reverse to the downside again. (Ed Note: There is a Great Gold Update with 9 Charts HERE, and/or use the link at end of this article to view)
On silver’s 6-month chart we can see how the price has advanced out of the intermediate base area that formed late in December and early in January, and also how the advance has fizzled out so that another top area appears to have developed, and with the price on the uptrend line it looks like it will break below it soon, or immediately, and in so doing reverse to the downside again. The advance out of the base was anemic and the price has fallen way short of making it to the upper boundary of the larger downtrend channel, which is an ominous sign. There is still an outside chance that it could now do so – although the latest COTs offer no comfort for bulls here.

If the price does now break down from the minor uptrend its first stop will be the support near the late December – early January lows, and if it breaks below this support it next port of call will be support in the $28 – $28.50 area.
We can see the long-term uptrend in silver on its 7-year chart. On this chart we can also see that there is very strong support at the multiple lows of the past 18 months, at and just above $26, which also happens to be very close to the support of its long-term uptrend line. A dip into this zone will be the point at which to buy silver (in the approx. $26 – $27.50 area circled in green) for the next major upleg, and the proximity of a very clearly defined strong support level affords a very favorable risk/reward ratio, as a protective stop can be set just below it.

If silver does go on to break down below the strong support level at $26, it will be very bad news indeed, as such a development could be expected to trigger a brutal plunge, and there is a scenario in which this could occur as set out in more detail in the parallel Gold Market update.
The Fed must be desperate to support the beleaguered dollar and Treasury market, and it can be presumed that they will stop at nothing to do so. A highly effective way to achieve this objective would be to create a deflationary scare and an exodus out of commodities and stocks, with the hot money panicking into the dollar and Treasuries again, which tactic has the added advantage that they can later claim that only another massive infusion of QE will save the economy from ending up on the rocks again, although the reality is that it never got off them. Various COT charts show that the Commercials will be prime beneficiaries of such a scenario, should it unfold, which of course makes it that much more likely, since they are seldom losers.
The latest silver COT chart should strike fear into the hearts of silver longs, although it usually doesn’t because they either don’t understand it or ignore it, preferring instead to march to the drumbeat of their favorite cheerleaders, one of whom recently described silver as “being on the precipice of a massive (upside) breakout”, a choice of words that could come back to haunt him.

End of report. (Ed Note: Great Gold Update with 9 Charts HERE)


-
I know Mike is a very solid investor and respect his opinions very much. So if he says pay attention to this or that - I will.
~ Dale G.
-
I've started managing my own investments so view Michael's site as a one-stop shop from which to get information and perspectives.
~ Dave E.
-
Michael offers easy reading, honest, common sense information that anyone can use in a practical manner.
~ der_al.
-
A sane voice in a scrambled investment world.
~ Ed R.
Inside Edge Pro Contributors

Greg Weldon

Josef Schachter

Tyler Bollhorn

Ryan Irvine

Paul Beattie

Martin Straith

Patrick Ceresna

Mark Leibovit

James Thorne

Victor Adair