
Gold & Precious Metals
Buying Opportunity?, is Silver Cheaper? – 8 Key Charts Below
Gold and Silver bugs have had an abysmally poor 2012 against expectations for new all time highs, where a 1 year bear market from the August 2011 high into the May 2012 low failed to spark a sustained run to new all time highs. The rally from which petered out by early October at $1800, followed by another trend back to leave Gold at $1657 as per the last close, this despite reams and reams of material plastered all over the internet that hoped for an eventual return to a gold standard or “Sound Money” as being the ultimate outcome of our ongoing global debt and money printing crisis.
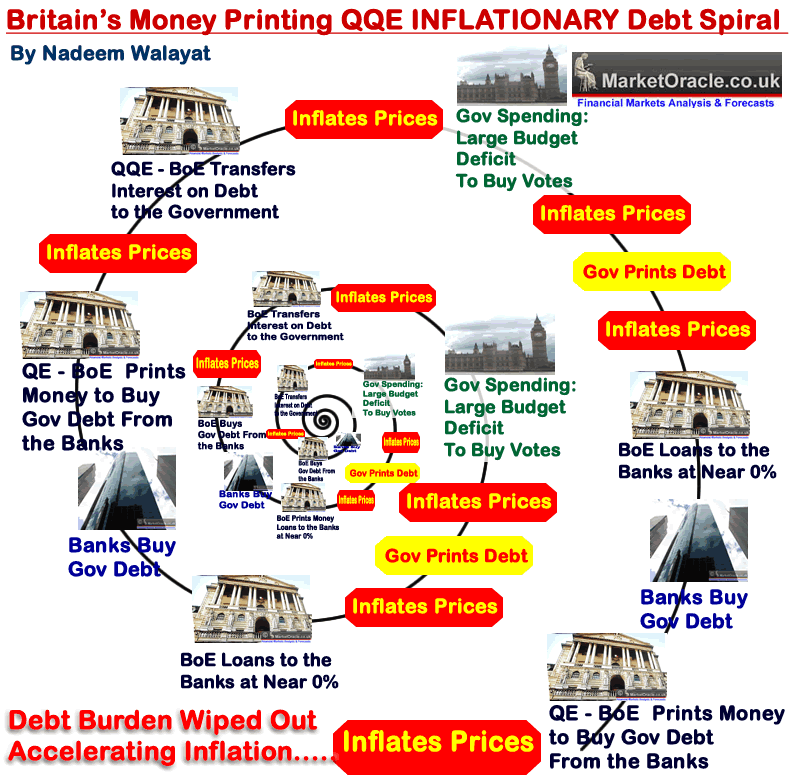
However, it is never going to happen, or rather not under any western style democracy, for this I don’t need to indulge myself in in-depth analysis but direct readers attention to what continues to take place in the Euro-zone where the PIIGS countries having adopted pseudo sound money of the Euro have found themselves in the precise predicament of where they would be had they had a Gold standard, namely that they are unable to just print debt and money to buy votes with the stealth default consequences of inflation, whilst on the other hand we have the examples of the United States and UK that can and do print debt and money in ever expanding volume as they seek to buy up their own bonds (via central banks buying from bankrupt banks who borrow form the central banks to do so) and thus subvert the official debt to GDP ratios as I recently discussed in length (03 Dec 2012 – Bank of England Cancels Britai n’s Debt) with the below graph illustrating the money and debt printing / cancellation highly inflationary game that Britain is playing.
So, if you have read any of my articles over the past few years you will know that the only answer that the governments of the world have is to print money and debt to inflate the debt and liabilities away, Sound money or even pseudo sound money prevents them from doing so and therefore ensures a deflationary depression, instead we are emerged in an inflationary depression which given the real world comparisons appears to be infinitely far more palatable to the masses and therefore explains why it is every government and central banks default setting.
So Gold bugs looking for sound money to turn Gold into Currency will probably find that their descendants will still be waiting a for such an outcome. Ironically, if Gold never becomes money (in our life-times anyway) it is still good news for if it were then it would probably mean that Gold’s future prospects would not be as good as they are under our fiat currency money / debt printing exponential inflation inducing monetary system as governments would seek to dictate what the price of gold should be rather than the current system of manipulation of all markets to varying degrees.
Now, whilst it has been been a long time since I last analysed or traded Gold and Silver. However, if you have been reading my articles you will be aware of the prevailing exponential inflation mega-trend as a consequence of government debt and money printing that continues to exert upwards pressure on asset prices and even more so when leverage is taken into account, therefore following the recent sell off in gold to $1660, a good 14% below its 2011 peak, which is perking my interest in the safe haven precious metals that this analysis seeks to resolve the probable trend for 2013.
Gold Forecast 2010-2012
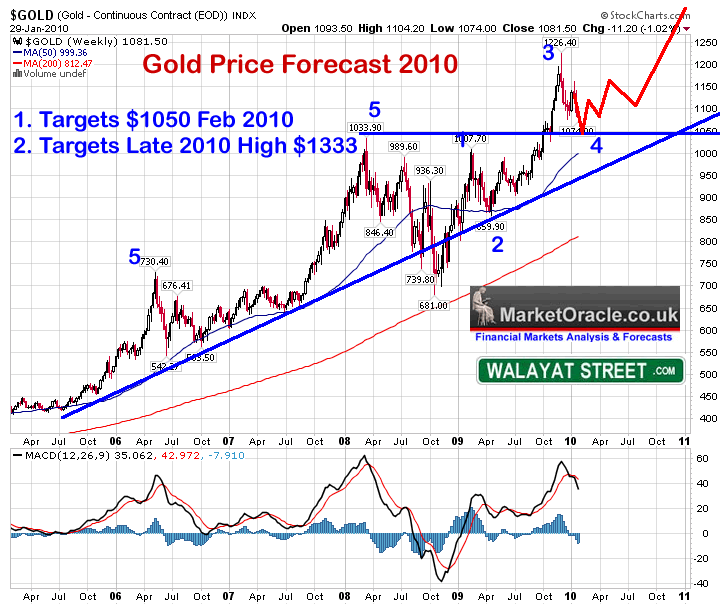
My last in depth analysis of Gold and Silver was several years ago at the start of November 2009 (01 Nov 2009 – Gold Bull Market Forecast 2009, 2010 Update)that was updated for the January 2010 Inflation Mega-trend ebook (Free Download).
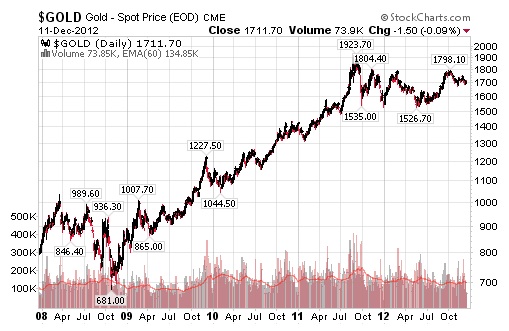
At the time Gold was trading at $1035, and the forecast for Gold was for a rally to a minimum of $1333 by late 2010 and a longer-term target of $2,000 for 2011, which is pretty much what came to pass during the next few years.
Gold can expect to gyrate towards its target of $1333 by late 2010, and continue further on into 2011 as the Gold price continues to look set to trend towards $2,000 which should be easily achievable within the next 3 years.
Gold Secular Bull Market
From 1980 to 1999 Gold fell for 20 years, eventually it would bottom and embark on a bull market, eventually, the signs for this would be not in fundamental data, but contained within the price chart as Gold breaks the pattern of corrective rallies followed by the downtrend resuming to new bear market lows. Some 10 years later (into mid 2011) Gold corrected the preceding secular bear market by 50% in time and well over 100% in price. The subsequent trend has seen what resembles a multi-year consolidation of that preceding bull run.
Central Banks Buying Gold – For many years central banks were net sellers of gold but over the past year have been buying at the rate of about 10% of annual new supply. Though don’t expect central bank buying to create a price spike as they would seek to avoid such an outcome by instead buying the dips.
Global Quantitative Easing aka Money Printing Hedging
We are in a new world (for the west anyway) and that is a world of Quantitative Easing, the more the governments of the world print money and monetize debt the easier it is for governments to keep printing and monetizing ever escalating amounts of government debt to cover the government budget deficit gaps. Upon which the accelerant of the Quantum of Quantitative Easing has been poured i.e. Governments paying themselves interest on monetized debt (20 Jul 2012 – The Quantum of Quantitative Easing Inflation is Coming! )
The US Fed recently revealed that its priority now is to target 6.5% Unemployment (7.7%) rather than inflation, in which respect it is engaged in a policy of QE4Ever -(01 Oct 2012 – Socialist Global Central Bank Crime Syndicate QE-4-Ever Inflation Theft)
What this means is collective currency devaluation where relatively there appears to be little change in currency rates but in real terms the flood of money consequences is for upward pressure on commodity prices and other scarce resources, after all the supply of resources is mostly known and the population of the world is not decreasing so the demand is known to be on an upward curve. Therefore as long as the central bankers are embarked on escalating quantitative easing that continues to put upwards pressure under the gold price and other commodities as it increases inflation expectations and therefore inflation hedging using gold and more liquid commodities such as crude oil.
Therefore in terms of Gold price action, we can expect the central banks to have effectively put a floor under the Gold price which the price charts implies is around $1550.
ZIRP – Zero interest rates are likely to continue until the markets force the central banks hands, which is something that there is no sign of at this point. ZIRP is a strong positive for Gold due to negative real interest rates and therefore indicates continuing upwards pressure on Gold price for as long as ZIRP continues.
Inflation Driving Gold Price?
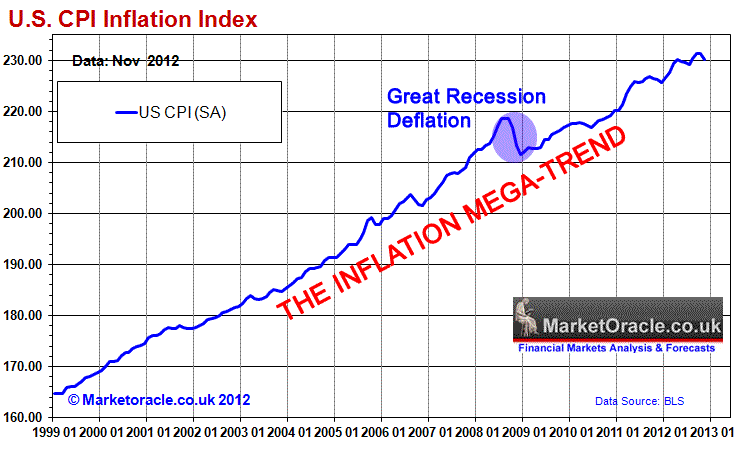
The above graph clearly illustrates that even on the official CPI inflation measure (which tends to under report real inflation), that the US is no different to any other country which contrary to the delusional deflation propaganda is instead immersed in what has always been an exponential inflation mega-trend which vested interests and what can be only termed as deflation fools have been blindly regurgitating the threats ever since the Great Recession of the 2008-2009, which the above graph clearly illustrates amounted to nothing more than a mere blip or as I warned at the time of a deflationary ripple on the surface of an ocean of Inflation.
The Inflation Mega-trend Ebook of Jan 2010 (FREE DOWNLOAD), re-iterated that asset prices tend to be LEVERAGED to Inflation, which is precisely the trends that have subsequently transpired from stocks to commodities such as Gold and as I have been flagging during 2012, the housing markets, in which respect I will be taking a detailed look at the US housing market in the near future, ensure you are subscribed to my always free newsletter to get this in-depth analysis and concluding trend forecast in your email in box.
However, even when taking into account Gold being leveraged to the Inflation Mega-trend, Gold rising by more than 300% over the past 10 years is well beyond the rise in CPI of 29%, so is much more a sign of a great deal of speculative interest than being driven by fundamentals. And another point for the Gold bug to consider is that in the late 1970’s inflation was running at more than 10% per annum!
So whilst gold has not experienced a bubble spike, however it’s relentless 10 year slog higher has accumulated much speculative interest that the subsequent 1.5 year corrective trend has been seeking to unwind, which still remains well above that which pure inflation indexation would have delivered over the same time period even after allowing for leverage, so one cannot look to the ongoing inflation mega-trend to generate additional over leveraged gains, instead the same trends imply that Gold needs to further dissipate speculative interest and therefore implies a continuation for a trading range.
U.S. Dollar Collapse?
One of the calls for why Gold will go higher is due to a sharp drop or even collapse of the US Dollar that many proponents have been stating for over the past 3 years. However the actual dollar trend shows that the dollar is in fact little changed. This is not as a consequence of dollar strength but that all currencies are in a state of perpetual free-fall against one another that manifests itself in asset and consumer price inflation.
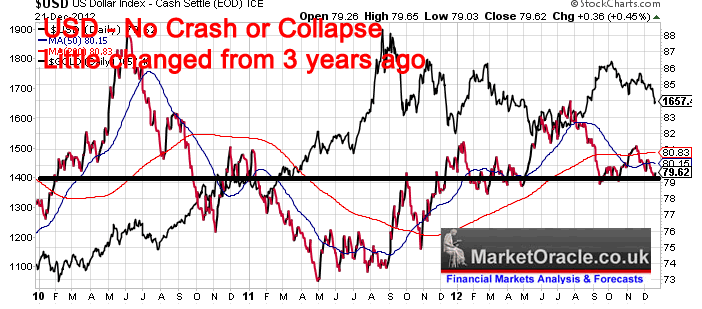
The chart also shows synchronicity between Gold and USD trends i.e. there are times when Gold and USD move with each other and at other times against. Current price action has both in synch in terms of trend, such cycles tend to persist for about 6 months, which implies the current phase has another 3 months to run. A quick take on the USD implies a continuing trading range.
Gold Annual Percent Change
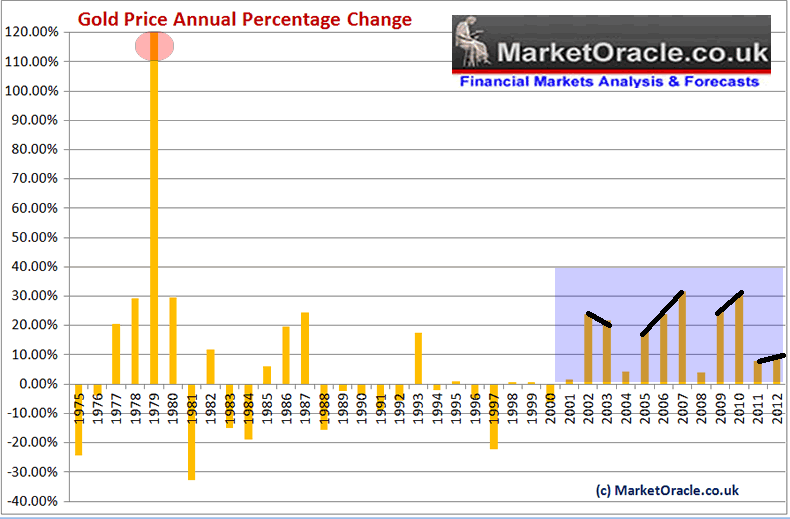
The annual % change graph further illustrates that whilst Gold has not experienced a short-term price spike along the lines of that of 1979, however one can see that it has experienced several spikes that were spread out over a number of years i.e. into 2003, 2007 and 2010. With the intra-2011 spike not registering as Gold experienced a sharp sell off into the end of that year.
What does this suggest for Gold going forward ?
That the best gains for the gold bull market are probably behind us, i.e. that Gold despite intra-year spikes is unlikely to experience annual gains of much more than about 10% per year with the probable range of between +4% and +10% per annum, which is the year end range one can expect for Gold for 2013, or a target price of between $1726 and $1826, which is not exactly what many gold bugs will be dreaming of i.e. a 1970’s style spike for which I do not see any signs of materialising at least for several years, let alone for Gold to actually hold a break to new all time highs thus probability favours the bull market continuing at a far more subdued rate. So another warning not to get carried away by the uttering’s from a long list of Gold bugs such as Marc Faber and Jim Rogers who keep banging the drums for a bubble spike that may never materialise (over the next 5 years).
ELLIOTT WAVE THEORY – The elliott wave pattern implies that Gold had an ABC corrective pattern into June 2012 since which it has had an impulse wave 1, and in the midst of coming to an end of a wave 2 correction, and therefore implying that Gold is set for an Impulse wave 3 to new all time highs! i.e. the elliot wave pattern is strongly bullish, which is contrary to most of this analysis. However rather than entertaining alternative counts that will only seem probable with the benefit of hindsight, in this analysis I am discounting elliott wave as not giving me a reliable probability, the picture is just too neat, for it to actually materialise.
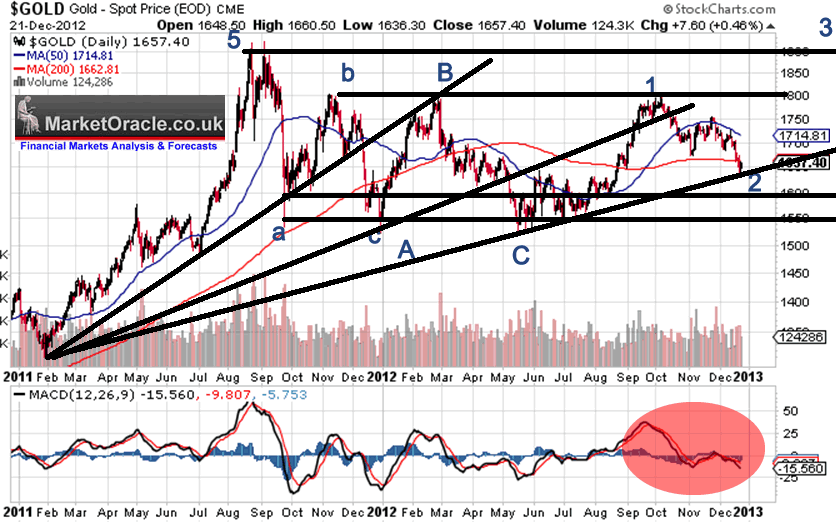
TREND ANALYSIS – Gold repeatedly failed to hold the uptrend lines which keeps resolving in breaks lower. That is the pattern that the current trend line support suggests as being most probable, i.e. an imminent bounce higher towards $1710 and then another break of the trendline support which would target a trend towards $1550. Furthermore shallow trendlines imply less volatile trends for 2013, i.e. shallow up and down trends within the prevailing range.
SUPPORT / RESISTANCE – Gold is in a range trading channel, the main resistance is at $1800 and support at $1550, with a break above $1800 targeting $1900. Whilst support at $1550 looks quite strong, thus suggests a strategy of buying downtrends towards $1550 for range rallies to $1800, with potentials for a break higher that would next target resistance at $1900. Current price action in terms of the range appears to resolve towards $1550 during Q1 2013, before we can expect the next assault on $1800.
However the problem with ranges is that it is difficult to determine at what point the price breaks out, and the ultimate probability is for Gold to break higher, to first $1900 and then $2000 and the longer the range goes on the harder it tends to become for the price to actually breakout and therefore more difficult to forecast. Which means given the 18 months to date, gold could stay stuck in this range for the whole of 2013.
PRICE TARGETS – The immediate target is a low above $1550, the reaction from which suggests $1800.
MACD – The MACD indicator is weak and showing no signs of an imminent bottom, in fact it is confirming that Gold could trend lower for at least another month into late January which would time with the probability for a continuing downtrend towards $1550 and a risk that Gold could remain weak even into late February.
SEASONAL TREND – There is a strong seasonal tendency for gold to rally from November through January, however Gold is clearly not following the seasonal trend which implies inverse expectations. Therefore a weak Jan, Feb and stronger March and April.
Gold – Silver Ratio – Which is Cheaper?
On face value the gold-silver ratio chart implies that Silver is cheap. BUT Silver is heavily dependant upon sentiment, i.e. it needs a strong trend for gain against Gold. Whilst in a shallow trend or a trading range will continue to see silver increasingly lag behind Gold, which means that whilst Silver is cheaper than Gold, given expectations for a continuation of the Trading range, silver could yet get even cheaper relative to Gold i.e. as was the case during the first half of 2010.
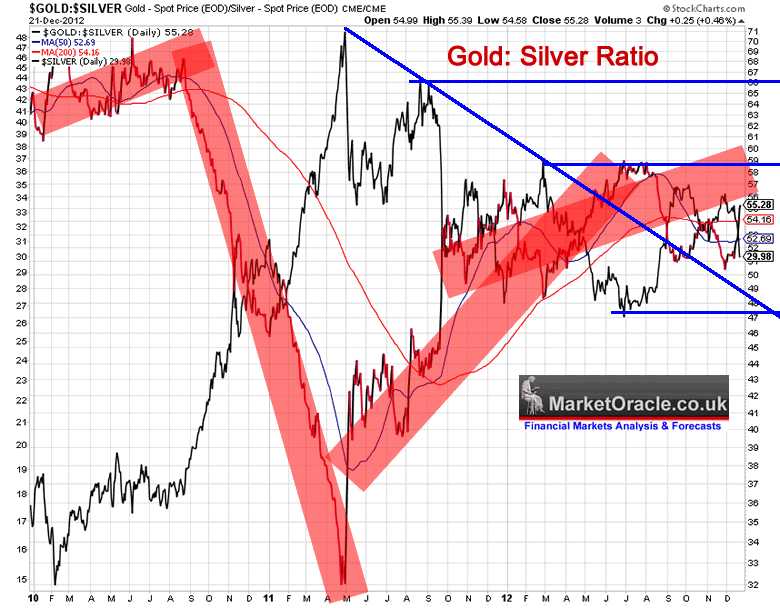
However should Gold breakout higher above $1800 we will see Silver start to significantly outperform, so I will definitely be keeping an eye on silver especially near Gold lows of $1550 as it would be trading at deeper discount.
Gold Risks of a Down Year
Gold has not had a down year for 12 years! Add to that expectations of a trading range of 1800 to 1550. Throw in a close of $1660, and annual volatility of 20% and then that implies a 40% risk of a down year, i.e. a close below $1660, which could yet worsen if Gold rallies into the end of the year i.e. Gold closing the year at say $1710 would imply a 60% chance of a down year, whilst a close at $1600 would imply just a 20% risk of a down year.
Gold Price Forecast Conclusion
The bottom line is that whilst the Gold bull market will likely continue until ZIRP ends, however Gold bugs are not going to like hearing that the best years of gains are now probably behind gold, and that the best they can expect to achieve is gains of about 10% per annum as Gold is now in a mature bull market. Therefore my analysis resolves to the following key conclusions for 2013 –
1. That Gold looks set to trade within a range for most of the year of between $1550 and $1800.
2. That Gold should trend higher towards the end of the year with overall probability targeting a year end close in the region of $1760, which on the last close of $1660 implies a gain of about 6%, with a 40% risk of a small down close year i.e. between $1659 and $1550.
The below graph better illustrates how the Gold price could trend during the year.

The risks to the forecast are that the Gold price breaks higher to first target $1900.
My Gold Investing / Trading Strategy
 I will be adopting two potential strategies.
1. I will eye accumulating Gold when it is sub $1580 for long-term investments, probably upto 6% of total portfolio (Gold and Silver). Silver offers the better long-term opportunity in terms of risk vs reward off of the lows due to expectations for a deeper discount and greater long-term potential.
2. I will attempt to trade the range when opportunities arise i.e. buy off of $1550 triggers and exit from $1800 triggers. With the risk of an ultimate breakout higher I will refrain from trading the short-side. Also remember trading commodities is extreme high risk!
Ensure you remain subscribed to my always free newsletter to get my next in-depth analysis and concluding trend forecast.
Source and Comments: http://www.marketoracle.co.uk/Article38201.html
Happy Holidays
&
a Prosperous New Year
By Nadeem Walayat
Copyright © 2005-2012 Marketoracle.co.uk (Market Oracle Ltd). All rights reserved.
Nadeem Walayat has over 25 years experience of trading derivatives, portfolio management and analysing the financial markets, including one of few who both anticipated and Beat the 1987 Crash. Nadeem’s forward looking analysis focuses on UK inflation, economy, interest rates and housing market. He is the author of three ebook’s – The Inflation Mega-Trend; The Interest Rate Mega-Trendand The Stocks Stealth Bull Market Update 2011 that can be downloaded for Free.

Dec 2011 Takedown followed by a rally

Ed Note: Peter is comparing the Similar $250+ Decline ending Dec /2011 seen above to the $250 decline as seen on Dec /2012 Chart below. (Peter’s Silver Chart Below)


 Ooops! Just when everyone said gold must go higher – immediately…!
Markets are made of opinions, some better than others.
There are always plenty of opinions about gold. And right now they’re clearly making the market. Just not in the way you would think.
“There are too many bulls, including me,” warned hedge-fund and commodities legend Jim Rogers toCNBC overnight. He advises caution if you’re buying gold on this drop. Unlike most everyone else.
Swiss bank UBS last week kept its 2013 forecast for gold to average $1900 per ounce – a rise of 14% from the 2012 average so far – while fellow London market-maker Barclays now sees gold averaging $1815 next year, a snip off its previous 2013 forecast.
Investment bank Morgan Stanley takes “a bullish view”, as does Bank of America. It thinks gold will average $2,000 next year, rising to $2,400 in 2014. Whereas Capital Economics (who have an opinion on pretty much anything and everything) predict a peak of $2,200 in late-2013, some 10% above their previous guesstimate.
Never mind that 2013 used to mean $2,500 per ounce for the London-based consultancy. That was back in 2011. And like many a gold bull right now, Capital Economics reckons the treatment of gold under the world’s banking rules – aka, Basel III – could “provide an important psychological lift to the market.”
How come? “European regulators appear increasingly willing to recognise gold as a high quality liquid asset,” explains today’s note from Julian Jessop, head of commodities research, pointing to a much-discussed – but little understand – change in banking regulation.
“Others are likely to follow. Increased demand for gold to meet the tougher liquidity requirements could then go some way towards mitigating what might otherwise have been a large downside risk when the authorities do eventually take away the exceptional liquidity they have provided to the banking system.”
You can find the same opinion – only with less understanding, subtlety or caveating – pretty muchacross the internet. Beware any “analyst” who says gold is about to become a “Tier 1” asset (that refers to capital reserves, not liquidity). Also beware if they claim it’s about to happen, like immediately, starting on New Year’s Day!
Because most of the developed world struggled to implementing Basel II – the last set of agreed principles. Putting Basel III into place by 2013 is now an “ambition” most national regulators have delayed and deferred well into the never-never. And gold’s new status under those rules is still very far from certain. It may perhaps be valued at 50% of its price when regulators count up the liquid reserves a bank holds. Or it might yet get carried at 100% of market-price, causing a headache for the beancounters as the price moves up (or down – shhhh!) minute by minute.
Still, the possible re-assessment of gold as “a high quality liquid asset” would mark a significant step after 12 years of annual price gains. It would mark gold’s “growing use as collateral”, as Capital Economics say. That would mark a new stage in gold’s return to the banking system from hated, under-priced and un-holdable relic. Not dissimilar, perhaps to gold’s return as an investable asset for US citizens on New Year’s Day 1975.
For more than three decades gold bullion had been illegal to own in the United States. Gerald Ford’s executive order to remove that block clearly helped the long 1970s’ bull market run on towards its big 1980 top. US savers had already missed out on a five-fold gain. Now the wealthiest savings market in the world could participate in the inflation-fuelled gold bull market at last!
But ooops…

“Gold rose 600% in the 1970s,” said Jim Rogers back in 2007. “Then gold went down nearly every month for two years. Most people gave up.”
You can’t blame investors who quit the gold market between 1975 and 1977. The gold price fell very nearly in half after all. But that is simply “what happens in bull markets,” said Rogers. And between 1977 and 1980, “gold went up another 850%.”
Fast forward to end-2012, and “Gold is having a correction,” said Jim Rogers last night. “It’s been correcting for 15-16 months now, which is normal in my view, and it’s possible that [the] correction is going to continue for a while longer.”
And just in time for the much-hyped entry of new commercial bank buyers, too. Or so says this opinion.
Looking to Buy Gold or physical Silver Bullion today…?
Adrian Ash runs the research desk at BullionVault, the physical gold and silver market for private investors online. Formerly head of editorial at London’s top publisher of private-investment advice, he was City correspondent for The Daily Reckoning from 2003 to 2008, and is now a regular contributor to many leading analysis sites including Forbes and a regular guest on BBC national and international radio and television news. Adrian’s views on the gold market have been sought by the Financial Times and Economistmagazine in London; CNBC, Bloomberg and TheStreet.com in New York; Germany’sDer Stern and FT Deutschland; Italy’s Il Sole 24 Ore, and many other respected finance publications.
The Fed continues with its “QE forever” easing program. But something new has been added. The Fed now wants the unemployment rate to be at 6.5%, and they’ll keep rates around zero until that happens.
Bill Gross is founder and co-CEO of Giant PIMCO. Gross is a member of BARRON’S Roundtable and is highly respected on Wall Street. Gross is a bond-man, and I don’t ever remember him saying anything about gold.
Bill Gross says only gold and real assets will thrive in fiscal ‘ring of fire.’
By Claudia Assis – The latest round of quantitative easing made gold “even more attractive” and owning the metal should be considered as part of a diversified portfolio, analysts at bond giant Pacific Investment Management Co. said in a white paper posted Tuesday on the company’s website.
Pimco founder and co-chief investment officer Bill Gross, in his separate monthly investment outlook also posted Tuesday, said only gold and real assets would thrive in a “ring of fire” of U.S. fiscal problems.
Gold GG elicits black and white responses, the Pimco analysts said. Some investors “have a deep, almost religious conviction that gold is a useless, barbaric relic with no yield,” while others “love it” and see it as “the only asset that can offer protection from the coming financial catastrophe” always just around the corner, they said.
“Our views are more nuanced … Our bottom line: given current valuations and central bank policies, we see gold as a compelling inflation hedge and store of value that is potentially superior to fiat currencies,” the analysts said. “We believe investors should consider allocating gold and other precious metals to a diversified investment portfolio.”
Other investments, such as Treasury Inflation-Protected Securities, offer an inflation hedge. TIPS are also less volatile than gold. History shows, however, gold’s high correlation to inflation and gold’s unique supply-and-demand characteristics may lead to attractive valuations, the analysts said.
In his piece, Gross warned the U.S. would no longer be “the first destination of global capital” seeking safe returns if it doesn’t address its fiscal gap. The U.S. “will begin to resemble Greece before the turn of the next decade” if it continues to close its eyes to deficits, Gross said.
“Unless we begin to close this gap, then the inevitable result will be that our debt/GDP ratio will continue to rise, the Fed would print money to pay for the deficiency, inflation would follow and the dollar would inevitably decline. Bonds would be burned to a crisp and stocks would certainly be singed; only gold and real assets would thrive within the ‘ring of fire,’” Gross said.
A financial Armageddon is not around the corner, Gross said. “I don’t believe in the imminent demise of the U.S. economy and its financial markets. But I’m afraid for them,” he said. Gross runs the world’s biggest bond fund, Pimco Total Return Fund. The fund in August took in $1.3 billion in new cash, bumping total inflows for the year to $9.3 billion. -Claudia Assis
Below we see five years of gold. Big correction below 1800. If gold breaks out of this correction on the upside, we should see fireworks.
To subscribe to the 88 Yr Old Godfather of newsletter writers. Richard Russell’s Dow Theory Letters CLICK HERE.
About Richard Russell
Russell began publishing Dow Theory Letters in 1958, and he has been writing the Letters ever since (never once having skipped a Letter). Dow Theory Letters is the oldest service continuously written by one person in the business.
Russell gained wide recognition via a series of over 30 Dow Theory and technical articles that he wrote for Barron’s during the late-’50s through the ’90s. Through Barron’s and via word of mouth, he gained a wide following. Russell was the first (in 1960) to recommend gold stocks. He called the top of the 1949-’66 bull market. And almost to the day he called the bottom of the great 1972-’74 bear market, and the beginning of the great bull market which started in December 1974.
The Letters, published every three weeks, cover the US stock market, foreign markets, bonds, precious metals, commodities, economics –plus Russell’s widely-followed comments and observations and stock market philosophy.
Logic suggests that the gold price should be riding much higher than it is at present – what is keeping it down?’
The gold market has been denying all logic. Virtually everything which is happening in the global economy suggests that the price should be rising – and probably rising fast, yet it has been unable to move out of a trading range of between around $1680 – $1750 – and every time it nears the top of this range it gets knocked back again. It certainly has made some weak holders pull out of the gold market altogether, while other half believers are beginning to find the call from gold experts that they should use the dips as buying opportunities frustrating to say the least – and they may fall out of the market too.
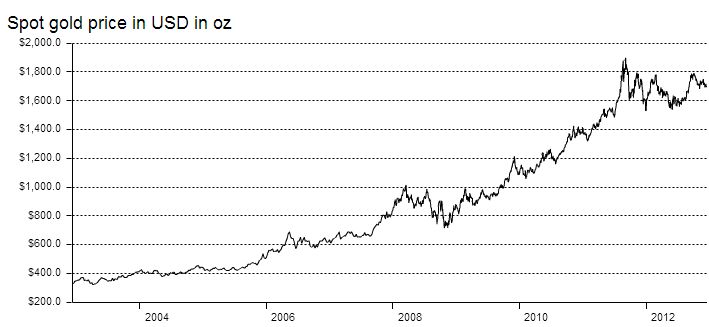
It’s actually interesting to look at the chart of the gold price running back ten years or so:
….read more HERE

-
I know Mike is a very solid investor and respect his opinions very much. So if he says pay attention to this or that - I will.
~ Dale G.
-
I've started managing my own investments so view Michael's site as a one-stop shop from which to get information and perspectives.
~ Dave E.
-
Michael offers easy reading, honest, common sense information that anyone can use in a practical manner.
~ der_al.
-
A sane voice in a scrambled investment world.
~ Ed R.
Inside Edge Pro Contributors

Greg Weldon

Josef Schachter

Tyler Bollhorn

Ryan Irvine

Paul Beattie

Martin Straith

Patrick Ceresna

Mark Leibovit

James Thorne

Victor Adair