
Gold & Precious Metals
While Gold is very close to a major breakout (in price) its strength has not filtered down to Silver yet. Gold is 3% away from a major breakout and comfortably above its long-term moving averages. However, Silver is well below its 2016 high and is currently battling its 200-day moving average. But that is okay. Silver typically lags and underperforms Gold until Gold gains momentum or breaks key resistance. A major breakout in Gold this year and its effect on Silver is just one reason why Silver could have a big year.
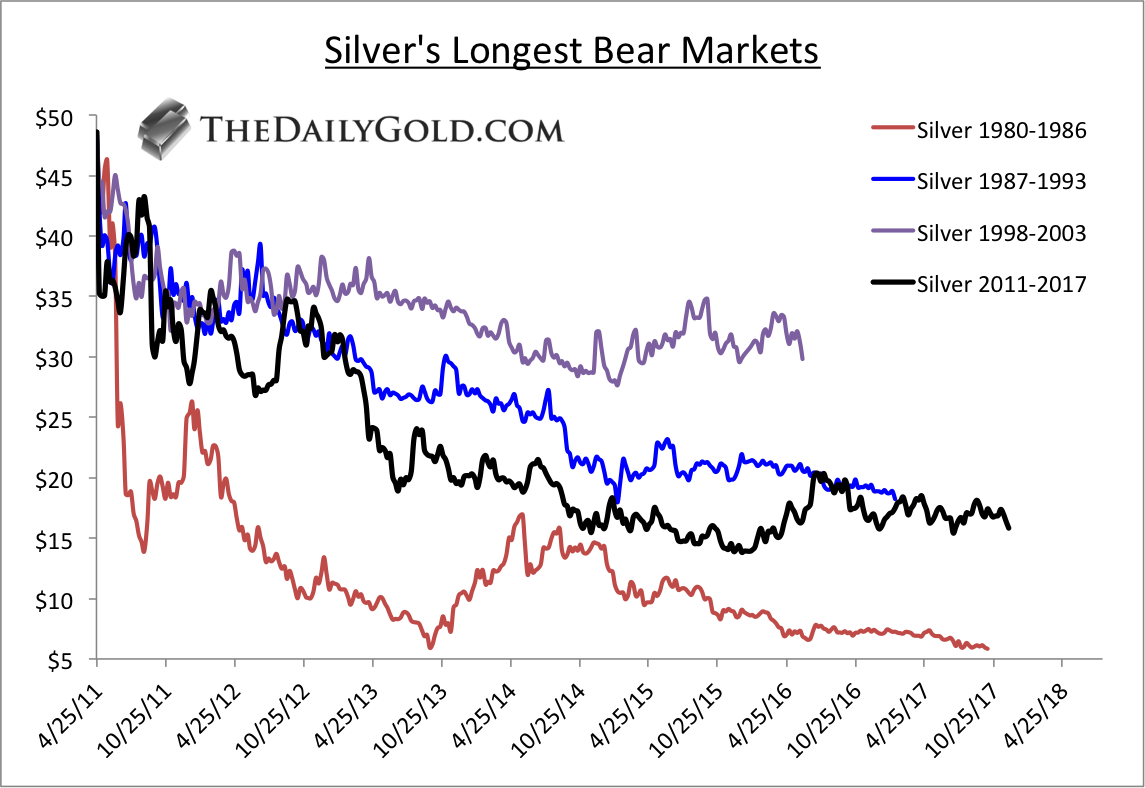
If and when Silver breaks above its 2017 highs, we can declare its bear market over (in terms of time). The chart below plots all of the major bear markets in Silver. They all end at the point when Silver begins to make higher highs and rises in an impulsive fashion. Silver’s bear market was the second worst by price and potentially the worst in terms of time.
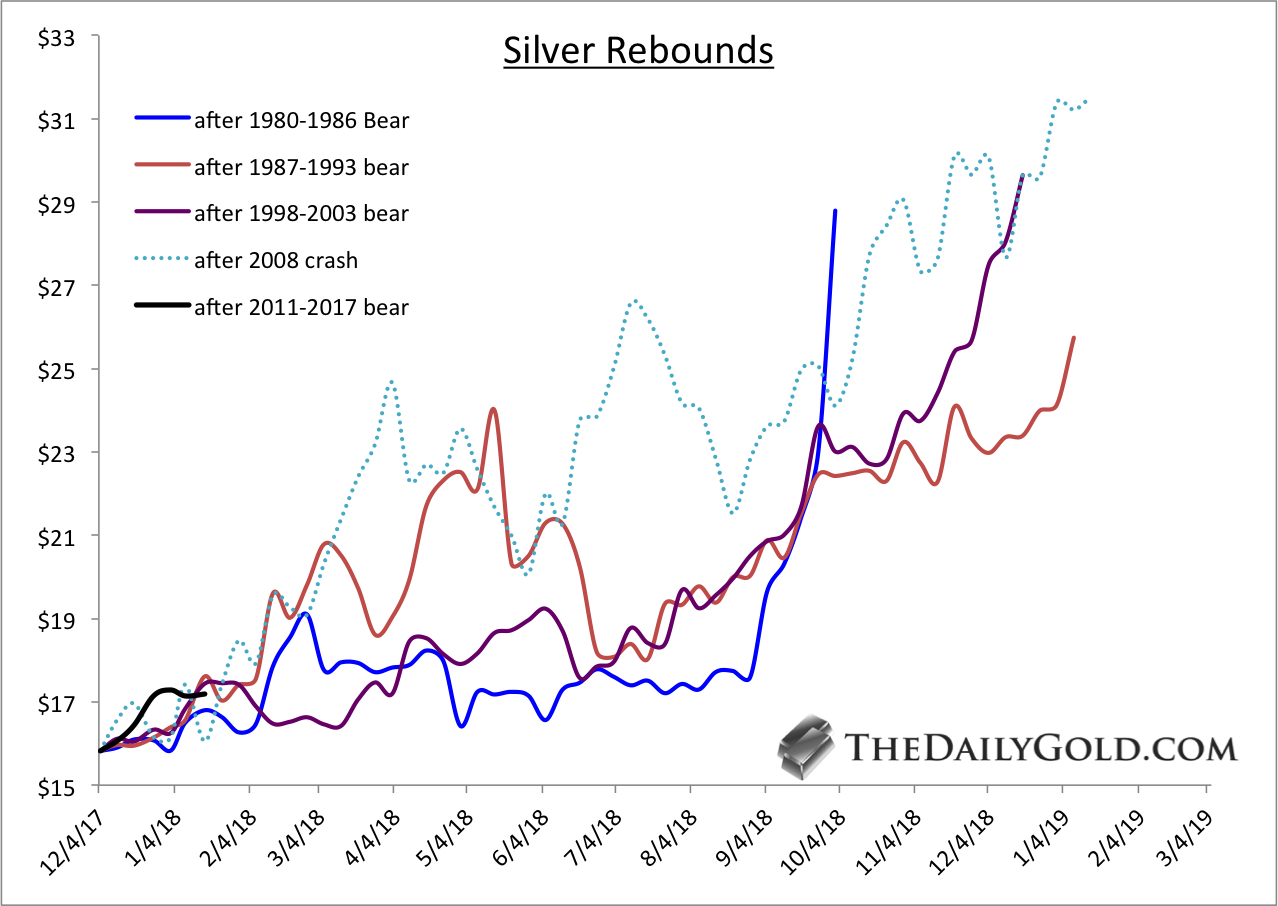
The next chart shows the rebounds in Silver from the endpoints in the previous chart. From the three endpoints Silver rebounded significantly in the next 12-15 months. We also included the 2008 crash from which Silver rebounded 100% in the following 13 months.
Turning back to the present, we find $20 on a monthly closing basis to be the most significant resistance for Silver. The chart below is a plot of monthly closing prices. It is quite clear that a monthly close above $20 (the 2016 high) could kickstart a good run for Silver.

Moving from the very long-term to the present, we note that Silver faces initial resistance at trendline 2 as well as the 2017 highs near $18/oz. That stands between Silver at present and the important $20 resistance (which is also shown at trendline 1).

Silver has often rebounded nearly 100% within 12-15 months after bad and long bear markets. History says Silver is ripe for a similar move over the next 12 to 18 months. Since Silver follows Gold, a breakout in Gold could be a huge catalyst for Silver to test and break resistance at $20/oz. If that happens, Silver would be on its way to another, typical substantial rebound. It has happened before and we expect it will happen again. We already own a few juniors with the best silver deposits but we continue to look for junior explorers and silver plays with 5 to 10-fold potential that could benefit from a breakout in precious metals.
Good Luck

Ttoday’s videos and charts (double click to enlarge):
SFS Key Charts & Video Update


SF60 Key Charts & Video Update


SF Juniors Key Charts & Video Analysis


SF Trader Time Key Charts & Video Analysis


Morris
Frank Johnson: Executive Editor, Macro Risk Manager.
Morris Hubbartt: Chief Market Analyst, Trading Risk Specialist.
website: www.superforcesignals.com
email: trading@superforcesignals.com
email: trading@superforce60.com

Metals are setting up for that “Rip Your Face Off Rally”. The following charts for Gold and Silver show a very interesting setup that is unfolding as the US markets continue to strengthen – that being that the Metals are showing strength in price and we can only assume this is related to some level of FEAR in the markets or expectations that the “Equities and Bitcoin Bubbles” are nearing an end.
Gold and Silver have been one of our primary focuses for years. We warned of the “Rip Your Face Off” rally near the Third Quarter 2017 as our cycle analysis was bottoming in December.
The recent rally in Gold has been substantial and has managed to breach recent resistance levels near $1300~1310. At this point, we are expecting a moderate pullback in Gold over the next few weeks to levels likely near or below the $1300 level before the next leg advances well above $1380. The presumed formation of Wave 3, if our analysis is correct, should prompt a massive move in the metals over the next 3~7 months with a number of pullbacks along the way. Right now, it all depends on how Gold reacts to the recent highs and how deep the next retracement in price is. We could see a $1270~1300 level price pullback before the next leg higher executes. This would be the best entry zone for both traders and long-term investors.

Silver is the “forgotten shiny metal” by many. As we have been warning our readers, this next move in the Metals market should be a massive Wave 3 (or completed Wave 5 that will prompt a Wave B correction). Either way, this next move could end substantially higher than where current prices have been consolidating. Because of the expected continued rally in the US equities markets and because of the strong growth in the economic fundamentals, we believe the next contraction phase in the Metals will be a very opportunistic BUY ENTRY ZONE for traders.
Silver, which has not shown the volatility or price activity that Gold has recently shown, is one of those markets that many people forget about. Yet, Silver has so much more opportunity for massive price gains as related to the setups that are currently playing out in the US and global markets. As fear builds and global markets react to the Everything Bubble, Crypto volatility, Global Market Concerns and Global Political Concerns, the Metals are certainly going to be an interesting and opportunistic play for traders.
As you can see from this Silver Weekly chart, the setup in Silver is similar to the Gold chart, yet the price activity in Silver is very much more muted in volatility than Gold. We believe that Silver, when the move happens, will show substantial price acceleration to the upside while Gold continues to rally.

2018 is setting up to be a very good year for BOTH traders and long-term investors as the opportunities for skilled and strategic trades is astounding. Visit our website to learn more about the markets and to receive our daily updated market predictions and trade alerts.
By Chris Vermeulen
 Technical analyst Clive Maund discusses why he believes a massive new sector bull market is about to begin in gold and silver.
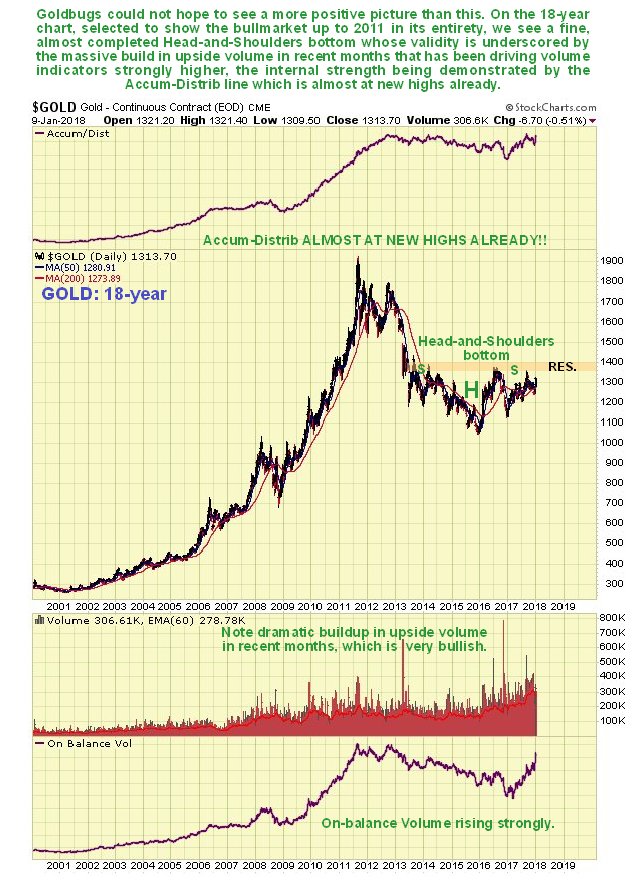
When you are following the markets closely day after day it can be easy to lose sight of the big picture. So with the “everything bubble” getting closer to bursting, leading to universal mess and mayhem, there could not be a better time to look at the long-term picture for gold and silver, in order to see whether they are going to salute and go down with the ship, as they did in 2008, or constitute a lifeboat and a profitable means of escape for more fortunate investors.
I am therefore pleased to be able to report that it will almost certainly be the latter, for reasons that we will now elucidate on the respective long-term charts for gold, then silver.
On gold’s latest 18-year chart—a time period selected to show the prior 2000’s bull market in its entirety—we can readily see that a potential Head-and-Shoulders bottom has been forming since 2013, and the probability that this is the genuine article, the “real deal” is vastly improved by the dramatic increase in upside volume over the past two years as this base pattern has approached completion, which has driven volume indicators strongly higher over the past year, such that, rather incredibly, the Accum-Distrib line is already close to making new highs, which is a very bullish indication indeed.
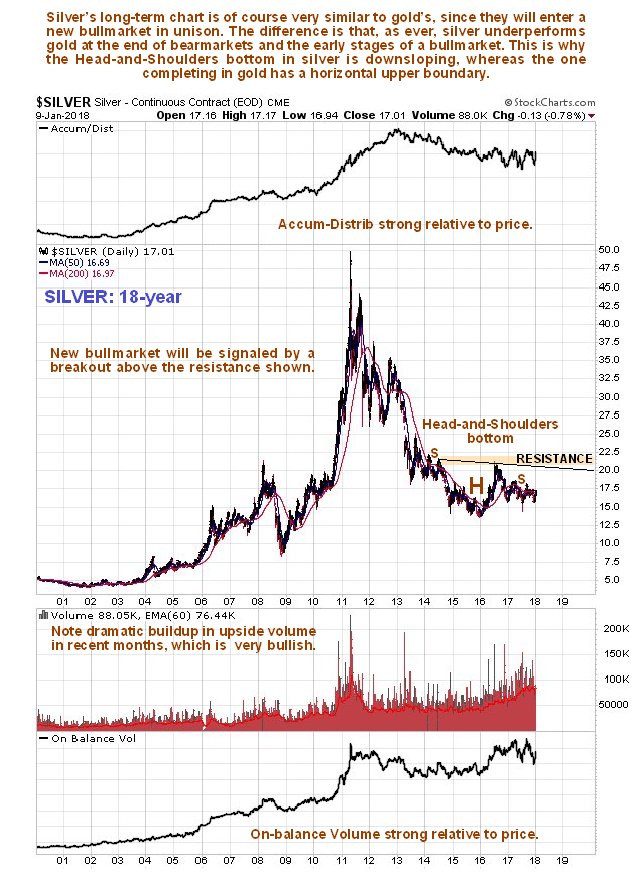
It’s pretty much the same story for silver, with two key differences—silver’s Head-and-Shoulders bottom is downsloping and the volume indicators are not quite as strong. However, these manifestations are not negative, for it is normal for silver to underperform gold towards the end of a sector bear market and during the early stages of a bull market.
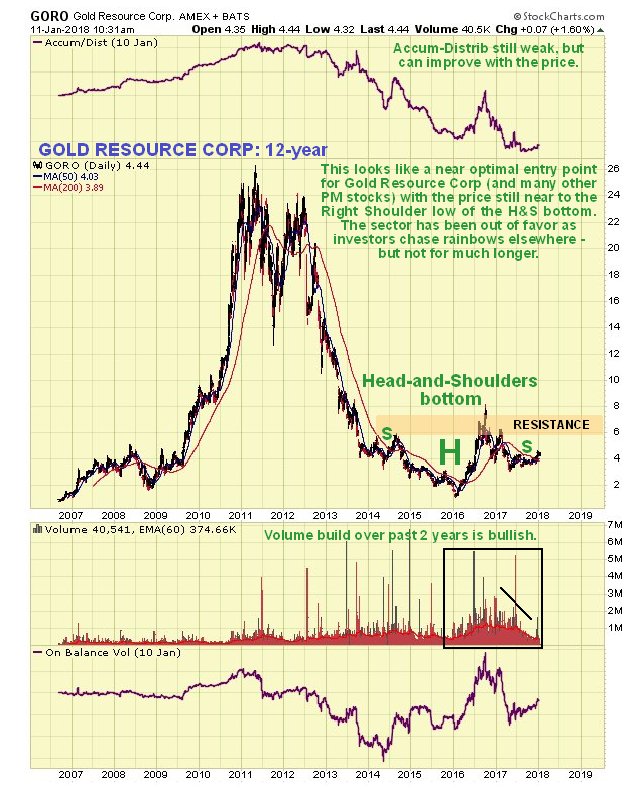
Are there any precious metals stocks showing similar bottoming patterns? There certainly are—loads of them, and we will have a look at two examples here, one for a larger gold stock and one for a larger silver stock, to illustrate the point, so that you will understand that this is not just an academic exercise—and that you are currently being showered in opportunities to make big money in this sector.
The long-term chart for Gold Resource Corp. (GORO:NYSE.MKT) shows that it is completing a giant Head-and-Shoulders bottom that parallels the one in gold itself, and since the price is still quite close to the low of the Right Shoulder low of the pattern, it is at a good entry point.
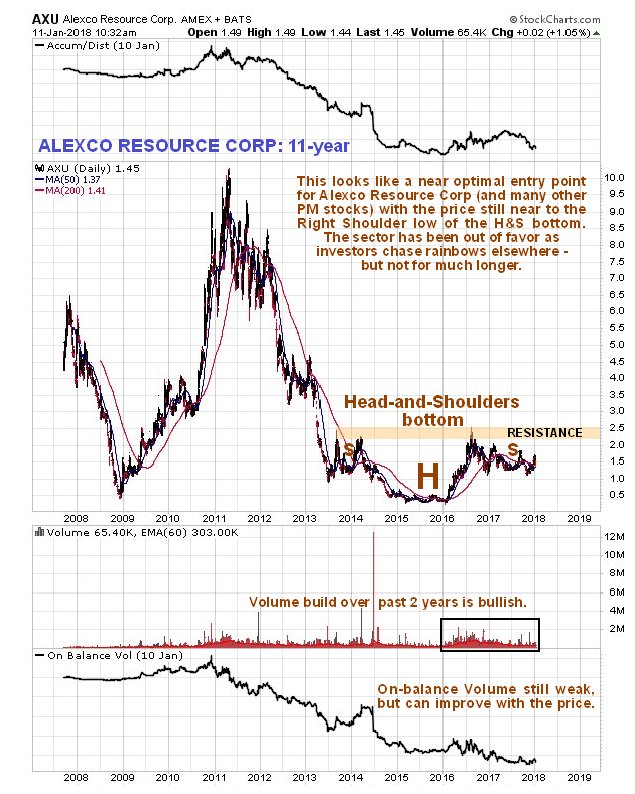
The long-term chart for Alexco Resource Corp. (AXU:NYSE.MKT; AXR:TSX) shows that it is completing a fine giant Head-and-Shoulders bottom that parallels the one in silver itself, although it is not downsloping, and since the price is also still quite close to the low of the Right Shoulder low of the pattern, it too is at a good entry point.
Gold and silver have not done well in recent years, having been completely overshadowed by the broad stock market and more glamorous sectors like Biotech, Cannabis, Cryptocurrencies and the FANGS, etc. If they go roaring up, then it means that something else is going to have to go down, and that probably means most everything else in a market crash, which is already being predicated by action in the bond market and other factors, and all the easy money momentum chasers who are now almost everywhere are going to wind up being slaughtered en masse like Pilot Whales on a Faroes beach. We are not going to let that happen to us.
Clive Maund has been president of www.clivemaund.com, a successful resource sector website, since its inception in 2003. He has 30 years’ experience in technical analysis and has worked for banks, commodity brokers and stockbrokers in the City of London. He holds a Diploma in Technical Analysis from the UK Society of Technical Analysts.
Disclosure:
1) Clive Maund: I, or members of my immediate household or family, own shares of the following companies mentioned in this article: None. I personally am, or members of my immediate household or family are, paid by the following companies mentioned in this article: None. My company has a financial relationship with the following companies mentioned in this article: None. CliveMaund.com disclosures below. I determined which companies would be included in this article based on my research and understanding of the sector.
2) The following companies mentioned in this article are billboard sponsors of Streetwise Reports: None. Streetwise Reports does not accept stock in exchange for its services. Click here for important disclosures about sponsor fees.
3) Statements and opinions expressed are the opinions of the author and not of Streetwise Reports or its officers. The author is wholly responsible for the validity of the statements. The author was not paid by Streetwise Reports for this article. Streetwise Reports was not paid by the author to publish or syndicate this article. The information provided above is for informational purposes only and is not a recommendation to buy or sell any security.
4) This article does not constitute investment advice. Each reader is encouraged to consult with his or her individual financial professional and any action a reader takes as a result of information presented here is his or her own responsibility. By opening this page, each reader accepts and agrees to Streetwise Reports’ terms of use and full legal disclaimer. This article is not a solicitation for investment. Streetwise Reports does not render general or specific investment advice and the information on Streetwise Reports should not be considered a recommendation to buy or sell any security. Streetwise Reports does not endorse or recommend the business, products, services or securities of any company mentioned on Streetwise Reports.
5) From time to time, Streetwise Reports LLC and its directors, officers, employees or members of their families, as well as persons interviewed for articles and interviews on the site, may have a long or short position in securities mentioned. Directors, officers, employees or members of their immediate families are prohibited from making purchases and/or sales of those securities in the open market or otherwise from the time of the interview or the decision to write an article, until one week after the publication of the interview or article.
Charts provided by the author.
CliveMaund.com Disclosure:
The above represents the opinion and analysis of Mr Maund, based on data available to him, at the time of writing. Mr. Maund’s opinions are his own, and are not a recommendation or an offer to buy or sell securities. Mr. Maund is an independent analyst who receives no compensation of any kind from any groups, individuals or corporations mentioned in his reports. As trading and investing in any financial markets may involve serious risk of loss, Mr. Maund recommends that you consult with a qualified investment advisor, one licensed by appropriate regulatory agencies in your legal jurisdiction and do your own due diligence and research when making any kind of a transaction with financial ramifications. Although a qualified and experienced stockmarket analyst, Clive Maund is not a Registered Securities Advisor. Therefore Mr. Maund’s opinions on the market and stocks can only be construed as a solicitation to buy and sell securities when they are subject to the prior approval and endorsement of a Registered Securities Advisor operating in accordance with the appropriate regulations in your area of jurisdiction.

-
I know Mike is a very solid investor and respect his opinions very much. So if he says pay attention to this or that - I will.
~ Dale G.
-
I've started managing my own investments so view Michael's site as a one-stop shop from which to get information and perspectives.
~ Dave E.
-
Michael offers easy reading, honest, common sense information that anyone can use in a practical manner.
~ der_al.
-
A sane voice in a scrambled investment world.
~ Ed R.
Inside Edge Pro Contributors

Greg Weldon

Josef Schachter

Tyler Bollhorn

Ryan Irvine

Paul Beattie

Martin Straith

Patrick Ceresna

Mark Leibovit

James Thorne

Victor Adair