
Gold & Precious Metals
GOLD TRADING in London – heart of the world’s wholesale bullion market – leapt in September.
“The continued economic uncertainty in the Eurozone and US, the end of the holiday period and the start of the Indian festival season boosted clearing turnover,” says trade body the London Bullion Market Association, releasing the new data to members on Thursday.
But matched by a sharp rise in the size of gold-backed trust funds traded on the stock market (ETFs), these latest figures really suggest strong interest from hedge funds, investment banks and other institutions around the US Federal Reserve’s announcement of QE3, we believe.
Why QE3 as the catalyst? Because the so-called “smart money” had been hanging on Ben Bernanke’s every word all year…willing him to make free and easy with his electronic printing press once again. And why that group? Because the other potential buyers just weren’t so hot – buyers whose demand would have quickly registered back up the supply chain at the wholesale level – and certainly not hot enough to push Gold Trading through its world center in London to the third highest value on record.
Jewelry suppliers in India have kept a lid on their stockpiling, even ahead of the annual peak in demand due with Diwali in mid-November. Private households (aka “retail” investors) raised their demand in September, but not dramatically, as Bullion Vault’s own Gold Investor Index shows. And amongst those central banks who declare their hand each month to the International Monetary Fund (ie, everyone but China), September 2012 saw them pretty much flat overall as a group.
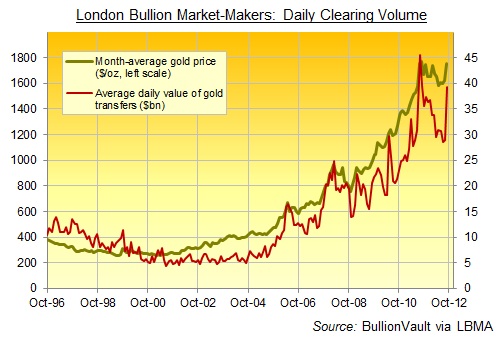
So you have to guess, therefore, that the so-called “smart money” was the big buyer, helping drive the daily value of Gold Bullion traded through London’s 11 big market makers more than 35% higher in September from August to its highest level since summer 2011’s all-time peaks.
Those 11 market makers – led by global investment-bank and London vault operators HSBC and J.P.Morgan, and all guaranteeing to quote firm Gold Buying and selling prices throughout the day – shifted some $39.2 billion-worth of gold between them on average each day last month. Make a guess at all of September’s other Gold Trading done via smaller bullion banks and dealers, all still quoting prices for settlement in London’s secure and accredited vaults, and the total could have reached to $350bn. That’s the multple suggested by spring 2011’s market-wide survey, undertaken by the London Bullion Market Association on behalf of the World Gold Council.
The aim of that report, in which the LBMA surveyed all its members, was to gauge the true depth and liquidity of the physical gold market. The previous best guess-timate – of a multiple between 3 and 5 times the average daily turnover reported by the big 11 banks – now looks it should stand nearer 8 times. Especially when Gold Trading gets hot, as it clearly did in September.
Some of that hot money has turned tail since. This month’s pullback so far has taken Dollar-gold 4% lower to $1700 per ounce. Perhaps hedge funds, bank traders and other private institutions simply booked early profits off their September Gold Trading. Or perhaps they’re disappointed that QE3 didn’t instantly send inflation soaring.
Give it time. “There is a great deal of ruin in a nation,” as Adam Smith calmly replied when told in October 1777 that Britain was ruined by its defeat by the American rebels at Saratoga. It took another 170 years for the British Empire to crest and collapse. Today’s limitless zero-rate money won’t have long.
Looking to Buy Gold or physical Silver Bullion today…?
Adrian Ash runs the research desk at BullionVault, the physical gold and silver market for private investors online. Formerly head of editorial at London’s top publisher of private-investment advice, he was City correspondent for The Daily Reckoning from 2003 to 2008, and is now a regular contributor to many leading analysis sites including Forbes and a regular guest on BBC national and international radio and television news. Adrian’s views on the gold market have been sought by the Financial Times and Economistmagazine in London; CNBC, Bloomberg and TheStreet.com in New York; Germany’sDer Stern and FT Deutschland; Italy’s Il Sole 24 Ore, and many other respected finance publications.

Following on the success of last year’s report we have decided to make the ranking of the world’s gold deposits an annual endeavor highlighting trends in future mine supply, depletion, discoveries, and in-situ grades.
With this research our goal was to provide quantitative answers to some of the questions we kept asking ourselves as investors in the space. Questions such as:
How many ounces of in-situ gold exist?
How many gold mines exist in Canada?
How rare is a 1.0 million ounce undeveloped deposit?
The report answers these questions and more while providing insight into the scarcity of mines & deposits. Additionally, having a granular view of the supply mix is useful as it allows market participants to ascertain the long-term supply and demand fundamentals of the metal.
Sincerely,
Roy Sebag
Ed Note: For a larger view click on the image click HERE

The full report (can also be found by PDF here):
Changes to Methodology
This year we implemented some important changes to our methodology leading to a higher quality database that is more comprehensive:
A) Introduction of Grade and Tonnage in grams per tonne providing a more qualitative analysis of each respective deposit.
B) The inclusion of Government owned deposits such as Murantao and Sukhoi Log.
C) The inclusion of South African mines and deposits.
D) The inclusion of Australian listed companies as well as Polyus, Anglogold Ashanti and Newcrest, companies that are harder to compile due to the opacity of their mineral resource disclosure.
While we still have serious reservations relating to what portion of delineated resources can actually be extracted in the South African deposits we felt that they warranted inclusion in order to provide readers with an all-encompassing database. That same logic led us to include government owned mines even though we are somewhat skeptical of their reported grades and often relied on an outdated technical report.
Methodology
We started with a list of 1,892 publicly traded companies that are in some way involved in gold production, exploration, or development of over 7,000 geologic anomalies. Our goal was to find an undeveloped gold deposit or producing mine that hosted over 1 million troy ounces of in-situ resources under a globally respected mineral definition standard such as CIM NI 43-101, JORC, or SAMREC.
In an effort to provide the most comprehensive database and due to the fact that every proven or probable ounce starts of as inferred, we aggregate all resource categories into one figure (refer to last year’s report for a discussion relating to aggregating all resource categories). Where there are reserves and resources we will most likely use the inclusive resource figure. When a cutoff grade is recommended by a geological consultancy we will rely on that cutoff grade unless the report was outdated and we felt a lower cutoff grade was warranted. It is important to stress that resources are not necessarily indicative of future mine supply given that metallurgical recovery rates and economic pit outlines are not applied. In the “Potential Mine Supply Exercise” section we discuss this further.
When it came to copper/gold porphyries it was difficult to draw the line as to what was a gold deposit vs. a copper deposit. In this year’s report we included deposits such as Reko Diq and Galore Creek because we felt their global contained ounces were too large to disregard even though they are primarily copper deposits.
2012 Result Summary
From an initial list of 1,896 companies we were able to identify 212 entities (Public, Private and Government Sponsored Corporations) that own 439 gold deposits hosting over 1,000,000 ounces in all categories representing a total of 3,015,542,164 ounces of gold. The complete list can be found at the end of this report.
Summary of Findings:
Total Mines & Deposits in over 1 million ounces in-situ: 439
Total In-Situ Ounces: 3,015,542,164 Total Tonnage & Grade of Database: 113.9 Billion Tonnes @ .82 g/t
Total In-Situ Ounces & Avg. Grade Producing Mines: 1,556,265,676 oz. @ 1.06 g/t
Total In-Situ Ounces & Avg. Grade Undeveloped Deposits: 1,459,276,488 oz. @ .66 g/t
Global In-SITU Ranking
Mines & Deposits over 3 million Oz: 228 Mines & Deposits over 5 million Oz: 148
Mines & Deposits over 10 million Oz: 74 Mines & Deposits over 20 million Oz: 33
Producing Mines over 3 Million Oz: 120 Undeveloped Deposits over 3 Million Oz: 108
Producing Mines over 5 million Oz: 82 Undeveloped Deposits over 5 million Oz: 66
Producing Mines over 10 million Oz: 43 Undeveloped Deposits over 10 million Oz: 31
HIGH GRADE GOLD SUMMARY
Mines & Deposits over 1mm oz and 3 g/t: 136 Mines & Deposits over 1mm oz and 5 g/t: 81
Mines & Deposits over 1mm oz and 10 g/t: 26 Mines & Deposits over 1mm oz and 15 g/t: 11
Producing Mines over 1mm oz and 3 g/t: 76 Undeveloped Deposits over 1mm oz and 3 g/t: 60
Producing Mines over 1mm oz and 5 g/t: 49 Undeveloped Deposits over 1mm oz and 5 g/t: 32
Producing Mines over 1mm oz and 10 g/t: 14 Undeveloped Deposits over 1mm oz and 10 g/t: 12
For full results and tables of deposits, view the full report PDF.
2012 Results Discussion
This year’s results confirmed both the scarcity of gold deposits as well as the lower-grade production trends facing the industry. Even with our generous thresholds allowing inferred resources to be included in the database, we were able to identify only 439 mines or deposits containing over 1 million ounces of gold.
In our view a mine or deposit is an asset no different than a farm, commercial property, or financial security. Yet when it comes to gold, there are only 439 assets that meet the industry perceived economic threshold of 1 million ounces. Last year, we compared this figure to the tens of thousands of commercial real estate properties in the world or the nearly 72,000 financial securities. While the crustal abundance of gold is fixed, and discovery grades continue to decline, there is no limit to the creation of financial securities and plenty of land and building materials to construct more property. Simply put, a gold mine or deposit with over 1 million ounces is a very rare asset. This is especially true when viewing the geographical distribution of the mines & deposits:
Independently Owned Undeveloped Deposits
Another data point we found fascinating was that out of 439 mines or deposits, 189 are in fact producing mines owned by companies with an average market capitalization of $1.8 Billion. This leaves us with a universe of undeveloped deposits over 1 million ounces of just 250. Of course some of these 250 deposits are owned by miners (84) while just 166 are owned by independent junior companies, private companies, or government sponsored enterprises. Investors seeking leverage to gold should focus on these companies as they provide the best exposure to a rising gold price environment. We have attached a table with these deposits and companies at the end of the report titled “Undeveloped Deposits over 1mm oz owned by Independent Juniors”.
It is interesting to note that in Canada we were able to find only 59 undeveloped deposits over 1mm ounces owned by 49 companies (41 Independents). In the United States we found only 33 deposits owned by 26 companies (23 Independents).
Internally, the purpose of this report was to identify potential short-comings in the theories employed by leading thinkers in the gold industry. After reviewing nearly 2,000 companies in the space we can objectively say that are no such red flags. Annual discoveries in 2011 lacked the gravitas required to move the needle on the aggregate in-situ figures after incorporating depletion. This was surprising to as historically high gold prices have provided nearly unprecedented capital to gold exploration companies and we had assumed that after tallying up the year’s discoveries there would be a significant nominal gain in ounces. Another important data point was observed with regards to the grade of producing mines vs. undeveloped deposits with grades for undeveloped deposits being markedly lower (37%) guaranteeing the need for higher energy input in the future only to sustain current production figures.
Another caveat with the undeveloped deposits in the database is that some of the largest ones face significant permitting headwinds. Pebble, Reko Diq, Donlin, KSM, and Rosia Montana which represent nearly 20% of the undeveloped ounces in the database may not become mines for 10,20 and even 30 years.
Quality Deposits are Rare
While this report and the accompanying database provide an accurate view of global mine supply, there are crucial qualitative metrics still missing. Even high grade deposits with no infrastructure are inferior to easily mined bulk tonnage deposits with close proximity to infrastructure in stable geopolitical jurisdictions.
Looking at the matrix of undeveloped deposits, one can see why size and even grade are not the most important attributes when predicting which deposit will become a mine. Let us compare Cerro Cassale in Chile with 32.5mm ounces to Titiribi in Colombia with 11.1mm ounces (and continues to grow). While Cerro Cassale is nearly three times the size, its remote location in the Maricunga desert has forced Barrick to budget over $500mm for a120km water pipeline. Titiribi, owned by independent junior Sunward Resources, is located on a paved road with both water and power running directly to the site. While it is too early to estimate CAPEX for Titiribi, it is not farfetched to assume that for the amount Barrick will be spending transporting water from point A to point B, Titiribi will be producing a few hundred thousand ounces of gold per annum.
In conclusion, we would like to stress that while this database serves as an effective starting point we urge investors to incorporate additional metrics such as geopolitical risk, permitting challenges, and most importantly infrastructure when ranking deposits for investment.
Global Mine Supply Exercise
In this section we will attempt to make sense of the 3,015,542,164 ounce (93,796 tonnes) figure which is the sum of all in-situ ounces in the database. As we previously explained this figure is inaccurate as it relates to potentially mined ounces in the future due to the following factors:
1) Inclusion of inferred resources in global contained ounces.
2) Not applying any economic pit outlines.
3) Not applying any metallurgical recovery rates.
4) The inclusion of undeveloped deposits with no clear path towards permitting.
In order to project an accurate figure we will adjust the 3,015,542,164 ounce number through an exercise that incorporates metallurgical recovery rates, economic pit outlines, and physical constraints that come with moving the billions of tonnes that host these ounces.
First, we will apply a metallurgical recovery rate. Industry averages tend to be 70-90% depending on the type of mineralization. Casting a wide net, we will use 80% as our metallurgical recovery rate. Following this step we are left with 2,412,433,133 ounces.
Next, we will apply economic pit outlines to the resource figure. Once again in an effort to include the most possible ounces we will apply only a 10% reduction for potential pit outlines. Given the amount of inferred ounces in our database this is a very generous figure. Following this step we are left with 2,171,190,358 ounces or 67,533 tonnes.
Next, we will estimate the physical constraints required to mine the remaining ounces. As these ounces exist within 81 billion tonnes of ore (49 billion tonnes for undeveloped deposits containing 1.05 billion ounces after applying economic pit outlines and metallurgical recoveries) they cannot be immediately extracted from the earth’s crust.
As we are estimating future potential supply, the 189 producing mines are less important given their production is already factored in the existing supply mix. A more relevant exercise is one projecting future supply from undeveloped deposits as only they could meaningfully disrupt the supply & demand fundamentals.
Let us assume for a moment that all 250 undeveloped deposits were somehow permitted and financed tomorrow. With 49 billion tonnes to mine at an average grade of .66 g/t it would take no less than 25 years to extract the 1,050,000,000 ounces contained within these deposits. Arriving at this figure, we assume that the average build time would be 3 years and the average mill size would be 25,000 tonnes per day.
Even with our unrealistic scenario introducing all 250 undeveloped deposits into the supply mix at once, we can only quantify an increase of roughly 42mm ounces of gold production or 1,306 tonnes per annum. Compare that to current gold production of roughly 2,800 tonnes or 90mm ounces per annum.
Realistically, 50% or more of the deposits in the database will most likely remain deposits 25 years from now for a variety of factors including: permitting, ability to finance a mine, and attractiveness to a producer (producer balance sheets are so large they require significant projects to be accretive , making even most 1mm-2mm ounce deposits unattractive).
Consequently, the guaranteed depletion in the existing production mix coupled with a more realistic introduction of new mines into the mix (as opposed to our theoretical tomorrow scenario) makes it clear that barring multiple high-grade, multi-million ounce discoveries each year, a significant increase in gold production is unlikely. Moreover our back of the envelope calculations point towards gold production peaking at some point between 2022 and 2025 assuming the 90mm ounce per year figure is maintained.
Up Down UP Down UP…..Then Its STAGE 4 – WHEN GOLD EXPLODES UPWARDS
STAGE 3: The price of gold is subject to increasing highs and lows and large investment funds move in and out of gold as global uncertainties wax and wane, a sign that gold is increasingly a haven in uncertain times.
pp. 151-152, Time of the Vulture: How to Survive the Crisis and Prosper in the Process, DRS, 3rd ed., 2012
In How to Survive the Crisis and Prosper in the Process (3rd ed., 2012) I describe the five stages of gold. When I began writing the book in 2006, gold was in Stage 2. In 2007, gold entered Stage 3 where speculators and investment funds become a factor to the increasingly volatile price of gold.
On October 19th, Commerzbank attributed the day’s 1.3% fall in the price of gold to speculative financial investors: “The Dollar Gold Price fell to $1732 per ounce Friday… We hold selling by speculative financial investors responsible for the price slide… In recent weeks they had strongly built up their positions and may now be seeing themselves forced to take profits given the faltering upswing.” Read here.

….read more about stage 3 then the Explosive Stage 4 HERE

Earlier this year we reported on the impressive returns that were being produced from a stock screen that allows you to see which companies are attracting favorable upgrades from brokers. The Earnings Upgrade Momentum screen has continued to outperform the FTSE so far this year and one of the interesting current patterns is that half of the 10 qualifying companies are gold mining stocks. So called “earnings upgrades” – when analysts revise their expectations about a company’s performance – can be a significant indicator for individual investors. Indeed, while relying too heavily on the opinions of analysts can be a risky business, these upgrades have been shown to be a fairly influential guide to the future.
How the screen works
As a reminder, this screen works by seeking out stocks that are covered by more than three analysts. Thereafter, each company’s earnings per share estimates for the following year should have been increased by more than 5% during the previous month. In addition, there must have been at least one upgrade during the previous month, and the number of upgrades must be higher than the number of downgrades.
At the height of the financial reporting season in March this year (when the market hit a 2012 high of 5,966 points), the screen was the best performing Stockopedia strategy. Among the companies qualifying at the time were paper and packaging group Mondi (LON:MNDI) and media companyItv (LON:ITV). Both were hit by the market-wide volatility that struck in early summer but have subsequently recovered and are now trading close to their one-year highs. By contrast, Max Petroleum, a small-cap oil and gas stock on the screen back then, went on to see its price collapse under the weight of poor news from its operations in Kazakhstan. That illustrates the importance of doing further analysis and/or using diversification when screening, rather than just pickling one name blindly from a list.

In the year-to-date, the Earnings Upgrade Momentum screen has produced a return of 15.9%. The list of stocks qualifiying changes every day although we rebalance our model portfolio each quarter. Interestingly, out of the 10 now qualifying companies, six of them are mining stocks – and five of those have a strong emphasis on gold production.
Why gold now?
Between October 2008 and August 2011, the price of gold surged from around $715 per ounce to a high of $1,890. Many analysts thought the price would go on to break $2,000 but during the second half of last year gold became volatile and went on to fall to $1,550. However, since mid-August the price has been on the march again and gold currently trades at just short of $1,750. Analysts have credited much of that performance to anticipation surrounding the US Fed’s decision to launch a third round of quantitative easing. The price “pop” from the Fed’s move has been more muted than on previous QE rounds, but some institutions think the price will go on to trade much higher. BlackRock’s Evy Hambro has been reported as predicting $2,400 per ounce by next summer, while Deutsche Bank’s forecast for next year is $2,113.
…..read page 2 HERE
The $1800 per ounce level continues to be a major technical resistance area for gold. After hovering near $1800 recently, gold moved sharply away from that level last week to close at $1735 an ounce.
Despite that, more fund managers and analysts continue to point to a bright long-term future for gold prices. John Hathaway of the Tocqueville Gold Fund says gold will reach new highs within a year. He based his forecast, like many others, on the fact that negative real interest rates look likely to persist as Ben Bernanke and the Federal Reserve continue to print money.
Believe it or not, some mainstream analysts are also touting gold’s potential. Merrill Lynch analysts point to the correlation (discussed in a previous article) between the price of gold and the expansion of the Federal Reserve’s balance sheet since the start of QE1 in early 2009.
Based on the current path of the Fed’s balance sheet expansion, Merrill Lynch came up with two longer-term targets for the price of gold. They project gold to hit $2,000 an ounce next summer and to hit $2,400 an ounce by the end of 2014.
Another way to look at gold and the Fed is the so-called gold coverage ratio. That is the amount of gold on deposit at the Federal Reserve versus the total money supply. According to Guggenheim Partners, the gold coverage ratio is at an all-time low of 17%. The historical average is about 40%, meaning that gold would to more than double to reach the average.
Looking at the Fed’s balance sheet is a new and interesting way to look at and forecast gold prices. In the past, the conventional wisdom was that gold was merely an anti-dollar play: U.S. dollar down, gold up and vice versa. But that seems to be changing…..
Reuters had some interesting data. The value of the U.S. dollar net short position fell to $6.43 billion for the week ended October 9. This is substantially down from the previous week’s net short position of $16.3 billion. At the same time, the “managed money” net long gold position in gold futures rose to its highest level since August 2011. That was the time when gold hit its record high of $1,920 an ounce.
So much for conventional wisdom. Both currency and gold traders are seeing this long-term relationship between gold and the U.S. dollar breaking down into a “new normal” of direct central bank intervention into financial markets. Gold seems increasingly to be turning into more of a safe haven play than an anti-dollar one. It seems that more investors are worried about all fiat currencies that are burdened by huge debt loads.
The Technical Take…
Below is a daily chart of gold futures. Looking at the price levels and analysis you can see that a bounce or bottom could form at any time now. Price of gold has pulled back in a mini five wave correction touching both our first Fibonacci retracement level of 38% and the 50 day simple moving average. This is the type of pullback that longer term investors like to add to their long gold position. While gold does have the potential to fall all the way down to $1625, in the long run it should continue to rise for the long term investor.
From a trader point of view, it may be worth a stab to get long gold with a very tight stop, but until we see a real panic selling day in gold where volume is high I don’t think the final bottom is in yet.

You can get my weekly trading analysis and trade ideas here: www.TheGoldAndOilGuy.com
Chris Vermeulen

-
I know Mike is a very solid investor and respect his opinions very much. So if he says pay attention to this or that - I will.
~ Dale G.
-
I've started managing my own investments so view Michael's site as a one-stop shop from which to get information and perspectives.
~ Dave E.
-
Michael offers easy reading, honest, common sense information that anyone can use in a practical manner.
~ der_al.
-
A sane voice in a scrambled investment world.
~ Ed R.
Inside Edge Pro Contributors

Greg Weldon

Josef Schachter

Tyler Bollhorn

Ryan Irvine

Paul Beattie

Martin Straith

Patrick Ceresna

Mark Leibovit

James Thorne

Victor Adair