
Gold & Precious Metals

Time is more important than price. That’s what we – investors – are often made to believe regarding the future price movement. And rightfully so. The price could reach a bottom several dollars ahead of the predicted price target or it could break through it, leaving investors wondering, if there was a breakdown and thus they should expect to see another big downswing shortly. With time, things are clearer. The time for a given move is up and the price reverses. When is gold likely to finally bottom?
Between August and October 2018. That’s the most up-to-date estimate based on the data that we have right now. Here’s why (chart courtesy of http://stockcharts.com).
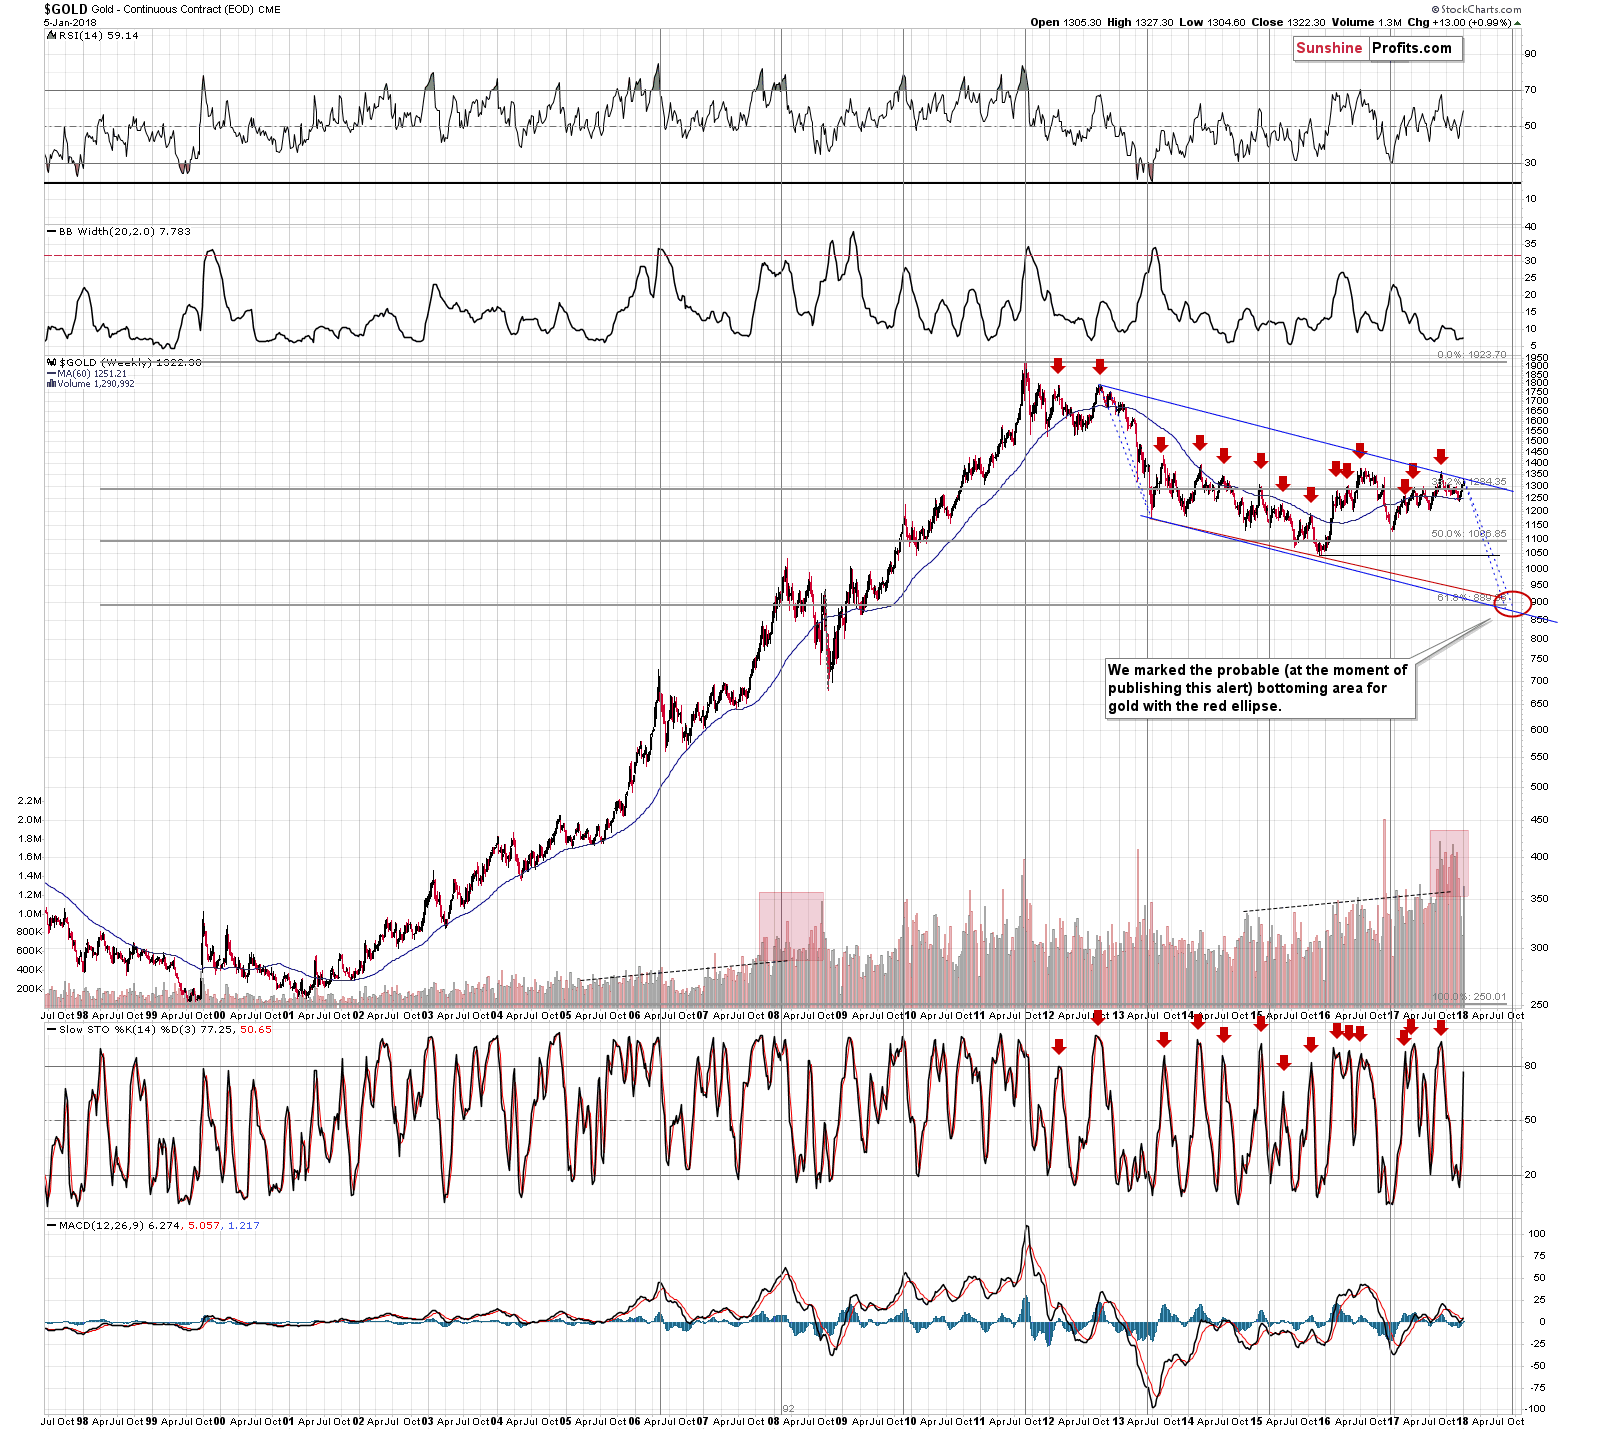
In the previous weeks and months, we wrote on multiple occasions why the current situation is similar to the 2012-2013 top and subsequent decline, so we don’t want to go into details once again today. Instead, we want to focus on the size of the follow-up action in terms of price and time.
When gold topped above $1,350 in early September 2017, it seemed that the decline might have started. This might have indeed been the case, but the pace at which gold has moved lower up to today is different. It was sharper in 2012. Consequently, perhaps looking at the decline from the late-2012 top to the 2013 bottom and applying it to the September 2017 top in order to estimate the time and price of the upcoming bottom is not the best approach.
It might be better to start the analogy with the second top of the decline – the November 2012 top. At the same time, we should take into account the scenario in which gold follows the entire 2012-2013 decline, but the current starting point should be the current top, not the September 2017 one.
Both mentioned analogies are visible on the above chart in the form of the blue dashed lines. They point to a bottom in August or in late September (perhaps early October).
The latter is more probable because of another important factor that points to this time frame. The long-term cyclical turning point.
Until the 2011 top, all long-term turning points in gold marked major interim high and after that all of them marked interim bottoms. This also includes the 2013 bottom.
The next of the long-term turning points is to be seen in late September 2017, which perfectly fits the mentioned analogies.
Let’s move back to the shape of the declines and their size in terms of price. The price that gold is likely to reach in the second half of this year is a bit below $900 – which is in tune with the 61.8% Fibonacci retracement level and the lower border of the declining trend channel.
Speaking of the trend channel, please note that gold is almost at its the upper border. Consequently, gold likely has very little room to move higher in the short term.
Before moving further, we would like to once again emphasize that the current situation is not only similar to the 2012-2013 performance, but also to the 2008 one. You can see the similarity for instance in the increase in the level of volume. This was the kind of performance that preceded one of the sharpest of gold’s declines in the past few decades. The implications are bearish.
There’s much more to the outlook for gold than just the analysis of the yellow metals’ price. Consequently, in today’s free analysis, we discuss one of the very little-known charts featuring the junior mining stocks to senior mining stocks ratio. The reason that we’re following it is that juniors tend to outperform seniors, further magnifying gold’s gains and consequently, the ratio moves in tune with gold. This gives us the opportunity to check for divergences and to use the ratio to confirm gold’s direction.
The link between the price of gold and the ratio is far from being clear, which is probably why it’s something that’s under the radar of most investors and analysts. However, the link being unclear doesn’t mean that we can’t use it. Applying the RSI indicator allows us to detect the particularly important price movements.
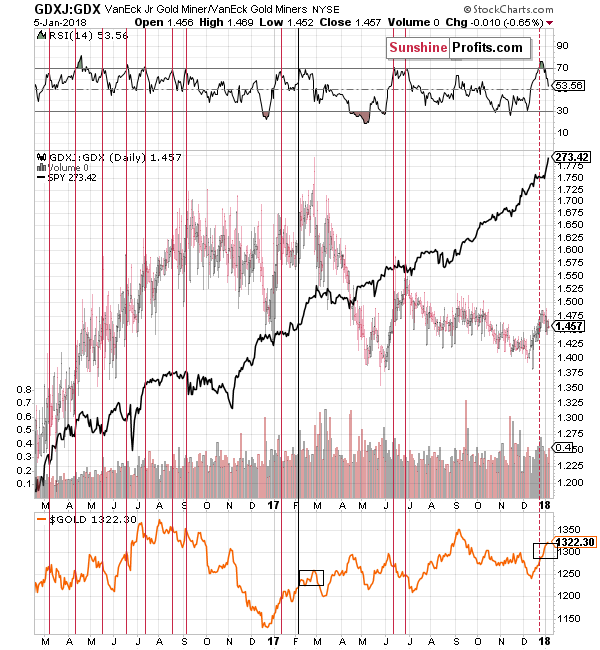
We previously featured the above chart in late 2017 and we wrote that in the majority of cases a move to the 70 level in the RSI was followed by a decline and thus the above chart had bearish implications. Even very likely doesn’t mean imminent and this time, the less likely outcome transpired. Gold moved higher, just like it was the case in one out of the 11 previous cases.
Why are we bringing this back today? In order to check if gold is performing in tune with the single session that turned out to be similar to the current performance.
It is. Back in February 2017, gold moved less than $40 higher after the signal (the RSI moving to 70) and we currently see something alike. The rally is a bit bigger right now, but very much in line with the past case. If the only similar session was followed by a rally that’s similar to the current one, then this rally might be over or about to be over.
There’s another way to look at similarities on the above chart. Instead of focusing on the RSI at 70, let’s check when was the last time the RSI moved to about 80, and what happened then. After all, that’s also what we saw recently. The above chart features only one similar case – April 2016. Interestingly, back then, gold moved higher by about $40+ before topping. If history is to repeat itself, gold has either topped or is about to form a top shortly.
The medium-term outlook for the precious metals market remains bearish as confirmed by multiple factors, and based on the most recent short-term factors, it seems that the corrective upswing in gold, silver and mining stocks is either over or close to being over. Gold’s critical performance in terms of the Japanese yen, situation in the Euro Index, and both key precious metals’ turning points support the above.
Summing up, even though gold’s upswing may seem encouraging to gold investors, it seems that it’s days are numbered based on many factors, including the performance of the juniors to seniors ratio. The true buying opportunity is likely to present itself this year, but most likely not in its first half. The period between August and October seems to be the most likely time frame for the final bottom in the price of the yellow metal, with October being the more probable date. As far as the outlook for the price of gold in January is concerned, the situation appears bearish.
Naturally, the above is up-to-date at the moment of publishing it and the situation may – and is likely to – change in the future. If you’d like to receive follow-ups to the above analysis (including the intraday ones, when things get hot), we invite you to subscribe to our Gold & Silver Trading Alerts.
Thank you.
Sincerely,
Przemyslaw Radomski, CFA
Founder, Editor-in-chief, Gold & Silver Fund Manager
The rally in Gold and gold mining stocks easily surpassed our expectations and targets. The strength has been far more than we anticipated. The gold stocks blew past their 200-day moving averages while Gold blew past $1300/oz. Now it is time to take a technical look and focus on the key support and resistance targets.
The strength of the rebound pushed the miners well beyond their 200-day moving averages and to their June and October highs. GDX is consolidating just below $24 while GDXJ is consolidating just below $35. If this consolidation turns into a correction then GDX and GDXJ could find support at their 200-day moving averages which are at $22.71 and $33.37 respectively. As you can see, should GDX and GDXJ be able to exceed recent peaks then they could rally towards important resistance levels. Those are $25.50 for GDX and $38 for GDXJ.

The rally has been just as strong in Gold as it surpassed resistance in the $1300-$1310/oz zone. Gold closed the week at $1322/oz. Should Gold pause or correct here then the sellers could push the market down to previous resistance but now current support at $1300-$1310/oz. Trendline resistance will come into play near $1340/oz while the 2016 and 2017 peaks would provide resistance in the $1350-$1370/oz zone. 
While we are at it, let us take a look at Silver which exploded past resistance in the mid $16s. Silver will face resistance first at $17.75 then at $18.50. A break above $17.75 and the red trendline is the first step for Silver. The second would be reaching $18.50, a new 52-week high. Next week Silver will face immediate resistance around $17.30 (the October and November highs) but it will have strong support in the mid to upper $16s.

The precious metals complex has made important progress in recent weeks. Markets have broken key resistance levels and have showed no signs of slipping anytime soon. Gold is holding above previous resistance at $1300-$1310/oz while not being far from multi-year resistance in the mid to upper $1300s. The gold mining stocks have reclaimed their 200-day moving averages while consolidating tightly beneath the June and October highs. If and when GDX and GDXJ break those levels then they will be only one step away from a full blown bull market. That step is breaking above the September highs.
In recent weeks our tone has shifted and as such we have accumulated a few new positions. We seek the juniors that are trading at reasonable values and have technical and fundamental catalysts to drive increased buying.

The U.S. gold market suffered a net deficit this year compared to a small surplus in 2016. This was quite interesting because U.S. physical gold demand will be down considerably this year. In 2016, total U.S. gold demand was 212 metric tons versus an estimated 150 metric tons this year. The majority of the decline in U.S. gold demand is from the physical bar and coin sector that is down 56% in the first three quarters of 2017 compared to the same period last year.
So, why will the U.S. gold market suffer a deficit if gold demand is down sharply this year? Well, it seems as if the culprit is the huge increase in net gold exports. Last year, the U.S. imported 374 metric tons (mt) of gold and exported 398 mt for a net 24 mt deficit. However, this year, estimates for U.S. gold imports will fall to 250 mt while exports increase to 475 mt. Thus, the U.S. net export deficit will be 225 mt in 2017:

However, if we look at all the data in the chart above, the U.S. gold market will experience a net 76 mt deficit in 2017 versus a 44 mt surplus last year (bars right-hand side of chart). Again, we can see that U.S. gold imports are estimated to decline significantly this year to 250 mt compared to 374 mt in 2016. Furthermore, total U.S. gold exports are forecasted to increase to 475 mt this year versus 398 mt in 2016.
When we factor in U.S. gold mine supply, domestic consumption, and gold scrap supply, the market will go from a small 44 mt surplus in 2016 to a 76 net deficit this year.
So, the question remains… what happens when the markets crack, and retail investors flock into Gold ETF’s as well as surging gold bar and coin demand?
This happened in the first quarter of 2016 when the Dow Jones Index only fell 2,000 points in a few months. Gold ETF inflows surged to the second highest quarterly amount ever at 350 mt. The all-time record of quarterly Gold ETF inflows took place during the first quarter of 2009 when the Dow Jones was crashing towards 6,600. During the Q1 2009, Gold ETF flows were a staggering 465 mt.
While precious metals sentiment is currently depressed due to the surging Stock and Cryptocurrencies, at some point, we are going to see a crash in these two markets. The amount of leverage in both markets is off the charts.
I believe the next market crash will cause more investor FEAR than ever. We could see Gold ETF inflows surge above 500 mt while physical bar and coin demand beat all records.
Interesting Chart On U.S. Mine Worker Gold & Silver Productivity
When I was looking at the U.S. Gold Market data, I came across some interesting statistics on worker mine productivity. According to the USGS data, the U.S. gold industry employed 12,000 mine workers in 2016 to produce 7.1 million oz (Moz) of gold. In the U.S. silver mining industry, 785 workers produced 23.2 Moz of primary silver. While total U.S. silver production was 37 Moz in 2016, 13.8 Moz was a by-product of base metal and gold mining.
In the USGS 2014 Silver Yearbook, they break down the top silver mines in the United States. There were only three primary silver mines in the country. These included the Couer’s Rochester mine in Nevada, Hecla’s Lucky Friday Mine in Idaho and American Silver Corp’s Galena mine, also in Idaho. The combined silver production from these three primary mines was 23.2 Moz.
If we take the number of mine workers and divide by U.S. gold and silver production, we have the following:

Each mine worker in the gold industry produced 595 oz in 2016 versus 29,550 oz of silver. Thus, each mine working in the primary silver industry in the U.S. provides 50 times more silver than their counterpart in the gold industry. By taking this a step further, each U.S. mine worker produced 1.6 oz of gold a day compared to 81 oz of silver.
Not only does it take a lot more human labor to produced gold than silver, it also takes a lot more fuel. According to data, I put together for 2014, Barrick consumed nearly 21 gallons of diesel to produce one ounce of gold while Pan American Silver only consumed 0.2 gallons of diesel to produce an ounce of silver. Thus, it takes 100 times more diesel to produce gold than silver:

Investors need to understand that the price of gold and silver are based on their cost of production, not the ratio extracted out of the earth. For example, the world produced 886 Moz of silver in 2016 compared to 104 Moz of gold. That is a silver-gold mine ratio of 8.5 to 1. Some readers suggest that the price of silver should rise to the same extraction ratio to gold. Thus, that would be approximately $154 silver.
However, the reason gold and silver were valued closely to the ratio they were extracted out of the earth in the past was due to the mining method. In the past mining was done mostly with human and animal labor. Thus, the 10-15/1 historic gold-silver price ratio was valued based on the extraction ratio. Today, the energy we use is mostly from coal, natural gas, and oil. These carbon-based fuels have distorted the cost of production.
According to my last estimate, the primary gold mining industry’s breakeven was between $1,100-$1,150, and the primary silver mining industry was $15-$17. Thus, the cost of production ratio is 70/1. The gold-silver cost ratio is very close to the current gold-silver price ratio of 76/1.
Lastly, the cost to produce gold and silver will no longer function as their MARKET VALUE in the future. The value of most commodities are based on their cost of production, but gold and silver also act as high-quality STORES OF VALUE. When investors finally realize that their wealth investing in STOCKS, BONDS, and REAL ESTATE will continue to vaporize when the stock markets eventually crash, then we will finally see silly crypto price moves in the precious metals.
Check back for new articles and updates at the SRSrocco Report.

-
I know Mike is a very solid investor and respect his opinions very much. So if he says pay attention to this or that - I will.
~ Dale G.
-
I've started managing my own investments so view Michael's site as a one-stop shop from which to get information and perspectives.
~ Dave E.
-
Michael offers easy reading, honest, common sense information that anyone can use in a practical manner.
~ der_al.
-
A sane voice in a scrambled investment world.
~ Ed R.
Inside Edge Pro Contributors

Greg Weldon

Josef Schachter

Tyler Bollhorn

Ryan Irvine

Paul Beattie

Martin Straith

Patrick Ceresna

Mark Leibovit

James Thorne

Victor Adair