Gold & Precious Metals

Silver Price Forecast: The Great Silver Chart

A reader asked me to update a previous long-term silver chart of mine. Below, is the updated long- term chart for silver:

9-10-12-hgm-silver-long-term-chart1

silver chart analysis

Since the last chart, silver has broken out of the pennant formation (on the short-term chart), and is looking really good.

On the chart, I have highlighted two fractals (or patterns), marked 1 to 3, which appear similar. What makes these two fractals so special, is the similarity of the circumstances in which they exist.

There was a significant peak in the Dow (1973 and 2007) between point 1 and 2 of both fractals. Also, point 1 on both fractals represents a significant bottom for silver after the peak of the Dow/Gold ratio. After point 2, on both fractals, the oil price made a significant peak (1974 and 2008), about eight years after the peak in the Dow/Gold ratio.

Thanks to this similarity in events, as well as the similarity in sequence, I was able to identify the great possibility for significantly higher silver prices, back in October of 2010. This was a very clear signal that higher silver prices were coming, and that is exactly what we got, when silver moved to $49. However, this run is not over yet. The move from $17, when silver broke out of thetriangle (at point 3 of the second fractal) to $49 was just the first part of the move. In my opinion the biggest and best part of this move is still ahead. In my long-term fractal analysis report on silver, I have presented a lot of technical and fundamental evidence to support my opinion for higher silver prices over the coming years.

….read page 2 

Silver at Multi-Month High & What To Do

The price of silver reached a 5-month high this past week as investor interest seems to have been rekindled in both gold and silver as belief in financial markets increases that the latest round of monetary easing from the Federal Reserve – QE3 – will soon be on its way. Many investors had largely stayed away from silver in recent months after some had got caught up in its volatility. Silver had touched a 30-year high in April 2011 before plunging 35 percent in a few short weeks.

Now the volatility is back – but on the upside – as prices have climbed more than 20 percent in less than a month. The gains have outpaced that of gold which rose roughly 10 percent during the same time frame. Importantly for investors, the ratio between the two precious metals has moved about 10 percent in silver’s favor since mid-August. This is the first time silver has outperformed gold since the start of 2012.

For non-futures investors, the two precious metals can easily be tracked through the use of exchange traded funds (ETFs). The most liquid ETFs for the two precious metals are the iShares Silver Trust(NYSE Arca: SLV) and the SPDR Gold Shares (NYSE Arca: GLD) respectively.

Silver2

Gold1

You can take a look at my long term outlook analysis from last week here:http://www.thetechnicaltraders.com/gold-standard-to-be-reinstated-through-the-back-door/

Some may wonder why has silver outperformed gold in the past several weeks? The answer goes deeper than just confidence that QE3 is coming soon, but it is still rather a simple one. The sharp rally in silver was fueled largely by short-covering. That is, some investors (hedge funds, etc.) had made rather large bets that silver would continue falling and were caught off-guard by its recent rise. According to data from the Commodities Futures Trading Commission, the silver market during the week of August 27-31 saw the largest amount of short-covering since May 2011. At the same time. Bloomberg reported that hedge funds were the least bullish on silver in almost four years.

It is unknown for how long silver will outperform gold. But even some long-term fundamental investors such as legendary commodities investor Jim Rogers has said that he believes silver right now is a better investment than gold. He points to the fact that historically gold has been worth about 12 to 15 times what silver is worth, but that recently it has been worth roughly 50 times silver’s value. Silver is also the only major commodity not to have reached a new all-time high in the decade-long commodity bull market and is still cheaper than it was 32 years ago.

So it may be worth a look. But since silver is so volatile, wait for a downward spike before initiating or adding to a long position.

If you would like to get my weekly analysis on precious metals
and the board market join my free newsletter atwww.TheGoldAndOilGuy.com


Chris Vermeulen

Ed Note: Silver on a 30 Minute Chart @ 8.20 am PST

Picture 1

The ECB Move, $5,000 Gold & $150 Silver

Investors are shifting from gold ETF’s to physical gold, and that the “move in gold and silver has barely started.” says Egon von Greyerz the founder of Matterhorn Asset Management

In an interview with King World News  von Greyerz says the shift has commenced because investors are concerned about the prospect of a systemic collapse.

Greyerz made these remarks following the ECB’s approval of unlimited bond buying, observing that the European Central bank will do everything in its power to preserve both the euro and eurozone.

According to Greyerz money printing is “absolutely guaranteed” and the prospects for the EU’s Mediterranean members are dire with Greece bankrupt and Spain a “basket case.”

In the event of systemic financial collapse, Greyerz says the only surefire means of preserve wealth is to keep physical gold outside of the banking system.

Gold in a safe deposit box in a bank is also not safe because if something happens to the financial system banks will close, and who knows when they will reopen? You will not have access to your gold. So I would not keep gold in a safe deposit box. The bottom line here is that gold and silver stored outside of the banking system is the ultimate way to preserve wealth

Greyerz also sees both gold and silver hitting stratospheric heights in the face of imminent catastrophe, with gold reaching $4000 – $5000 and silver $150.

….read more HERE

silver-bars-gold-coins

Hang on To Your Hat! “Gold Standard To Be Reinstated Through The Back Door”

For the first time in over 30 years, talk of a return to the gold standard has become part of mainstream politics in the United States.

(Ed Note: In Prepare! “The Only Way the World-Debt Problem is Going To Be Solved Richard Russell say’s “The US owns the world’s greatest hoard of gold. It will, in the end, be solved by devaluation (as Roosevelt did in 1933, when he suddenly and unilaterally raised the price of gold from 20 to 35 dollars an ounce. They should unilaterally, overnight raise the price of gold to a high value, maybe around $10,000 an ounce. Thus, each dollar would be worth one ten-thousandth of an ounce of gold. This would allow our enormous debt to be paid off with vastly devalued dollars.”

Part of the official Republican policy adopted it at the recent Republican Convention and called for the commission to look at reestablishing the link between gold and the U.S. dollar. No doubt that plank was added to soothe supporters of Texas Congressman Ron Paul.

However, gold bugs holding gold bullion or even those holding gold ETFs such as the SPDR Gold Shares (NYSE: GLD) shouldn’t hold their breath in anticipation of the gold standard returning. There was a similar commission – the Gold Commission – set up in 1981 by President Ronald Reagan. After a lot of ‘commissioning’, the decision was made to go with the status quo of using fiat Federal Reserve dollars.

Any commission set up under the current president would likely come to the same conclusion. There are simply too many practical obstacles to return to a full-fledged gold standard. Even pro-gold advocates including the World Gold Council and the Gold Anti-Trust Action Committee (GATA) don’t see a gold standard returning.

The key problem would be at what price of gold would the United States peg its currency. Great Britain returned to the gold standard in 1925, after going off it in 1914, at the 1914 peg price. This was a mistake made by Winston Churchill (he called it the biggest he ever made) since it basically ignored the vast inflation in the British pound in those intervening years. The result was a vast overvaluation of the pound and deflation and high unemployment soon followed.

What price would a new Gold Commission set as the “correct” price of the U.S. dollar versus gold? $1,000? $2,000? $5,000? The answer is that there is no “correct” price. Whatever price is set will eventually be tested by the financial markets and fail much as the pegged currencies system failed. So there will be no return to the gold standard.

But that does not mean there will not be a ‘back-door’ gold standard. The move to such as a system is already underway as central banks all over the world are rebuilding their stockpiles of gold. After two decades of heavy selling, central banks became net buyers of gold in 2010 and the momentum has built since. Gold will likely end up being used as ‘good’ collateral by global central banks, as opposed to the shaky collateral sovereign bonds are turning into.

Central bank purchases, led by the emerging markets, are on track this year to hit a record high according to the World Gold Council. China alone in 2011 bought around 490 tons of gold. Other countries including Russia, Turkey and South Korea have added gold to their official holdings in recent months. This buying showed up as central bank purchases in the second quarter of 2012 were more than double the level reported a year earlier at 157.5 metric tons. If the buying continues at current levels, central banks gold purchases would total around 500 tons this year, easily surpassing last year’s 458 tons.

The bottom line for investors from the global central banks’ buying of gold? The gold standard is working its way back into the international monetary system through the back door. This should, in the long-term, put a floor under gold and help maintain it on its steady upward path.

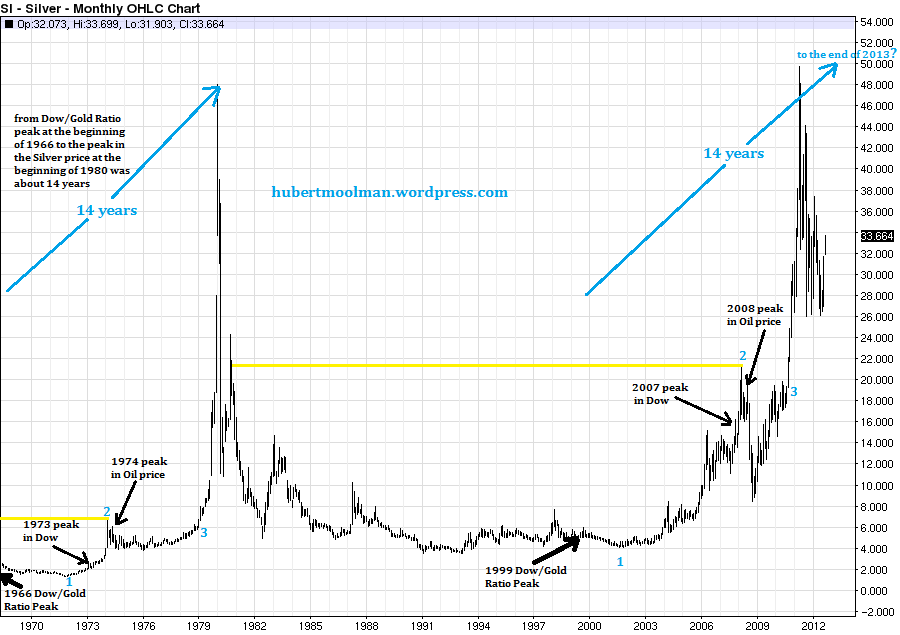
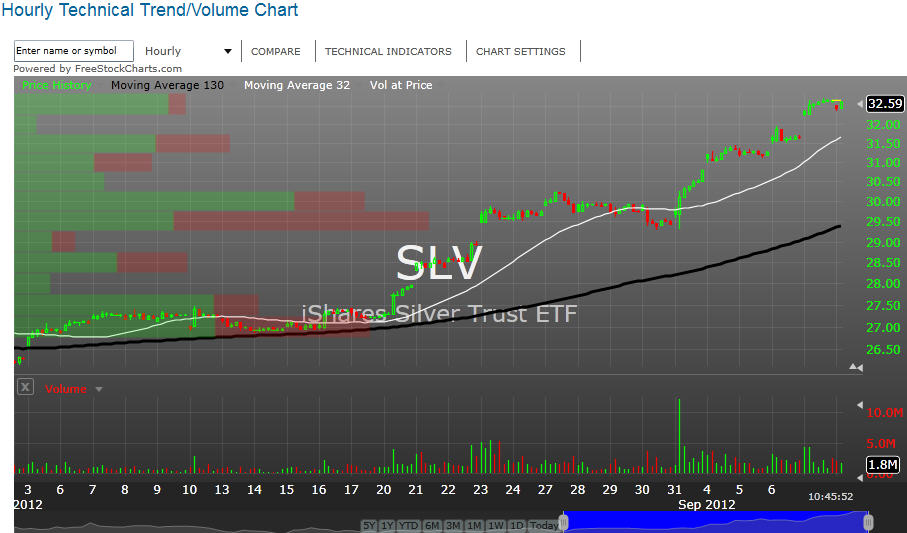
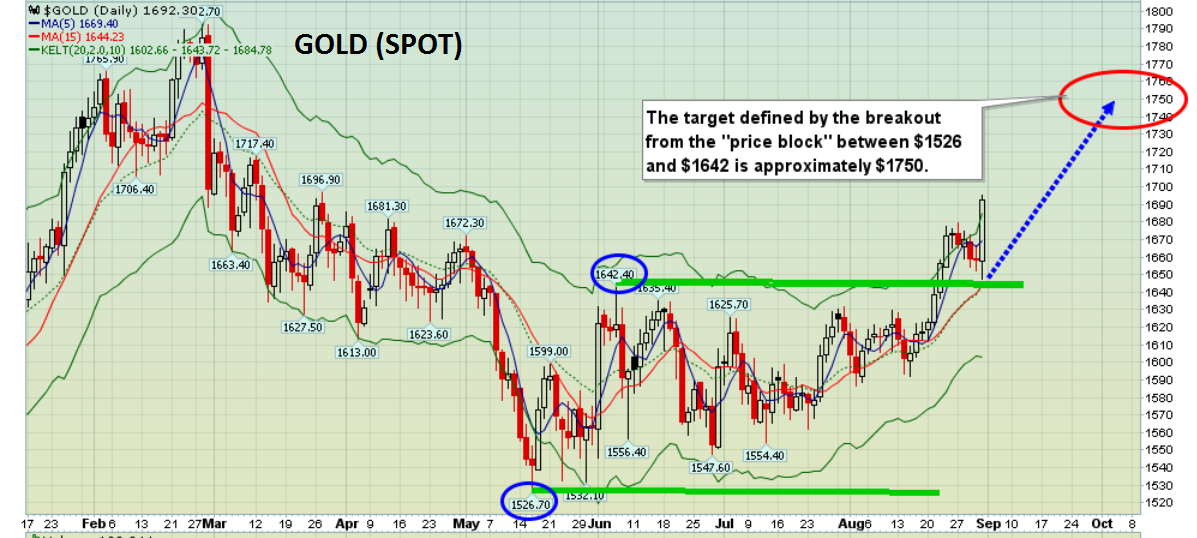
Just last week we started to see gold bullion, silver bullion and gold miner share prices start to breakout to the upside of a 12 month consolidation pattern. This could be the start of the next major rally in precious metals as future uncertainty fears continue to rise. The large bullish technical pattern we see on the gold chart points to much higher prices over the coming 24 months. But keep in mind this is a monthly chart and it could still take months to truly breakout to new highs and start another rally.

GoldBullionTrading

If you would like to get my weekly analysis on precious metals and the board market join my free newsletter at www.TheGoldAndOilGuy.com

Chris Vermeulen

GOLD: Analysis of The Recent Rally

Gold Makes Resistance Key Support


1. Some critical technical events have occurred in the gold markets over the past week. Click HERE or on chart below for larger image. 

2012sep4gold1

2. Friday’s price action likely established the $1625-$1645 area as powerful support for the bulls (you).  The decline halted at almost exactly $1642.40, and then rocketed towards $1700.

3. Friday’s price action took the gold price about 3% above the upper green HSR line (horizontal support & resistance). Click HERE or on chart below for larger image.

2012sep4gold2

4. This is the first time in almost a year that gold has won a decisive victory against the bears on the “chart battlefield”.  Key resistance has become key support.

….read points 5-24 HERE


More on the rally by Martin Armstrong

GoLD THE RECENT RALLY


The computer called for a high at this time a year ago. There is nothing new. The same old news of QE3 will be inflationary is just nonsense. We have massive deflation still going on. The key to what is interest rates. Do a simple correlation and you will see that inflation requires rising interest rates – not declining. However, government is making the perfect mistake to set that stage for the explosive rally in gold. The Fed last year bought 61% of the new debt. That may appear to be inflationary from one side of the coin, but capital is contracting due to the witch hunt for money globally, the continued decline in bank assets, though starting to ease with real estate, and the massive increase in taxation. Even the banks are all moving their back offices now to Poland and India. That even includes banks in Singapore. (more below chart)

gcnynf-w

Once capital realizes that these trends are forcing it to invest, then you will see assets rise, debt will fall because interest rates are so low, people are not buying other than very short-term. Americans are being chased out of all banks worldwide, The government figures that capital will be forced home and then they can imprison people and confiscate that wealth. Sorry! The solution is to buy assets outside of the banking system – real estate, stocks, & gold (not in France). As capital shifts from banks and public assets into private, then we will see the inflation come home. That appears to hit in 2014 and we will see an explosive move to the upside thereafter. Hence, QE3 is only a confirmation that the trend is still contracting. It will be no more inflationary than QE1 or QE2. The danger these morons are creating is that with interest rates so low, they are likely to find NO BID for the bonds when they do need the cash. They watch what happens! These morons will have created an explosive inflationary spiral. That takes place ONLY when capital shifts away from PUBLIC assets and sees the light.

For now, gold may peak this week by the 7th. The key weeks are 9/17 and then 10/1. We will see volatility rise in October. Europe is still messing things up. Politicians are clueless and still think they can bully the private sector into paying their bills. They will have another thing coming very soon.

For now, the main resistance in gold is at the 18000-18100 area. This is purely a technical move. A low early next year should complete the normal 2 year correction process and from there we will be in a position to change course. The same turning point that the 1987 Crash was on that 1989.95 wave will be next August. From there onward, a change in trend appears highly likely. We will be providing the specific targets for the next year with all the reversals and Cycle Maps at the San Diego Conference 9/23-24.This is going to be a very important event.

by Martin Armstrong of Armstrong Economics

Click on this link for more About Martin Armstrong