Gold & Precious Metals

Near-Term Targets for Gold, Silver and Mining Shares

It’s amazing. Suddenly, everyone is bullish again. Two months ago you couldn’t give away mining shares or Silver. No one wanted to buy. After back to back weekly gains (for essentially the first time since January) the gold bugs are back and proud. Bullish calls are coming out of the woodwork. This is good and all but as analysts our job is to stay ahead of the market, rather than react to or follow it, as so many professionals do. That being said, today we give you a quick synopsis of where things stand and the potential risks coming into play.

Below we chart Gold and Silver in weekly form. Gold has a bit of resistance at $1700 but strong resistance at $1800. Silver has initial resistance at $32.50 followed by stronger resistance at $35.00 and $37.50. The numbers reflect public opinion readings (source: sentimentrader.com).

sep3edgoldsilver

While we believe the rebound has more room to run we have to note the sudden large increase in bullish sentiment. As you can see, public opinion in Silver has surged from only 32% to now 70% bulls. Two months ago only 47% were bulls on Gold. Now its 70%. Commercial short positions have increased by a similar degree. In Silver, commercials are now short 38K contracts, which is a large increase over 23K contracts from two weeks earlier. In the same period, the net short position of commercials in Gold increased from 140K contracts to over 200K contracts. Again, Gold and Silver have more room to rebound but be wary of the increase in bullish sentiment and overhead resistance levels.

Meanwhile, on the equity side, GDX last closed at a key pivot point. A break past $48 would take the market to at least $52-$53, where the 50% retracement and 80-week moving average lie. The W bottom pattern is nine points deep so there is a potential measured target of $57, which marks the 2012 highs and strong resistance from the first quarter.

sep3edgdx

To conclude, the trend in the precious metals complex is up and remains healthy though a great deal of speculative money has come aboard in recent weeks. In addition, one should understand that precious metals markets are in recovery mode and not impulsive advance mode. There is a long way to go before the next major breakout. These markets will have to grind through the supply created from the previous downturn. Moreover, October is typically a bad month for precious metals. However, we are in September and according to the charts, this rebound has more room to run. If you’d be interested in our professional guidance in uncovering the equities poised for big gains, then we invite you to learn more about our service.

Good Luck!

Jordan Roy-Byrne, CMT
Jordan@TheDailyGold.com“>Jordan@TheDailyGold.com

Why Jim Rogers Favors Silver ETFs

Noted commodities investor Jim Rogers has recently pointed to silver as a metal of choice over gold for the current economic climate. [Rogers: Use Commodity ETFs to Profit from Supply Shortages

  • “Governments print money – that’s all they know. So own real assets like silver and rise and you’ll survive,” Rogers said.
  • Rogers owns all the metals but said if he had to buy one today, it would be silver.
  • “Gold is up 11 years in a row. Gold is consolidating now, a well-deserved consolidation. I own gold, I’m not selling gold. If gold goes down, I’ll buy more.”
  • He’s bullish gold will eventually go well over $2,000 an ounce but said corrections of between 30% and 40% are normal.
Rogers notes that silver’s volatility makes it the perfect precious metal for Fall, once the widely expected Fed decision to implement a Quantitative Easing 3 is announced.  “A huge amount of money will come into commodities the next decade as people learn about supply shortages. Very few people are invested in real assets.”

“Exchange traded products are convenient for commodities. I always buy exchange traded products and it’s terrific,” Rogers said at the June Alts Virtual Summit co-produced by ETFtrends.

Ed Note: Here are 3 Silver ETF’s

  • iShares Silver Trust (SLV)
  • Silver Miners ETF (SIL)
  • PowerShares DB Silver ETF (DBS)

“Something is finally happening with silver. The chart below shows silver up five days running, and on rising volume. Let’s keep an eye on “the poor man’s gold.” The silver-to-gold ratio was out of whack — silver was too cheap compared with gold. One ounce of gold will buy 32.7 ounces of silver. The ratio should be nearer 20 or even less. According to RSI silver is now overbought.”Richard Russell Dow Theory Letters Aug 30/2012
 

“Consider this: Silver is the only major commodity not to have reached a new all-time high in this bull market; silver is still cheaper than it was 32 years ago, prices are astonishingly depressed,” Peter Cooper wrote for Resource Investor.  [Silver ETFs Not Shining in 2012]. “Investment demand for precious metals will take over in any case from industrial demand. And once the gold price heads up then silver will follow. You get 50 times more silver for your money than gold,” Cooper also wrote HERE

Gold investing has long dominated the precious metals space, as investors have used this ultra-popular metal as both a trading/speculative instrument as well as an integral part of a longer term strategy. While silver still has a large presence in the financial world, it is not often that a big name steps into the limelight and touts this white metal over its gold counterpart,” wrote Jared Cummings for Commodity HQ.

The silver market has seen increased interest as the U.S. dollar has weakened. Commodity funds have been seen gains and the silver market has attracted much investor interest.

Picture-32.png


Here is a half-hour audio discussion of Austrian economics and the current state of the world economy with the Mises Institute’s Bob Murphy, who also runs the website http://consultingbyrpm.com/blog. Murphy gives a broad outline of how Austrian economic analysis differs from Keynesian analysis, and how this leads economists from these rival schools to propose radically different policy recommendations.

He pays particular attention to the example of the Great Depression, where conventional (Keynesian) wisdom holds that FDR’s stimulus measures contrasted with “tight wad” Hoover’s fiscal austerity, and that the former were instrumental in ending the Depression. But as Murphy discusses in his book The Politically Incorrect Guide to the Great Depression and the New Deal, this narrative is seriously misleading.

Turning to current events, Murphy discusses how governments are engaged in a never-ending effort to “postpone the day of reckoning” as far as the economy is concerned: in the late 1990s, the bursting of the tech bubble led the Fed to pump up a housing bubble. When the housing market collapsed in 2008, threatening major bank failures, this led governments to step in and guarantee bad bank debts. But given that these bailouts now threaten the solvency of governments themselves, Murphy thinks that governments and central banks have run out of road, and that we risk currency crises if the authorities continue to resort to money printing as a solution.

Murphy is optimistic on precious metals, and thinks “the only long-term direction is up” for gold and silver prices, owing to the continuing money printing he expects from central banks.

This podcast was recorded on Aug. 24 and released by GoldMoney on Wednesday.

About the Author

Alasdair Macleod is head of research for GoldMoney. He also runs FinanceAndEconomics.org, a website dedicated to sound money and demystifying finance and economics. He has a background as a stockbroker, banker and economist. He can be contacted at Alasdair.Macleod@GMYF.org and followed on Twitter @MacleodFinance.

Timing, Time, Gold & The Computer

Many people have been writing about the computer forecast for gold on the monthly level and are astonished how it can write a report on time. TIME is an entirely different dimension and it must be respected as a entirely separate field. No individual is capable of forecasting the future with consistency. Perhaps there was a fight with a spouse or a conflict with the IRS. Such things emotionally distract an individual and as a result, they forget some thing to check or they are just too domestically focused. Others are “married” to a position. Some are married to an idea as with gold and will NEVER say sell – only buy. That is not analysis, it is dogma. To be consistent it takes the UNEMOTIONAL perspective. This is true in government where self-interest prevents politicians from being objective or analysts from just calling it as it is without being biased. The computer model is nearly functioning monitoring the entire world 24/7. This has been a major effort with people around the world. We will in the future have a special event in Switzerland where people will be able to talk to the computer and ask it questions. For now, this is what it wrote and was published for the December Conference last year that has so many astonished for it does not matter about the fundamental news. If it is a declining market, good news is never good enough. If it is a rising market, bad news is ignored. Trends are NOT easily reversed. They must play out their TIME. So all the nonsense about manipulating the world economy or that I am some gold hater because I dare to say it is like all markets, it goes up and down, just fall to the ground as dust in the wind. Markets will do what they do according to TIME. It is vital to understand the concept of turning points. It is never about who is right or wrong. That is for children – mommy he did this! Grow up. This is about surviving the future – not selling bullish ideas.

MONTHLY TIMING 

Looking at our empirical models, the ideal primary target for the next turning point appears to be March 2012 thereafter we see a two-month move in the opposite direction. Initially there appears to be a fairly large change in Trend developing in September of 2012 which can lead to a move into the January 2013. Therefore if March unfolds as a reaction high (Ed Note: See Chart Below revealing that there was March high in blue of 1790.40) we could see a retest of support in May with a  reaction high into August for Labor Day and a decline into a final low in January 2013. It is clear that January 2013 should be a very important target. If that is a low then we should be able to see a significant rally into 2017 thereafte

Picture 2


Sometimes a computer is the clearest way to see the future. It is not biased and just calls the shots as it sees it.


Gold – Posted on 

Gold is moving to the upside going into the end of this month. This is not particularly good long-term just yet. Nevertheless, the first resistance is 1683 with the Weekly Bullish Reversal. 1674.3 is the high of May (1678.60 Futures on the chart below) that is providing some closing resistance just technically. It is always the Monthly Bullish Reversals that are the key to any change in trend even short-term. They still stand at 1770 and 1796. But a new low under that of May would cause those numbers to drop sharply setting this up for a possible change in trend near-term.

The higher volatility we saw for 3 weeks after the week of 8/6 seems to be on target. Unfortunately, a rally for 3 weeks sets the stage for the opposite direction. A low would have been better. But we have to take what the market gives. Turning points are just that, An event.

We are working diligently to get the computer writing the reports ASAP.

Picture 3

Gold: First Mover Advantage

In the Investor Alert, our investment team shares charts and data that we believe provide readers with a first mover advantage. While markets don’t always move like we anticipate, recognizing historical trends can provide an edge if you act quickly.

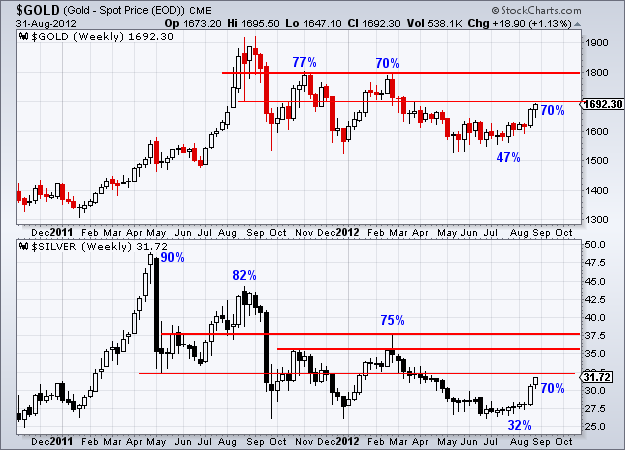
Last week, gold bugs were rewarded with the long-awaited positive momentum in the yellow metal, and on Friday, bullion rose to about $1,670. After falling below the 200-day moving average, gold had been stuck in quicksand for several months. With the jumps in the price last week, bullion swiftly rose above this critically important long-term moving average.

image001

Bloomberg reported on Thursday that gold investors were the “most bullish in nine months” as its survey of 29 of 35 analysts indicated that they expected prices to rise—only three were bearish toward the metal.

One chart that might turn those three bears to gold bulls was featured in a recentInvestor Alert. I noted that gold’s 12-month rolling return in standard deviation terms triggered an extremely low sigma event, dipping below a reading of -2. To our investment team, this signal means that investors should expect gold to experience a significant price reversal.

image002

Price reversals, of course, work both ways—the oscillator above also tells you whether gold has climbed too quickly and should be expected to fall. If you take a look at the previous “peak,” when gold rose above 2 sigma, the chart sent out a chilling warning signal that gold was due for an eventual correction.

Last August, when the price of gold was reaching all-time highs, I reminded investorsthat it would be a non-event to see gold decrease by 10 percent. In fact, I felt that this correction would be a healthy development for markets, because it would act to remove the short-term speculators while the long-term story remained on solid ground.

Gold still hasn’t made it back to its all-time high, but Stifel Nicolaus’ gold-to-crude oil ratio suggests gold climbing to $1,900. According to Stifel’s research, the gold-to-oil ratio based on the price of Brent has historically “shown a tendency to run to around 16.5x.” In other words, the price of the yellow metal is usually about 16.5 times the price of a barrel of Brent oil. With Brent trading around $116 per barrel last week, the math tells us that gold could go to $1,900.

image003

The long-term fundamentals for gold stand on solid ground. Way back in March, Ian McAvity stated that the “extreme behavior of major central bankers and the absurd ‘risk-on/risk-off’ surges of liquidity across all markets fueled by those liquidity injections sloshing around markets rather than reaching any economy is frightening, and the most bullish fuel they could throw at the gold market.” Liquidity keeps flowing today, as central banks have continued their massive global easing cycle throughout the summer. In McAvity’s opinion, “The gold price volatility is more a reflection on the U.S. dollar and euro paper and the madness of an asset bubble. Gold will be the last man standing on the other side of the valley.”

Even the Love Trade—gold buying out of China and India—isn’t over, despite rather tepid quarter-end results from the World Gold Council. In his latest Greed & Fear document, Christopher Wood from CLSA says that he believes the media overreacted to China’s gold demand. With gold demand totaling nearly 800 tons from June 2011 to June 2012, he points out that the country “is still buying a lot of gold.”

As for gold demand in India, his team hears that people are buying gold with cash to avoid the higher duties. “As a result, these cash purchases will not be recorded in the official data,” says Wood.

In addition to these factors, there’s a new growing demand coming from central banks. Wood sums it up for investors: “The conclusion for investors is stupefyingly simple. Stay long gold.”


U.S. Global Investors, Inc. is an investment management firm specializing in gold, natural resources, emerging markets and global infrastructure opportunities around the world. The company, headquartered in San Antonio, Texas, manages 13 no-load mutual funds in the U.S. Global Investors fund family, as well as funds for international clients.

For more updates on global investing from Frank and the rest of the U.S. Global Investors team, follow us on Twitter at www.twitter.com/USFunds or like us on Facebook at www.facebook.com/USFunds. You can also watch exclusive videos on what our research overseas has turned up on our YouTube channel atwww.youtube.com/USFunds.

All opinions expressed and data provided are subject to change without notice. Some of these opinions may not be appropriate to every investor. Standard deviation is a measure of the dispersion of a set of data from its mean. The more spread apart the data, the higher the deviation. Standard deviation is also known as historical volatility.