
Gold & Precious Metals
We offer our latest analysis on the precious metals market.
Gold spiked today to the highest level since May, and is now challenging the top of a trading range that has contained prices for the past three months. The catalyst for the latest move came from an unexpected place—South Africa.

Labor unrest in the world’s largest platinum- and palladium-producing country sparked a furious rally in the prices for those metals. Lonmin, the No. 3 platinum miner, shut down all of its operations amid a violent row with workers. At least 44 people have died so far.
Lost output has naturally pushed up platinum prices significantly. Prices for the autocatalyst were last trading above $1500, at the top end of its recent trading band.
Labor disputes are not uncommon in South Africa. Earlier this year, the No. 2 platinum miner in South Africa, Impala, shut down its output for six weeks due to a strike. That led to a loss of 120,000 ounces of production.
Whether the rally in platinum continues depends on how long the current strike lasts and whether unrest spreads to other producers in South Africa.
PLATINUM

PALLADIUM

For now, the platinum market is in rally mode and that strength is spilling over into fellow autocatalyst palladium, as well as gold and silver. Platinum is used in catalytic converters for diesel engines, and palladium is used in catalytic converters in gasoline engines.
Indeed, we still see silver as having the most upside. An improving economic backdrop should boost demand for the industrial metal. Prices may test the $30 resistance in the coming week, with a break exposing the next layer of resistance at $33.
SILVER

For gold, a break of $1640 will expose a clear path to $1700.
…..READ PAGE 2 HERE

Knowing that it’s very likely that Gold and Silver have bottomed, we feel it is time to look at the charts and assess what may or may not be in store over the next year or two.
Gold has consistently made impulsive advances that were digested by multi-quarter corrections and eventually followed by a breakout and new impulsive advance. Following the last major breakout in late 2009, Gold enjoyed an extended impulsive advance that lasted two years. Previous impulsive advances lasted less than a year. Gold, having bottomed, remains well entrenched in another consolidation that is 12 months old. As we can see from the chart, previous consolidations lasted 16 to 20 months.
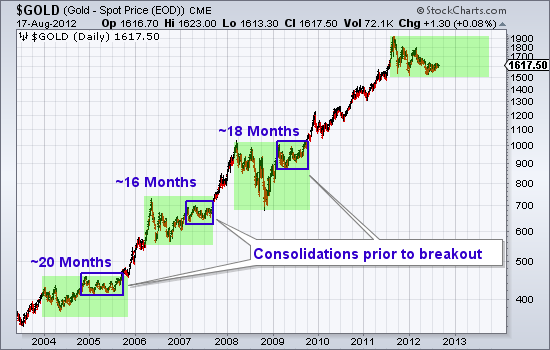
It is important to note that previously Gold, within a year was able to rally back near the recent impulsive high. In other words, Gold is currently in a much weaker state relative to past consolidations. Gold will need to rally back to $1800 or $1900 and that would be followed by a multi-month consolidation that would lead to a breakout. Conservatively speaking, over the next 12 months we could see a rally back to $1900 and a final consolidation.
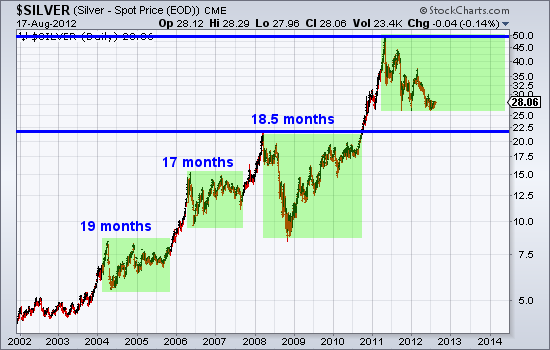
Meanwhile, Silver continues to consolidate and digest the two and a half year advance from $8 to $49. Predictions of $60 or $70 Silver are absurd and fail to account for the lengthy consolidation that is needed to reduce supply and position the market for not only a retest of $50 but an actual breakout. Silver is a commodity with real world supply and demand dynamics. It will be a while before producers won’t sell for $35-$36 and before buyers consider $35 a bargain. That being said, the near and medium term outlook is quite compelling. Longer-term, the market is in a giant cup and handle pattern (dating back to the high in 1980) and this correction and consolidation is the handle. A powerful breakout past $50 in, say 2014, could push Silver towards its bubble phase.
The fact that Gold and Silver are unlikely to break to new highs anytime soon hardly deters me in my bullish enthusiasm for select gold and silver stocks. Key word being select. I’m not bullish on every mining company but I digress. In the chart below I use a 66-day moving average to plot an average quarterly Gold and Silver price. I also circle the moving average at the end of quarters.
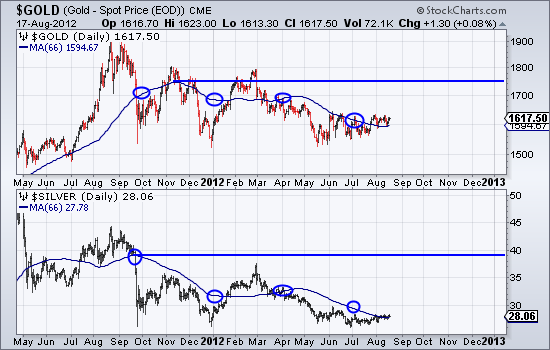
Note that the quarterly high prices for Gold and Silver are roughly $1750 and $39 and far off from the 2011 highs. The quarterly averages are starting to turn up. Well run companies with production increases could very well move to new highs when Gold returns to $1750 and Silver moves past $35. We do think most of the Gold and Silver shares can breakout to new highs ahead of the metals. In other words, the mining shares at large will ultimately challenge for a breakout ahead of Gold and Silver reaching new all time highs. If you’d be interested in ourprofessional guidance and uncovering the producers and explorers poised for biggains, then we invite you to learn more about our service.
Good Luck!
Jordan Roy-Byrne, CMT

Market Notes
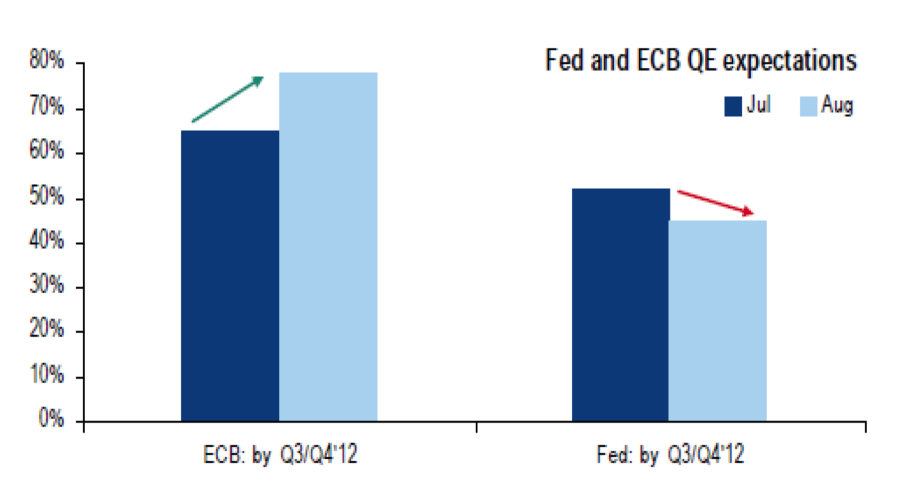
- Recent Merrill Lynch Fund Managers Survey showed that 8 out of 10 fund managers expect ECB to engage into QE engage into QE by the end of the year, while 5 out of 10 expect Fed to re-start QE. Also to note was that managers increased equity exposure to overweight, increased exposure to commodities from underweight to neutral and finally decreased exposure in both cash and bonds.
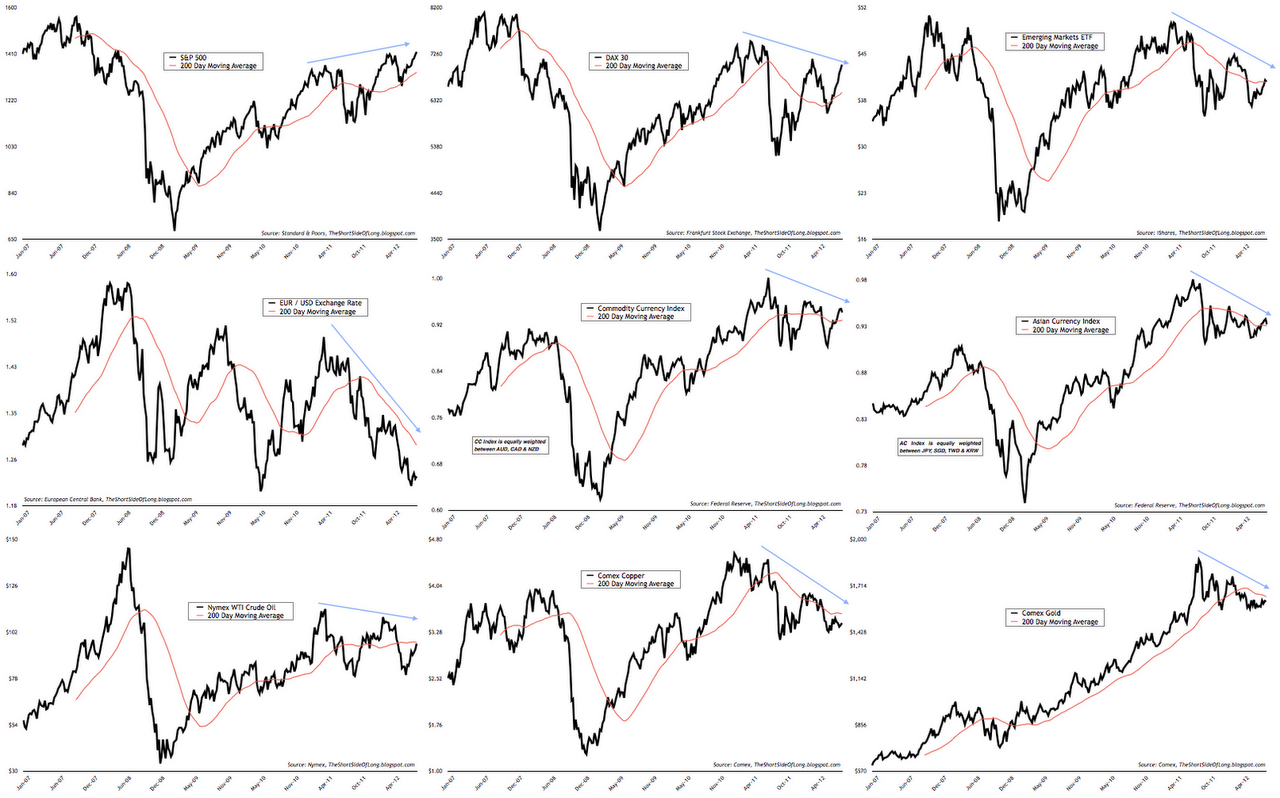
- Bulls well and truly dominate the media space (CNBC, Bloomberg). That is usually what happens when US equities rise for six straight weeks and EU equities rise for 11 straight weeks. NYSE 10 day TRIN breadth measure has now become extremely low and joins other indicators like the VIX in signalling maximum complacency.
- Treasury Inflation Protection securities (TIPs) have done amazingly well in recent years. We have seen a very strong correlation with the overall business cycle since early 2009. TIPs have tracked the improvement in equity prices, industrial production and weekly jobless claims perfectly. Fast forward to today and we see TIPs breaking down. What is the message for other risk assets?
- Global risk appetite is usually best represented by the Aussie Yen exchange rate cross. Australian central bank is seen as a super hawkish inflation fighter during economic upturns, while capital naturally finds its way into Japanese Yen during downturns as a safe haven – a perfect risk on / risk off barometer. Aussie Yen cross continues to send a warning signal for other risk assets
One of the top stories in the financial markets in 2012 has to be the stagnation in the price of gold at around $1600 an ounce, which is down approximately 17% from its peak at $1920.30. Those bullish on the yellow metal have been disappointed in gold’s performance while those bearish on the shiny metal have reveled in its stagnation, saying that gold’s status as a safe haven is over.
What is behind gold’s sluggish performance in 2012? There are several reasons, but one of the key fundamental reasons has been the lack of demand from traditionally the largest buyer of gold on the planet – India (although China will surpass it this year). India bought only 181.3 tons in the second quarter of 2012, a 2-year low, according to the London-based World Gold Council.
There are several factors at play as to why Indian demand for gold has fallen. One reason is the sharp drop in the value of its currency, the rupee, which is down by 25% versus the U.S. dollar this year. This decline has kept gold prices high in relative terms while the actual dollar value of gold was falling. Perhaps even more important has been the ‘war’ declared on gold by its central bank which has blamed all of the country’s economic ills on Indian citizens’ traditional buying of gold. In an attempt to slow down gold and silver imports, the Indian government has imposed new taxes on the purchase of these precious metals.
But even though demand for the precious metal is way down in India, the situation still offers hope for gold bulls. Why? Because we’ve been here before – in 2009 to be exact. In early 2009, the Indian economy and rupee tanked. Gold demand almost completely dried up. According to precious metals consultancy GFMS, Indian demand for gold in the first quarter of 2009 collapsed by 77%. For the full year GFMS said Indian consumption dropped by 19%.
Now with the Indian economy slowing to its weakest growth rate in nearly a decade and the rupee falling, we are seeing a replay of 2009. The monsoon season has been poor, hitting farmers – among the biggest buyers of gold – hard. Gold prices have hit a record high in rupee terms, and India is expected to purchase, as forecast by the World Gold Council, only 750 tons of gold, down 25% from 2011 levels. Meanwhile, the WGC forecasts that China will buy 850 tons of gold this year.
Investors should pay heed to the clues that recent history is giving us. The drop in Indian demand is simply a cyclical phenomenon due to the lousy state of the Indian economy. It will recover eventually. And when it does, look out for the fireworks from renewed Indian demand for gold added to the Chinese demand. In 2010, as pent-up demand for gold was unleashed, Indian gold consumption soared 74% to a record high of 1,006 tons according to GFMS.
Gold bulls surely hope we see something similar in 2013 and that is exactly what I talked about last week based around gold miner stocks and also what Dave Banister’s recent gold forecast was about at TheMarketTrendForecast.com sees in 2013.
Gold Chart Showing 2009 Collapse and Outcome and Current Gold Price Analysis:

Gold Trading & Investing Conclusion:
In short, gold and gold stocks have a lot of work to do before they truly breakout into the next major leg higher. I feel we are nearing that point and they may have bottomed already. Starting a small long position to scale in I think is a safe play. But I would only add more once the trend actually turns up and shows strength in terms of price and volume action.
If you would like to get my weekly analysis on precious metals and the board market be sure to join my free newsletter at www.TheGoldAndOilGuy.com
Chris Vermeulen
Choppy, sideways and range-bound — at this point, investors are probably well-accustomed to hearing silver described that way. Silver market action has been largely lackluster of late, and some market participants may be growing nostalgic. Although the white metal has not broken out in either direction, there was an interesting development in its price action this week. On Monday, Tuesday and Wednesday, silver’s closing New York spot price was exactly the same: $27.83.
Hedge funds are the least bullish on silver in four years, according to Bloomberg, and speculative bets for higher prices have been cut by 72 percent since February
Silver appears to encounter resistance in the range of $28.30 to $28.40. There is solid resistance at the July high of $28.44. A close above this level could allow for an upside breakout.
….read the whole article HERE

-
I know Mike is a very solid investor and respect his opinions very much. So if he says pay attention to this or that - I will.
~ Dale G.
-
I've started managing my own investments so view Michael's site as a one-stop shop from which to get information and perspectives.
~ Dave E.
-
Michael offers easy reading, honest, common sense information that anyone can use in a practical manner.
~ der_al.
-
A sane voice in a scrambled investment world.
~ Ed R.
Inside Edge Pro Contributors

Greg Weldon

Josef Schachter

Tyler Bollhorn

Ryan Irvine

Paul Beattie

Martin Straith

Patrick Ceresna

Mark Leibovit

James Thorne

Victor Adair