
Gold & Precious Metals

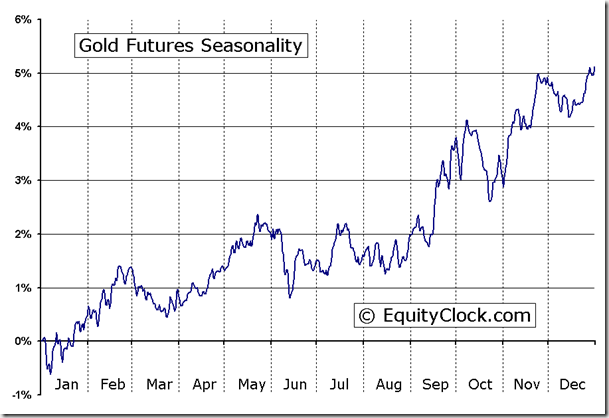
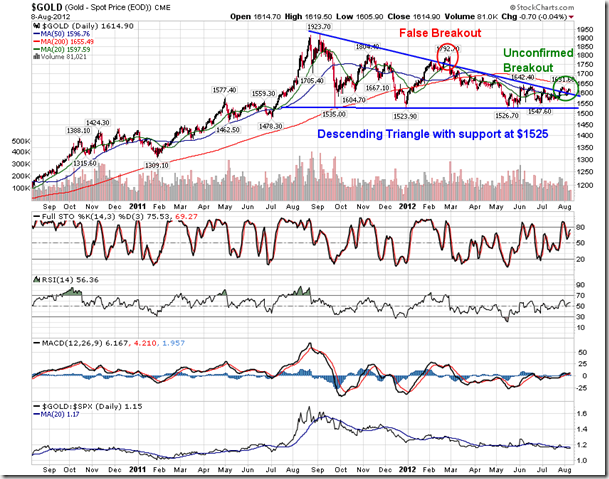
With Europe in Financial Crisis, the US Debt soaked and struggling economically, the biggest influence on gold prices right now is the expectation towards more monetary easing, either out of Europe or the U.S. That’s the No. 1 driver. For Gold investors this happily coincides with Equity Clock’s seasonal and technical studies which clearly show that Gold typically embarks on a significant upward swing during the month of August. Furthermore, as the second chart shows that Gold in US Dollar Terms is not only down 16% from its high, it is breaking out of a yearlong descendng triangle, typically a reliable technical indicator.
Gold Mining issues outperformed this week too, as another indication that this rally is getting underway. The GDX is up 4% so far and the GDXJ is up 4.5%.

One interesting facet is that Silver is in Backwardation. Backwardation occurs when the future price of a commodity (gold, silver, oil, corn, etc.) is less than the current spot price. In other words, the price you pay now is higher than the price you have the option of paying a month later. . .two months later. . .or a year later.” The result, according to Brian Hicks of Wealth Daily, is “Historically backwardation means one of two things:
1) there’s a current shortage of silver bullion available on the open market and/or
2) silver traders believe the price of silver is about to take off.” Hicks continues, “Basically it means that there are relatively few silver owners that are willing to sell their bullion holdings. As a result of this tight supply, there’s an increasing amount of demand for bullion that is jacking-up the current spot price of silver. And that’s the significance of backwardation. The current spot price of silver is an accurate record of the real spot price of physical silver as long as people are willing to exchange currency for silver at that price, which is why backwardation is so important.”
James Turk pointed out in an interview with King World News that gold may also be in backwardation. Turk says, “I think it is, even though the gold forward rate doesn’t show it simply because dollar interest rates are manipulated. I think to a large extent gold interest rates can’t be manipulated any more than they have been. So the true reflection of the market is you have a backwardation, but it’s not obvious because of the various interest rate manipulations that are going on. That’s very bullish. Whenever you get the metals in backwardation it’s a very bullish situation. I” I think that’s what we’ve got right here.” Turk also commented, “The bottom line is we are in a fiat currency bubble. Eventually this bubble is going to pop because we are using this fiat currency, backed by nothing, not just in one country, but throughout the world”.
John Embry of Sprott Asset Management says that the next big move in gold may be the result of supply more than demand. He told King World News, “I have been a long time proponent of the idea that we may very well be at peak gold production in the world. We may have seen the peak. The problem is that all of the low hanging fruit has long since been plucked. The high grade ore bodies in geopolitically (friendly) places have (already) been mined and a lot of these open pits have been mined. And they (open pits) have a very finite life. Underground mines last forever (by comparison). But the fact is all of the easy stuff has been mined and where you are now finding anything of significance, it tends to be in geopolitically unattractive areas. They are hard to mine and they are going to be extraordinarily expensive to mine… I don’t worry too much about the fact that the production profile can’t grow that much because ultimately that will be extremely bullish for the gold price. This is a classic supply/demand squeeze. We know that demand is rising in many parts of the world… If there is no greater amount of gold coming out of the ground, the only thing that can arbitrate where the gold goes is price, and the price will go up a lot. I think the gold price could go up to multiples of the current price.” Embry is even more bullish on silver: “I have been of the long held opinion that if we get into a raging bull market, which we are going to in the two precious metals, that silver will head towards the low end of the gold/silver ratio, which is currently over 50. In real bull markets, it will fall as low as 10 or 15 (to 1). If that happens, silver will move up three times as fast as gold by the time this is all over. And I think gold is going a long ways, so you can get really excited about the upside potential in silver.”
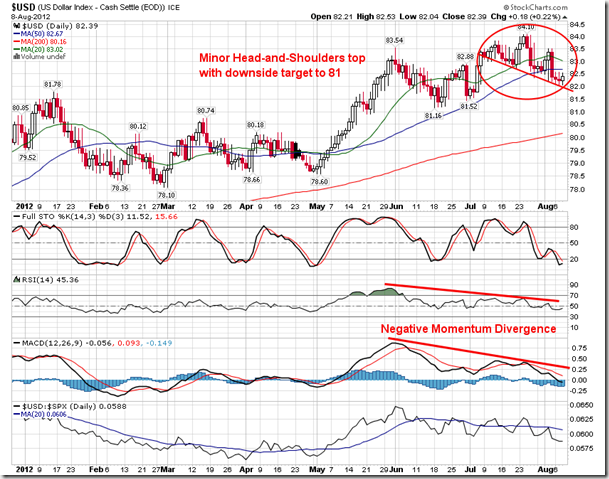
The Bottom Line? The framework for a strong move higher in Gold has become established. In addition to increased inflation expectations, the US Dollar index has also come under pressure over the course of the past month and a minor head-and-shoulders top can be spotted on the charts. The target of this topping pattern points down to 81, also the point at which the price action would intersect with the rising intermediate trendline. As you can see in Equity Clocks Seasonality Chart below, the US Dollar Index seasonally declines, on average, between now and September, supporting commodity prices, such as Gold.


1. To view the big picture for gold, look at the chart below (click HERE for Larger Image) . Gold has been consolidating for almost a year.
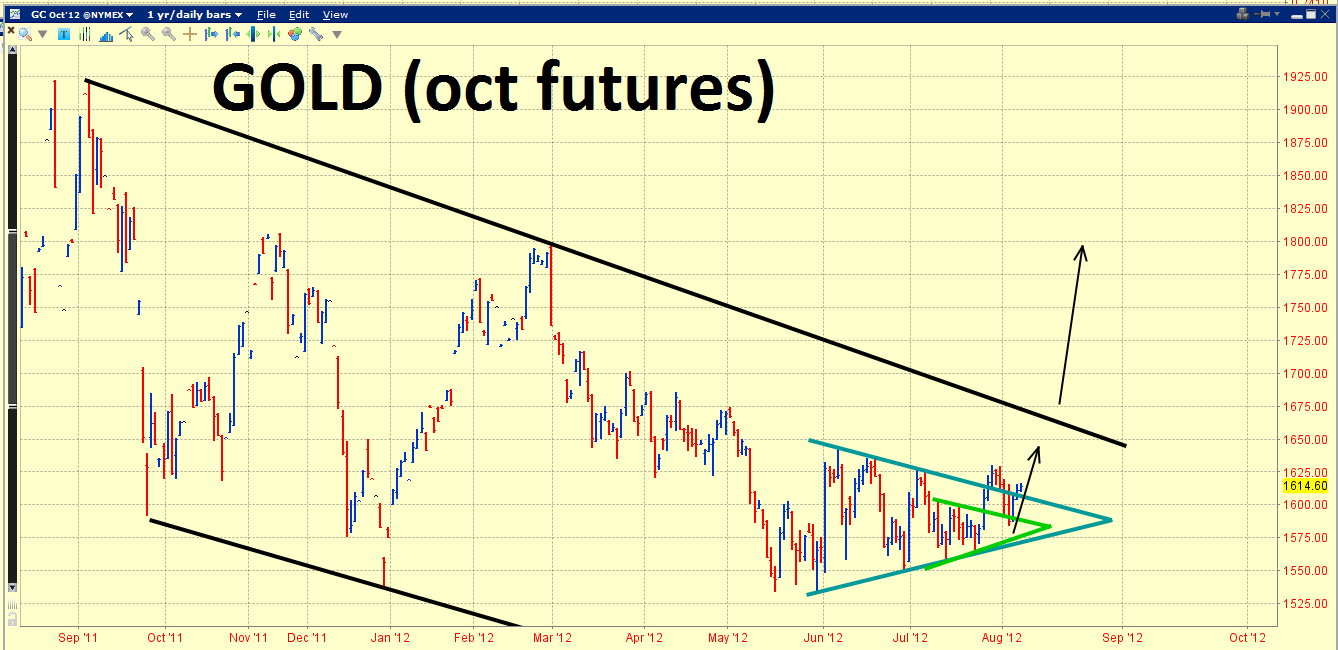
2. Two key symmetrical triangles have formed, and they appear to be acting as the “firing pins” that will help gold begin a major price advance.
3. Please click here now. You can see that gold pulled back towards the middle of the green triangle, and then quickly bounced higher.
4. As of this morning, gold is also trading above the larger dark blue triangle, which technically confirms a breakout. That breakout should produce serious follow-through to yesterday’s price action, for the rest of the trading week.
5. Please click here now. Is that a chart, or a piece of sculpture created by Michelangelo? I would argue that the GDXJ chart qualifies as “chart of the year”.
6. Many individual junior gold stocks are coming to life, and this GDXJ chart suggests a virtual price geyser is imminent. Note the small but beautiful head & shoulders bottom. It is a complex pattern, featuring two heads.
7. The neckline of that pattern sits at about $20.30, denoted by the thin black line of HSR (horizontal support & resistance).
8. GDXJ had a great day of trading yesterday, but Canadian markets were closed. Many hedge funds engage in what may be called “nefarious” shorting of junior resource companies on the CDNX exchange.
9. When Canadian markets open today, I want to see GDXJ blast up through the neckline and over the green downtrend line.
10. The two green trend lines denote an enormous bullish wedge pattern. The GDXJ chart could be termed a “snorting bull”. The chart showcases a double bottom pattern, a head & shoulders bottom, and a bullish wedge.
11. I don’t think that junior gold stock investors could ask for a more bullish chart than this one.
12. The amount of pain endured by the average gold stock investor in this crisis rivals that endured by 1990s technology stock investors. The difference is that you are likely about to be rewarded in a very big way!
13. Silver fans should click here now. Note the bullish pullback to the apex of a triangle pattern. It’s technically bearish if the price “hangs around” the apex, and bullish if it can quickly move higher.
14. In this case, price has moved higher, opening the door for a run towards $28.50. Silver is trading less aggressively than gold is now, which is what I want to see at the beginning of a major bull phase for precious metals.
15. August 7th is my “official start date” to the Dow crash season, and it runs to October 31. The Dow rarely crashes, but I still like to be out of the market during crash season.
16. Platinum is a metal that is much more volatile than gold and tends to crash badly when the Dow crashes. In 2008, platinum fell over 60%, while gold only fell by about 30%.
17. Is platinum hinting that the global economy, and perhaps the Dow, are about to take a hit? Please click here now.
18. While the gold and silver charts look superb, there is a nasty head & shoulders top pattern in place on the weekly platinum chart.
19. It is sitting on strong price support on the longer term charts. Please click here now. You can see that $1340 and $938 are two key areas of enormous price support.
20. I would be a modest buyer of platinum in the current $1400 area, and a much more substantial buyer in the $900-$1000 area.
21. Please click here now. GDX performed like a champion yesterday, and I expect more of the same action all week long.
22. Note the HSR line defined by the circled low at $43.98. GDX is chewing at that resistance like a pitbull chews on balsa wood.
23. If GDX can get over $44, I think it will quickly surge towards the HSR created by the circled high of $48.72, and the circled low of $49.22.
24. The 2011 gold stocks debacle was arguably as bad as the wipeout of the early 1980s or the lows of 1999, but the gold community, and the stocks it invests in, possess a resiliency that never existed in the technology sector. Welcome to the golden age of the gold community. It starts now!
Special Offer For Website Readers: Send me an Email to freereports4@gracelandupdates.com and I’ll send you my free CPI report! Learn what cost push inflation is and how QE helped to create it. I’ll explain why CPI is the most powerful driver of the gold market now, and which stocks could benefit from it!
Thanks!
Cheers
St
Written between 4am-7am. 5-6 issues per week. Emailed at aprox 9am daily.

-
I know Mike is a very solid investor and respect his opinions very much. So if he says pay attention to this or that - I will.
~ Dale G.
-
I've started managing my own investments so view Michael's site as a one-stop shop from which to get information and perspectives.
~ Dave E.
-
Michael offers easy reading, honest, common sense information that anyone can use in a practical manner.
~ der_al.
-
A sane voice in a scrambled investment world.
~ Ed R.
Inside Edge Pro Contributors

Greg Weldon

Josef Schachter

Tyler Bollhorn

Ryan Irvine

Paul Beattie

Martin Straith

Patrick Ceresna

Mark Leibovit

James Thorne

Victor Adair