
Gold & Precious Metals
Today’s videos and charts (double click to enlarge):
SFS Key Charts & Video Update


SF60 Key Charts & Video Update


SF Juniors Key Charts & Video Analysis


SF Trader Time Key Charts & Video Analysis


Morris
website: www.superforcesignals.com
email: trading@superforcesignals.com

Gold moved visibly higher during the first session of the year and this time mining stocks accompanied it. In fact, it seems that they are back on the track after a short pause. What’s the likely reason behind this year’s rally and what does it imply going forward?
Let’s jump right into the mining stock charts (chart courtesy of http://stockcharts.com).
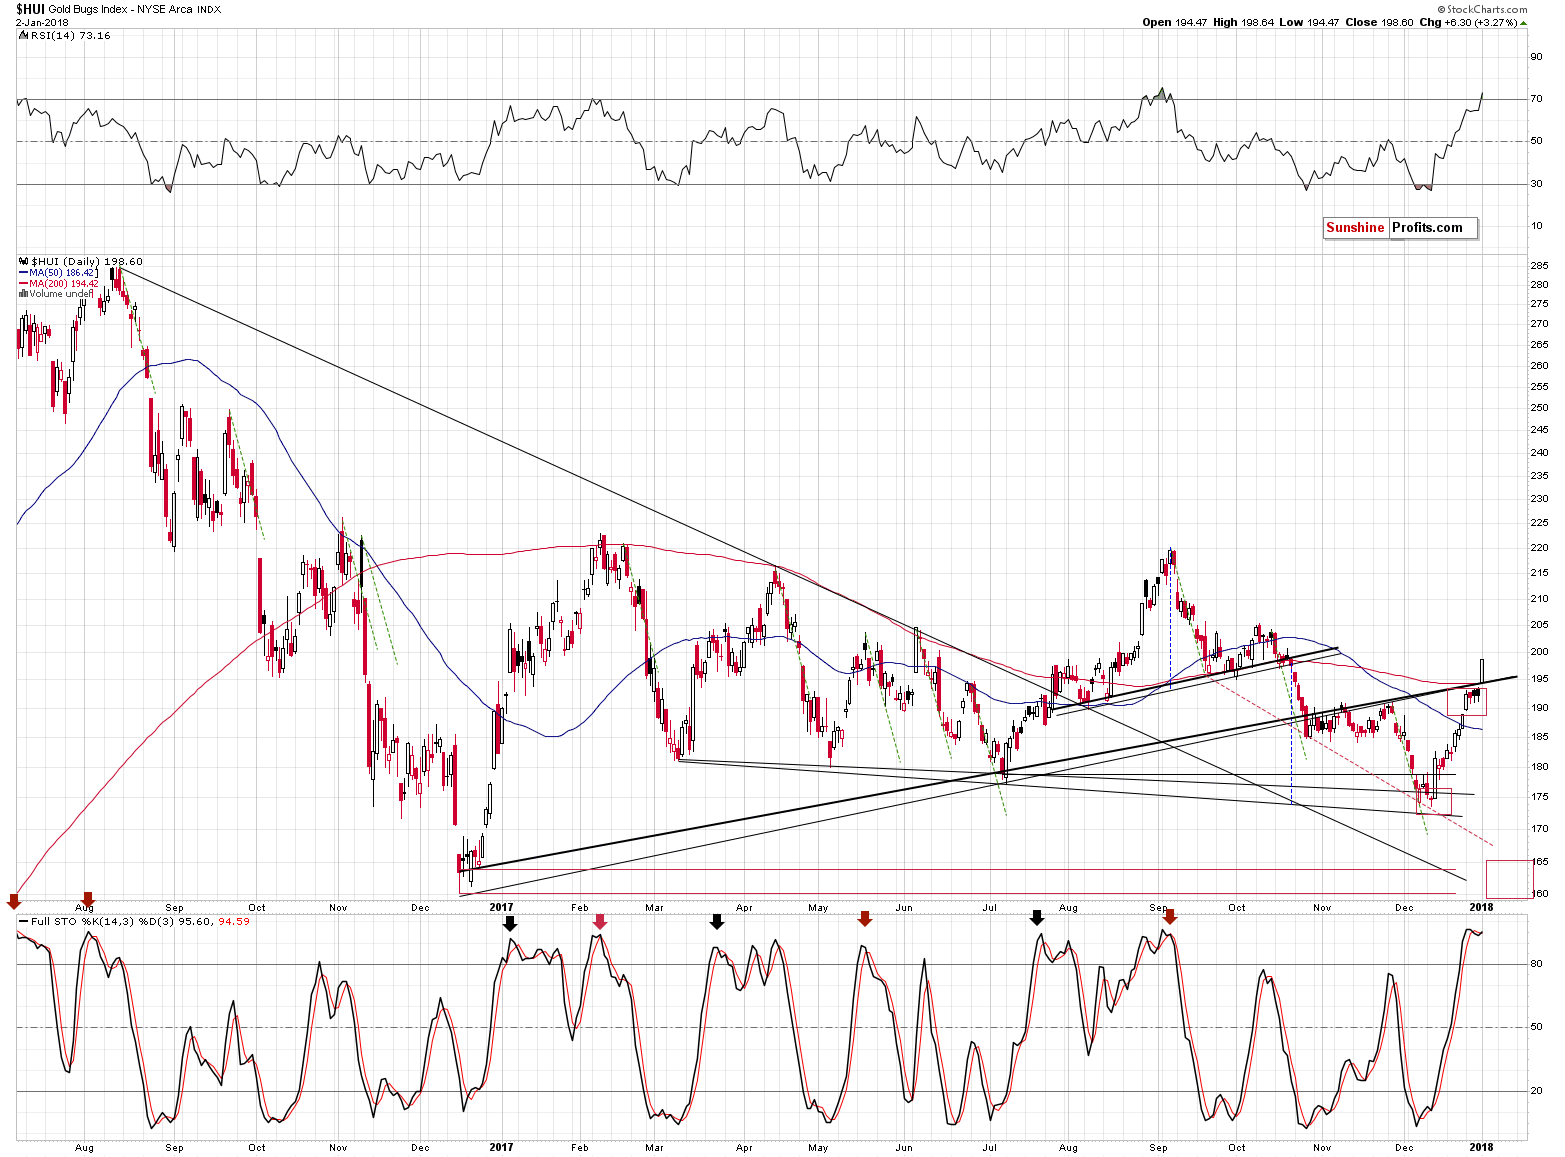
Gold stocks indeed broke above the rising support lines, but since that was only one close above them, the breakout is unconfirmed. There are several reasons to think that it will not be confirmed without even considering the apex-based reversal or gold’s cyclical turning point.
The two things that we would like to discuss with regard to the above chart are: the 200-day moving average, and the RSI above the 70 level.
The former was broken rather insignificantly and this doesn’t invalidate the bearish analogy to the previous similar patterns. For instance, in February, the day when the HUI Index closed above the 200-day MA was the day of the final top. In fact, higher HUI values have never been seen since that time. The June rally also ended above the MA, but the follow-up action was very bearish.
As far as the second factor is concerned, there was only one case in the previous months, when the RSI indicator moved as high as it did yesterday – in early September. Mining stocks started an almost 50-index point-decline shortly thereafter.
Moreover, the moments when the RSI moved only to 70 level, without breaking above it, were almost always times when it was a good idea to be short the precious metals market. July 2016, February 2017, and the August-September 2017 top were all confirmed by the RSI at or above the 70 level. Naturally, the implications are bearish.
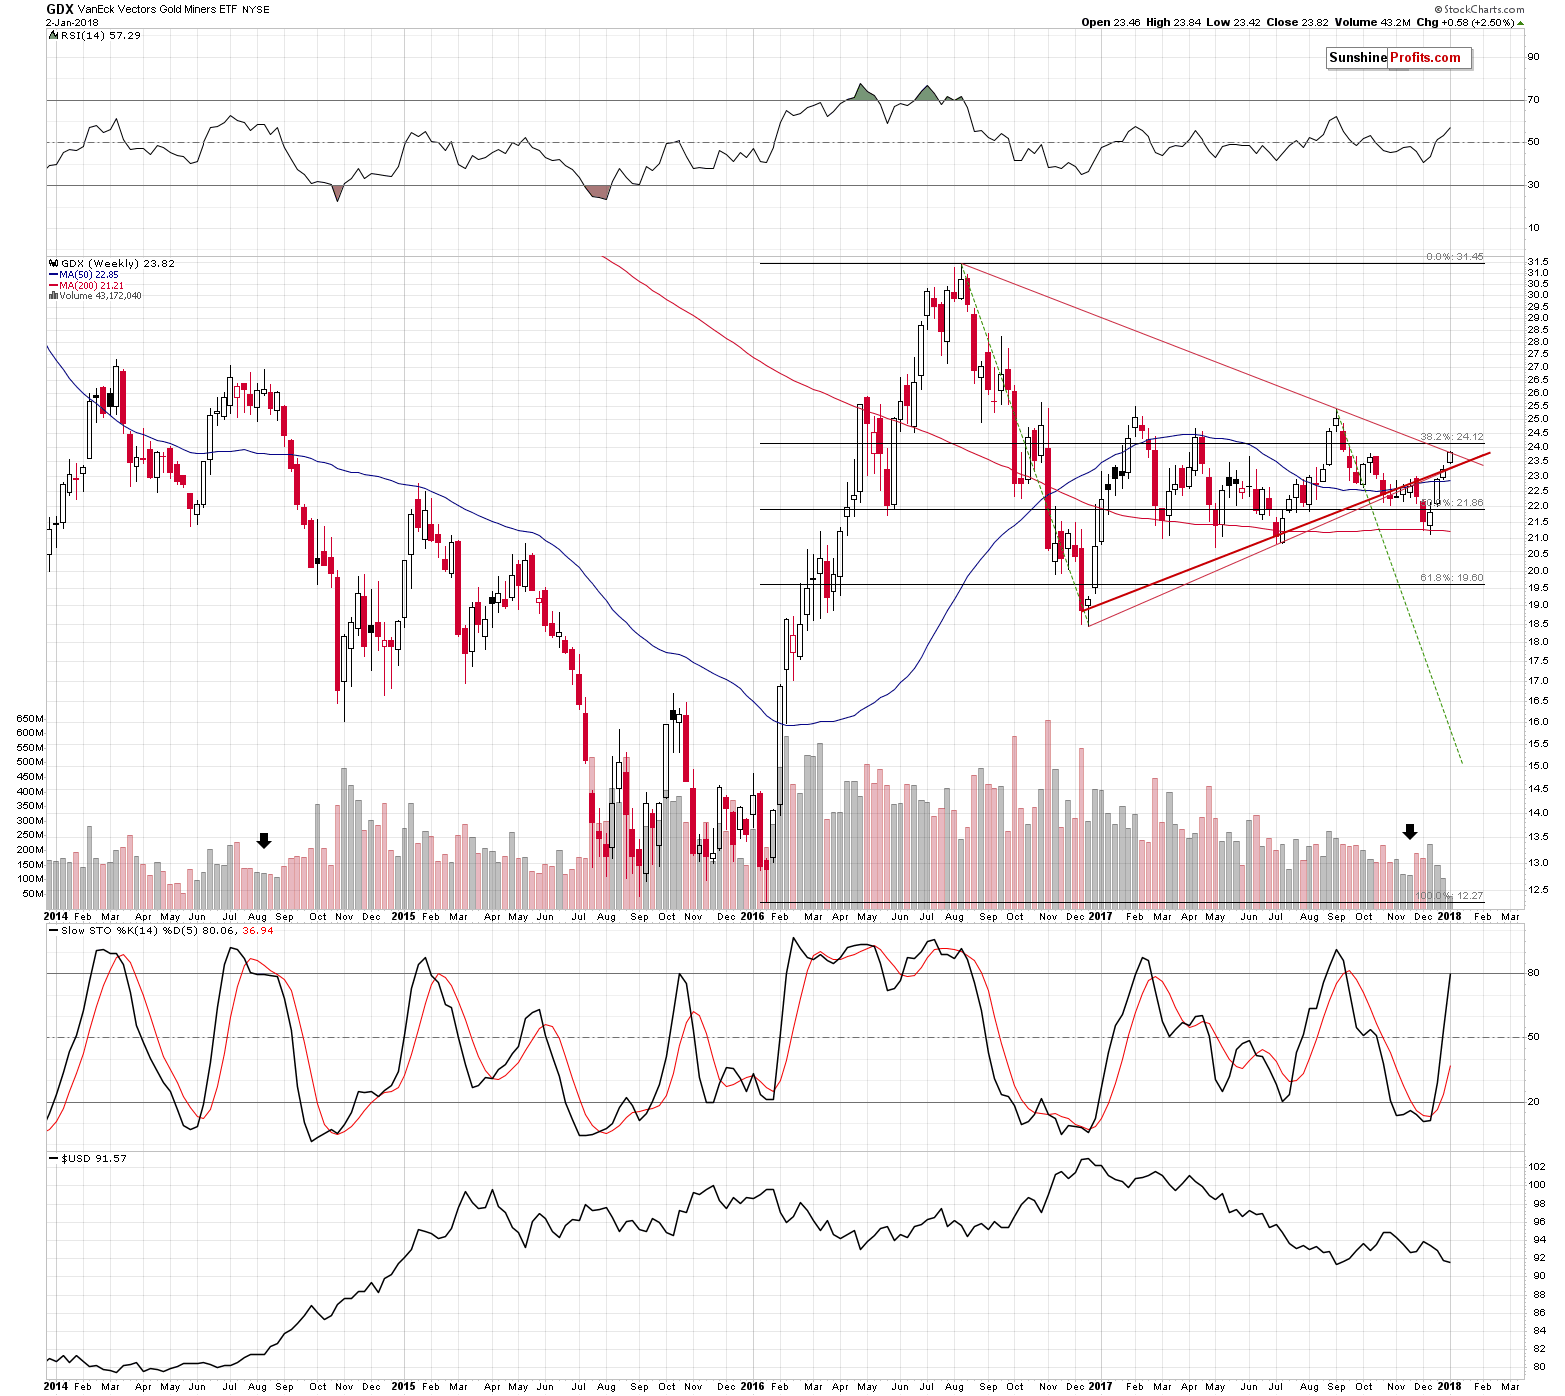
Plus, while the rising support line was broken (again, the breakout was not confirmed), the declining, even more long-term line, held. So, did we really saw a major breakout yesterday that changed the outlook? Not necessarily.
The key reason why we shouldn’t trust yesterday’s move is not visible on the above charts.
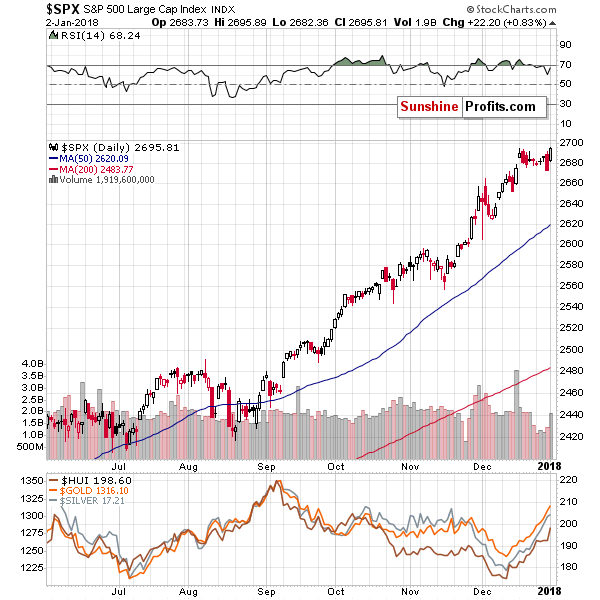
It’s partially visible on the general stock market chart. In fact, it’s the likely reason that all stocks soared yesterday, not just miners. The reason is selling during the year or at its end due to tax reasons and then buying back at the beginning of the year. In this way, investors are able to book the losses, which often leads to a decrease in one’s taxes on investments. Those who want to keep the exposure to a given stock, often buy back in the first day of the following year.
Consequently, yesterday’s “strength” in mining stocks is likely no strength at all – it’s likely just a result of applying one of the tax-optimizing investment ideas.
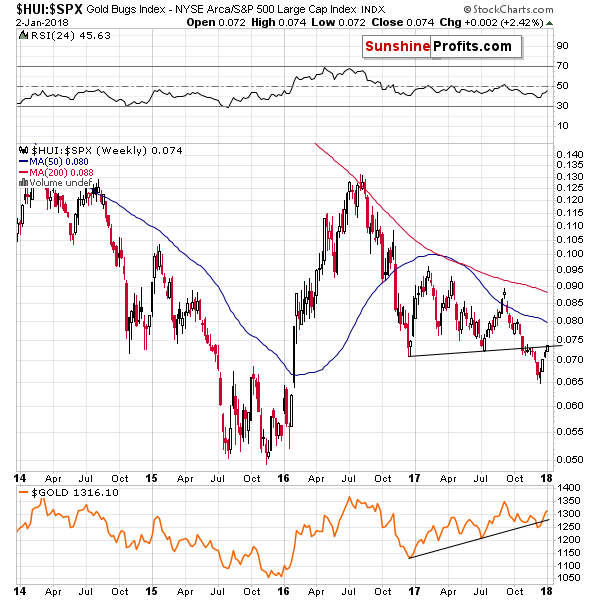
The above chart showing the golds stock ratio to the general stock market shows that there was no major breakout yesterday. Why? Because by looking at the ratio, we’re looking at the chart that “takes out” the factors that impact the entire stock market in the same way. In math, when we do the same multiplication for the numerator and the denominator of a faction, we are left with the same fraction. So, since there was no major move in the ratio, it seems that the same thing caused the rally in both markets and thus, what we saw yesterday was not a sign of strength in the precious metals sector.
Summing up, even though it seems that this year’s daily rally was a big deal, it most likely isn’t. There is a good explanation for mining stocks upswing in the form of the tax-optimizing technique. In other words, miners didn’t really show strength this week and the outlook for gold price in January didn’t really improve.
We hope you enjoyed today’s analysis. If you’d like to receive follow-ups (including the intraday ones, when things get hot), we invite you to subscribe to our Gold & Silver Trading Alerts.
Thank you.
Sincerely,
Przemyslaw Radomski, CFA
Founder, Editor-in-chief, Gold & Silver Fund Manager
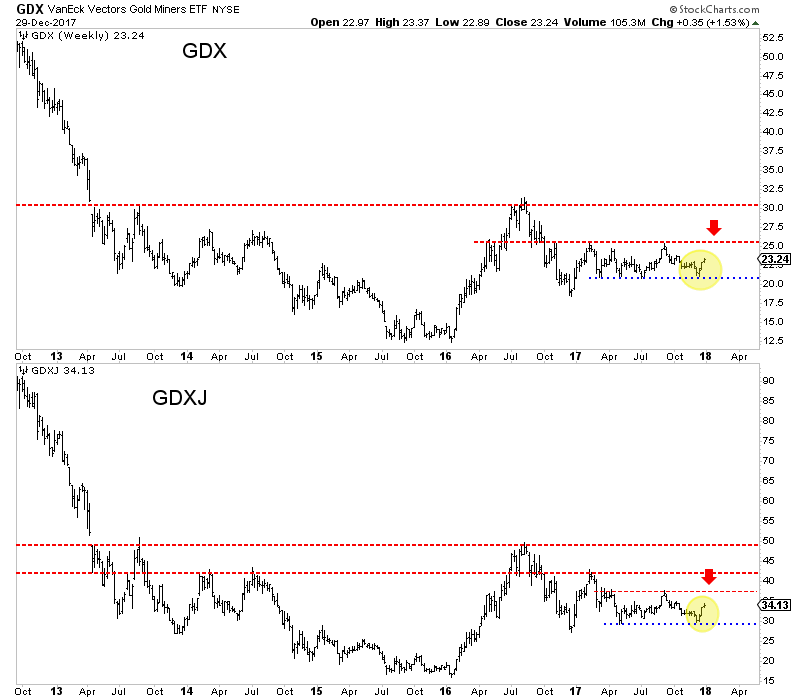
 There are very few sellers left
There were very few sellers left in January 2016 when the devastating “forever bear” was about to end. Six months later and a 150% rebound in the large caps and 200% rise in the juniors (GDXJ) provided sellers an opportunity. They drove the miners and juniors down by 40% to 45% in less than five months. However, both GDX and GDXJ have been able to hold above that low multiple times. GDX has held $21 four times! GDXJ has held $29.50 twice in solid fashion.
The bears had multiple opportunities in 2017 to push the miners lower but the miners held above their December 2016 lows and maintained the 62% retracement of the 2016 surge. The miners did not break out in 2017 but they held key support multiple times and the latest rebound suggests selling power has dried up.
The recovery pattern following a mega-bear market bodes well for gold stocks in the second half of 2018
In November we wrote about this history and the potential implication for gold stocks in 2018 and beyond. The mega bear markets that compare to gold stocks from 2011-2016 with respect to price (+80% decline) and time (+2 years) follow a distinct pattern. The initial rebound is sizeable in price but not so much in time. That gives way to a correction and consolidation that lasts a minimum of 18 months. Then the market surges higher in third-wave like fashion.
The gold stocks are nearly 17 months through their consolidation. We do not know if the consolidation is ending soon or if it will last another three, six or even nine months. We do know that history argues the correction and consolidation should end sometime in 2018.
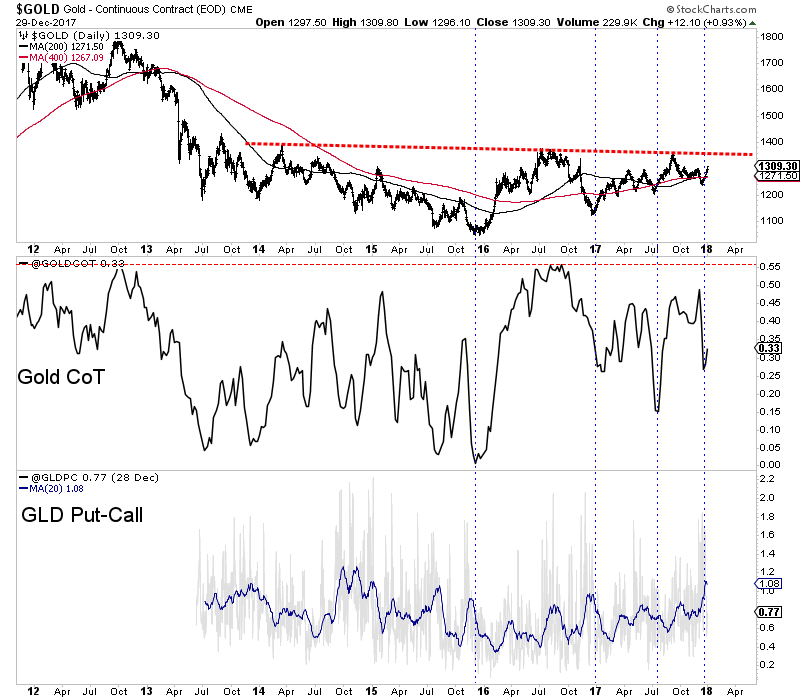
Gold is not too far away from breaking out
Gold is much closer to breaking its 2016 high than the miners but the miners could begin to sniff that potential breakout in Gold before or as it happens. Gold recently bottomed around $1240 with sentiment indicators at encouraging levels. In the chart below we plot Gold along with its net speculative position as a percentage of open interest (CoT) and the GLD put-call ratio. The CoT recently touched 27% which, although not a bearish extreme is fairly low relative to most readings since February 2016. The GLD put-call ratio recently touched the highest level in more than two years. With current sentiment relatively muted, Gold has a chance to rally up to trendline resistance. That would put it in position to breakout sometime in 2018.
Gold Stocks are one of the few sectors that offer compelling value
As we discussed last week, the gold stocks continue to offer historic value. The value is not quite as historic as in January 2016 when it was absolutely historic but it remains exceptional. Outside of the commodity sector there is nothing in a value sense that compares with the gold stocks. Even within the commodity sector, there is little that compares to gold stocks. Heading into 2018 traders and investors have to be intrigued at the deep value opportunity in the gold stocks in nominal and especially relative terms.
Increasing inflation expectations
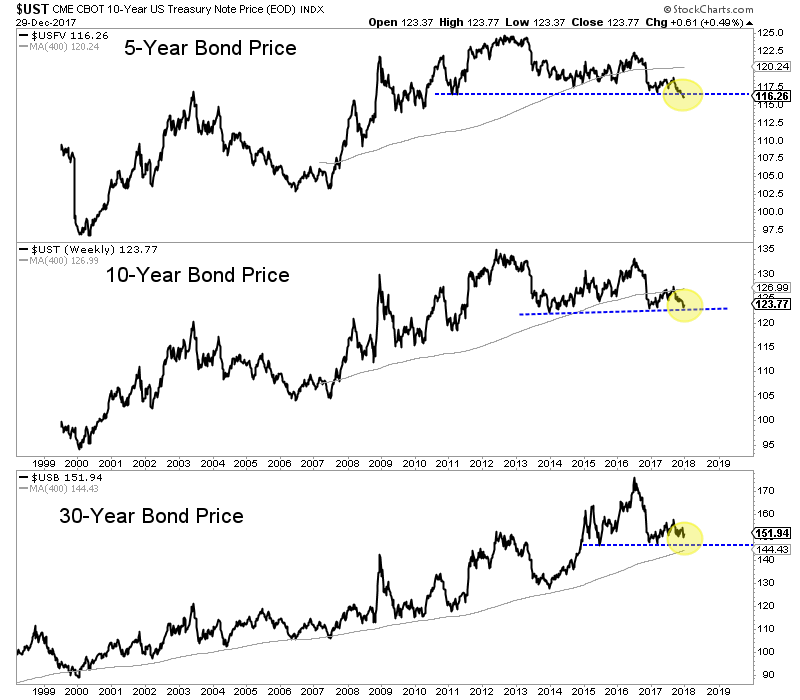
Commodities typically outperform at the end of an expansion and into the beginning of a recession. This is accompanied by rising inflation. Some commodity sectors have performed well but the commodities as a whole (CRB or CCI) has yet to make new highs. One thing that could trigger a sharp rise in inflation expectations would be a breakdown in long-term bond prices.
In the chart below we plot the 5-year bond price, the 10-year bond price and the 30-year bond price. The 5-year bond has already broken to a 7-year low while the 10-year bond is not far behind. The 30-year bond continues to hold above its 2015-2016 lows but does not have much wiggle room. A breakdown in the 10-year and 30-year bonds may not be immediately bullish for precious metals but a continued decline or acceleration to the downside would be.
The strength of the current rebound in the gold stocks has definitely surpassed our expectations and the December lows should hold moving forward. If that is the case then a breakout move for the gold stocks this year is more likely than not. More backing and filling may be ahead but if GDX and GDXJ can surpass their September highs it would be a very good sign for 2018. The miners have plenty of work to do before a true breakout move can begin but traders and investors would be wise to keep a close eye on the sector. We prefer companies with strong fundamentals that are trading at reasonable values and have upcoming catalysts that will drive buying. To follow our guidance and learn our favorite juniors for 2018, consider learning more about our premium service.

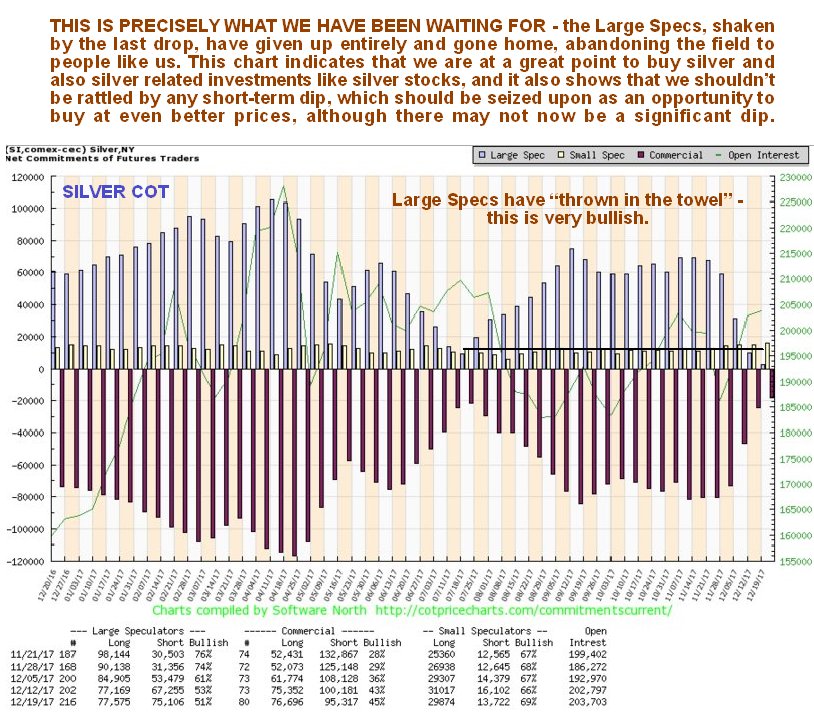
For many weeks we have been waiting patiently, like vultures perched on the branches of trees, for the Large Specs to go belly up and croak, and the good news is that they just have, so it’s time for us to swoop down and feast on the carcasses, the carcasses being silver and the better silver stocks, which are at good prices here, and although they have already started rallying over the past week or two, the COT structure is now much healthier, suggesting that they will continue to advance.
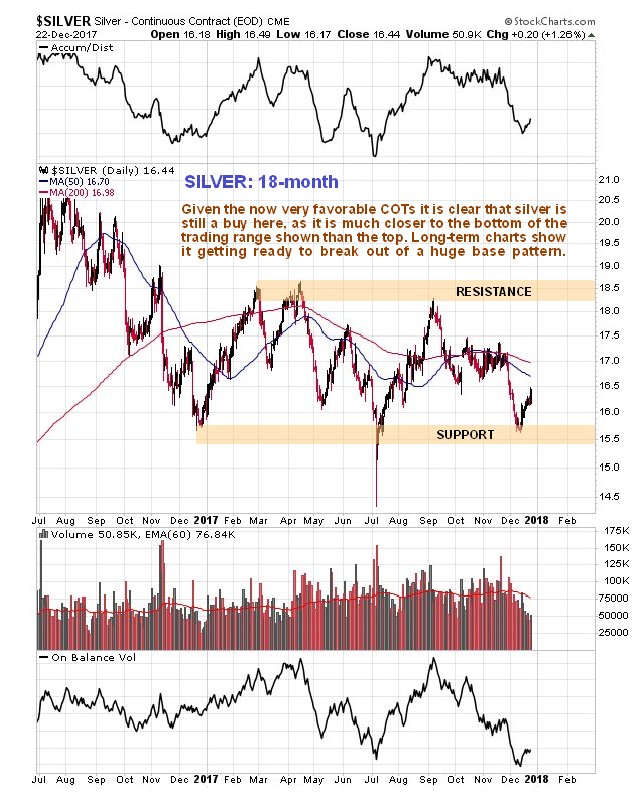
On the 6-month silver chart we can see the breakdown from a Symmetrical triangle that occurred late in November leading to a drop well into December, and also how silver has slowly recovered over the past 2 weeks. In itself this chart looks bearish, with a breakdown followed by a rally back up towards resistance, and moving averages in unfavorable alignment, and it is only when we consider the latest COTs and then look at long-term charts that we realize that the setup is a lot more bullish than it looks at first sight on this 6-month chart.

Next we will look at a 18-month silver chart, the main reason being so that we can compare the peaks and troughs on it directly to the 1-year COT chart placed below it. On this chart we can see that the silver price is within the confines of a large gently downsloping trading range bounded by approx. $15.25 on the downside and $18.50 on the upside. This chart makes clear why it turned up where it did a couple of weeks ago – it had arrived at a zone of support towards its July lows.
Click on chart to popup a larger clearer version.
The latest silver COT chart shows a remarkable improvement in the COT structure in the space of just 4 weeks, remarkable because the drop in the silver price that triggered it was not all that great. What this COT chart shows us is that this latest drop in the silver price was “the last straw” for the Large Specs, who have “thrown in the towel”, with the huge profits made by Bitcoin speculators in recent weeks making them feel like right lemons. If you had to give a job description for the Large Specs in silver, the most accurate one would be “bagholder” since collectively they are always wrong, and you certainly don’t want to see them with a big long position if you are contemplating buying. Right now they are nowhere to be seen – they have fled, which means that the coast is clear for Smart Money buyers. There have been some doubts expressed with respect to silver in the recent past along the lines that either it will drop to new lows, or double dip to its lows of approx. 2 weeks ago, but the latest COT suggests that a drop to new lows is probably out of the question, and further that while we cannot rule out a drop towards the lows of 2 weeks ago, it looks unlikely, and should it do so, aggressive buying will be in order. Here we should note that a favorable COT setup generally leads to a rally, but does not, by itself, mean that a new bullmarket is set to start, although it is normally a precondition for a new bullmarket.
The latest Hedgers chart, a form of COT chart, also looks good for silver, and because this chart goes back much further than the COT chart, it enables us to see what happened to the silver price following peaks on this chart going back years…
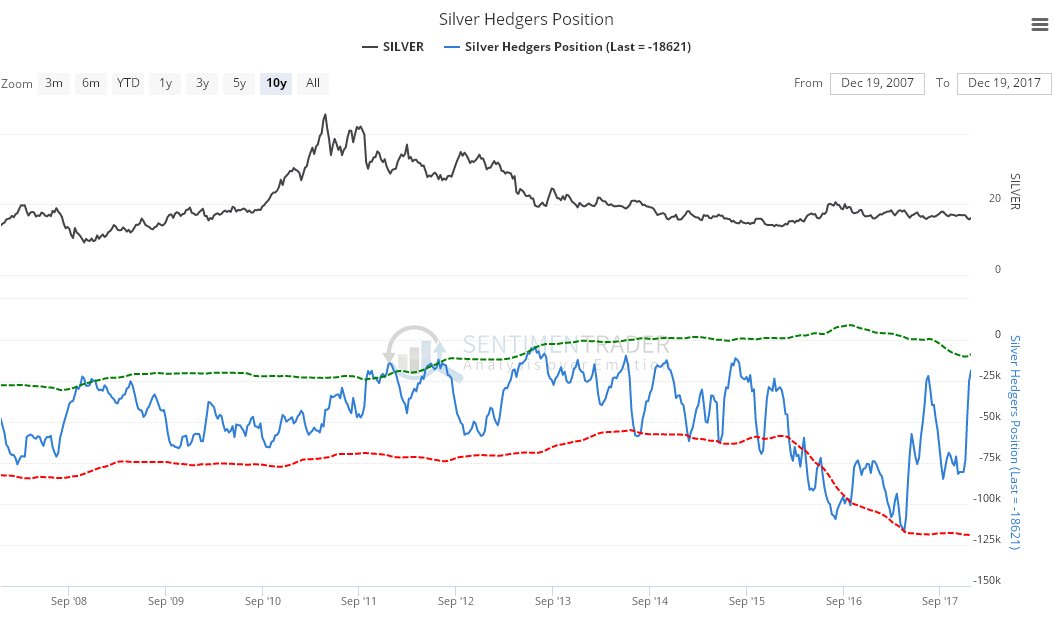
Click on chart to popup a larger clearer version.Chart courtesy of sentimentrader.com
The long-term 10-year chart calls to mind the excellent film Groundhog Day, where a guy keeps living the same day over and over, because we just keep trotting out the same description for the long-term silver chart (which does save work). Here it is again, with some adjustment:-
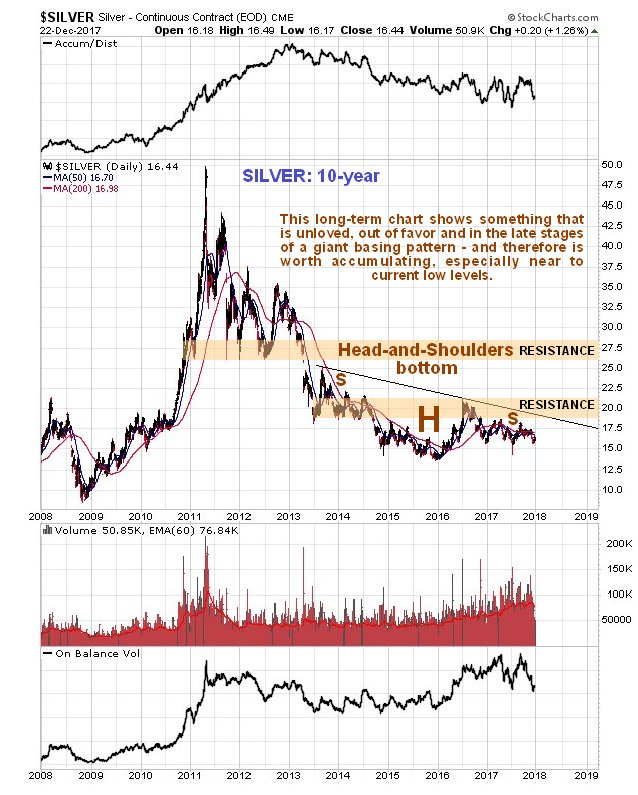
Like gold, silver is marking out a giant Head-and-Shoulders bottom pattern, but in silver’s case it is downsloping as we can see on its 10-year chart below, which reflects the fact that silver tends to underperform gold at the end of sector bearmarkets and during the early stages of sector bullmarkets. Prolonged underperformance by silver is therefore a sign of a bottom. This chart really does show how unloved silver is right now, and while we have seen some deterioration in its volume indicators in recent weeks, more important is the big improvement in the COT structure detailed above. A break above the neckline of the pattern, the black line, will be a positive development, and more so a break above the band of resistance approaching the 2016 highs. Once it gets above this it will have to contend with a quite strong zone of resistance roughly between $26 and $28.
Finally, we see that silver’s best month of the year is coming right up!…
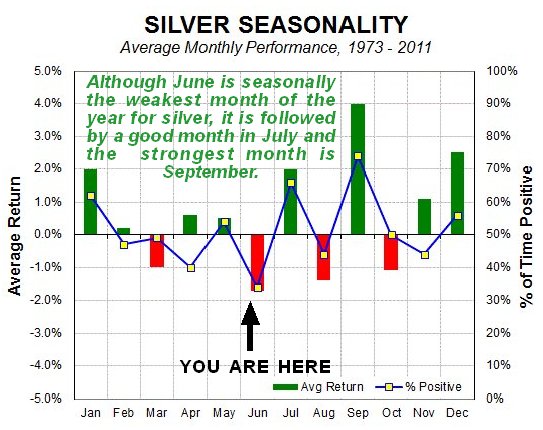
Click on chart to popup a larger clearer version.Chart courtesy of www.sentimentrader.comThe conclusion is that silver is now a strong buy, and an even stronger buy in the event that it should react back short-term towards its lows of about 2 weeks ago. Whilst we can speculate about why the silver price should rise soon, with reasons such as a falling dollar, and funds flowing out of the cryptos as a result of the Bitcoin bust, an attack on Iran etc, it is not really necessary as the charts speak for themselves.End of update.

-
I know Mike is a very solid investor and respect his opinions very much. So if he says pay attention to this or that - I will.
~ Dale G.
-
I've started managing my own investments so view Michael's site as a one-stop shop from which to get information and perspectives.
~ Dave E.
-
Michael offers easy reading, honest, common sense information that anyone can use in a practical manner.
~ der_al.
-
A sane voice in a scrambled investment world.
~ Ed R.
Inside Edge Pro Contributors

Greg Weldon

Josef Schachter

Tyler Bollhorn

Ryan Irvine

Paul Beattie

Martin Straith

Patrick Ceresna

Mark Leibovit

James Thorne

Victor Adair