
Gold & Precious Metals
Over the short to medium-term gold is likely to be buffeted by conflicting cross currents as we will proceed to see a little later, so it is important to keep a handle on the big picture, and for this reason we will start by reminding ourselves how bullish the big picture is for gold by looking at its long-term chart.
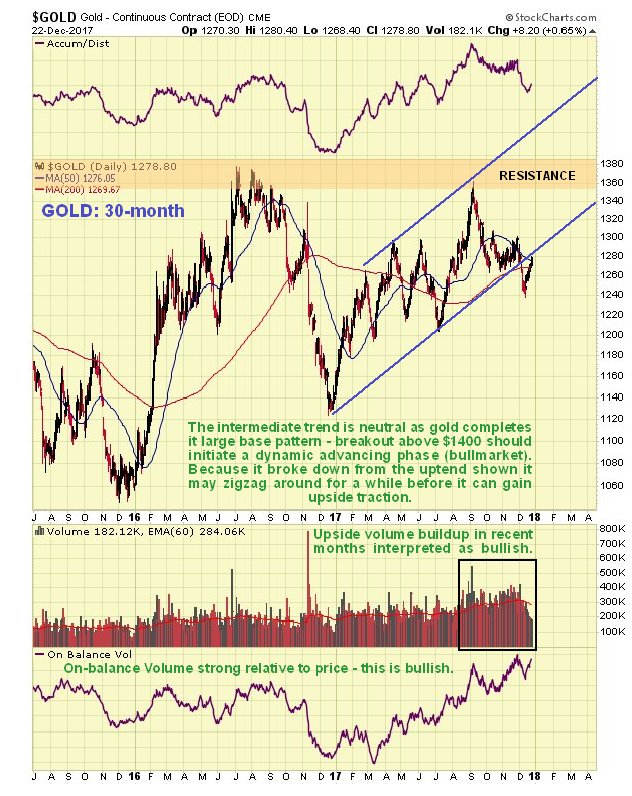
On its 10-year chart we see that gold is in the late stages of a large Head-and-Shoulders bottom, which it is expected to break out of not far into 2018. This is a huge base pattern that can support major bullmarket. Points worth noting on this chart are the marked volume buildup during the last half of the year and the steady rise in volume indicators this year, especially the On-balance Volume line – these developments suggest that gold is building up to something, after being a sideshow during 2017 due to rising stockmarkets and the cryptocurrency mania. The key level to note is $1400 – a breakout above this level will signify that gold is leaving behind the base pattern to enter a new bullmarket phase.

The 30-month chart enables us to see in detail the period from the low of the base pattern late in 2015. Following this low, which was the low point of the Head of the Head-and-Shoulders bottom, the gold price rallied quite steeply, which coincided with a spectacular rally in Precious Metals stocks, but then dropped back to mark out the Right Shoulder low in December of last year, almost exactly a year after marking out the low of the Head of the pattern. Since that low gold has advanced in a rather sedate manner this year as it gradually readies to break out of the entire base pattern. At this point the trend is best described as neutral and it will remain so until it breaks above $1400, although that is not a reason not to buy it at opportune times, since we can be pretty sure that a breakout is looming.
On the 6-month chart we can see recent action in detail. The breach of support in the $1260’s and drop below the 200-day moving average early this month seems to have freaked out a lot of traders, who overreacted by rushing to dump long positions. After this drop the gold price has recovered over the past week or two, and has now risen into a zone of resistance.
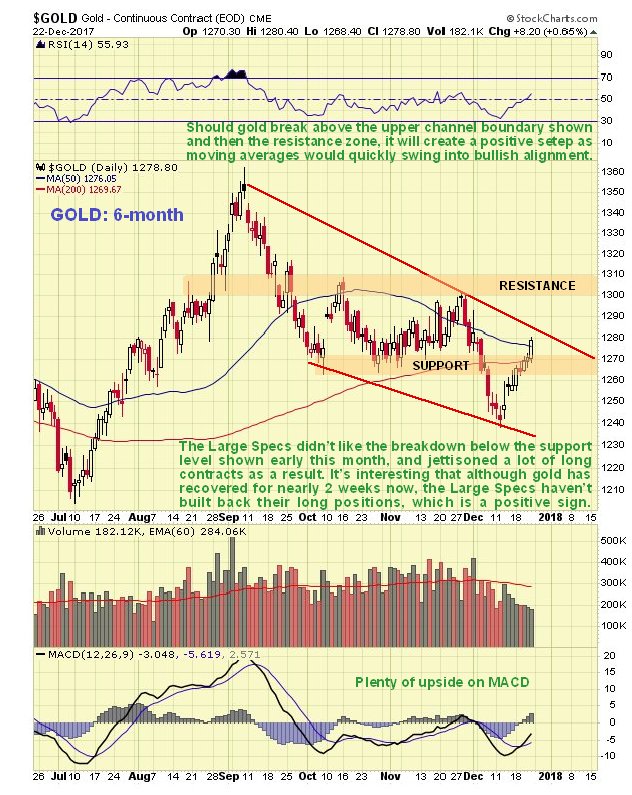
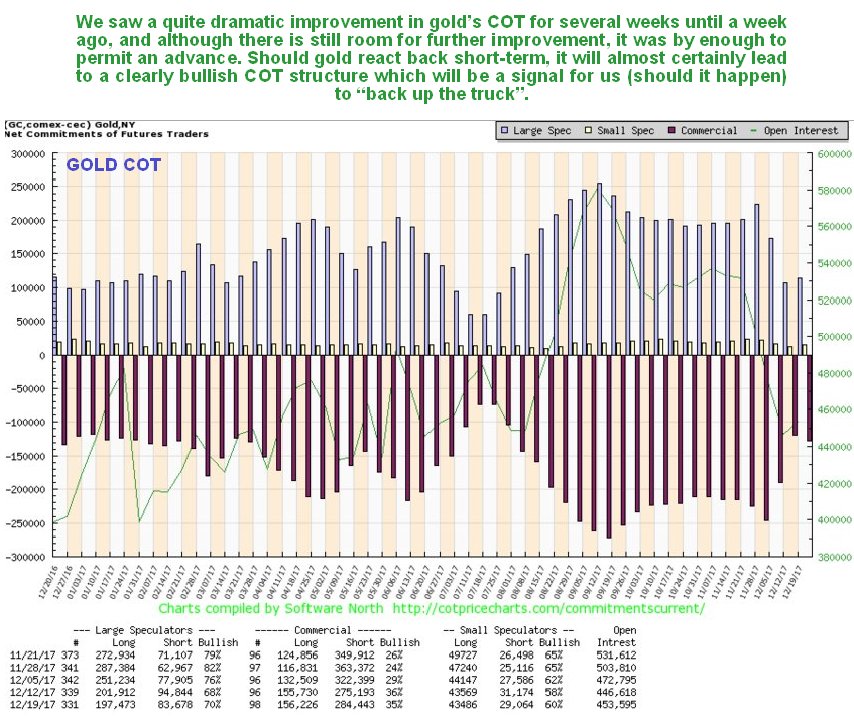
We have been wary of the Precious Metals sector for many weeks because of the persistent high Large Spec long positions, as we can see on the latest COT chart below, but this last drop by gold unnerved the Large Specs, who dumped a sizeable portion of their long positions, which action has improved gold’s COT structure considerably, although there is room for further improvement. The situation in silver was rather different, because the Large Specs bailed out of almost all their long positions, creating a flat out bullish COT structure for silver now. Overall, we would have to say that the COT structure for gold is now modestly bullish, with the chances of gold holding up or advancing further improved by the positive outlook for silver.
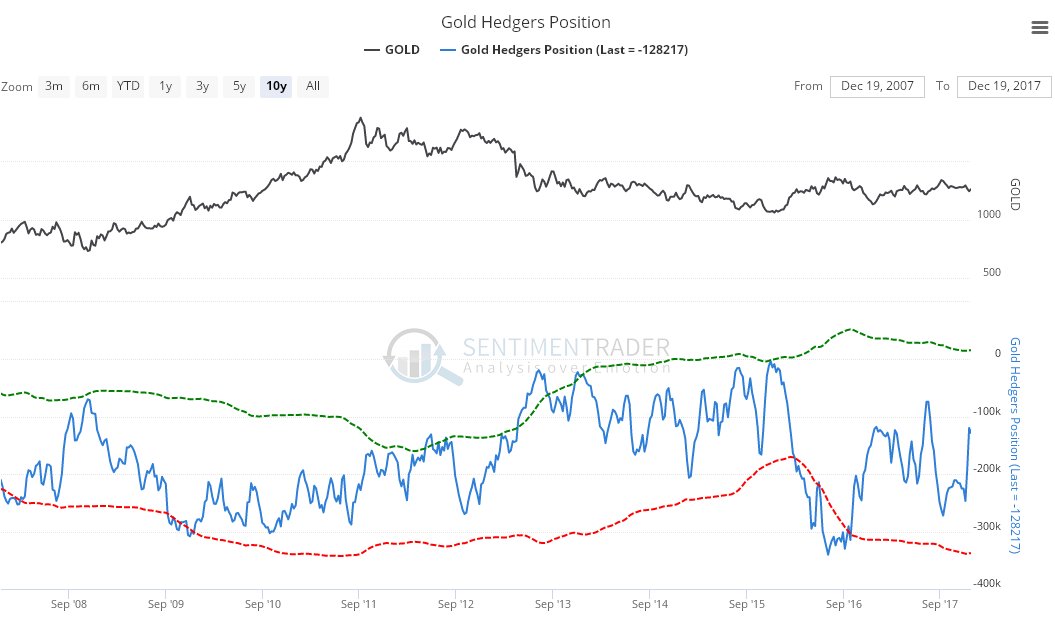
Click on chart to popup a larger clearer version. The latest gold Hedgers chart shows Hedgers positions to be squarely in neutral territory, and this chart thus provides no guidance one way or the other…
Click on chart to popup a larger clearer version. Chart courtesy of sentimentrader.comThe following chart shows that seasonal factors are quite bullish for gold in January, after being rather negative in December…
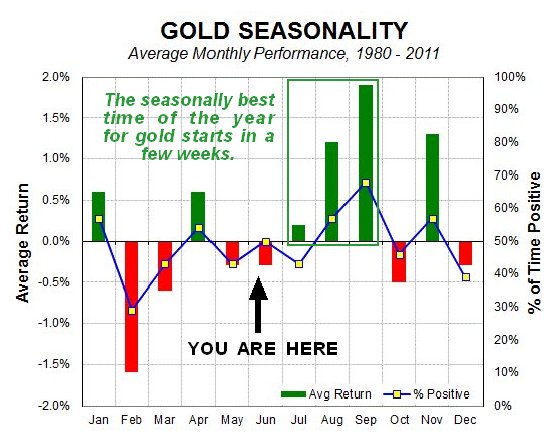
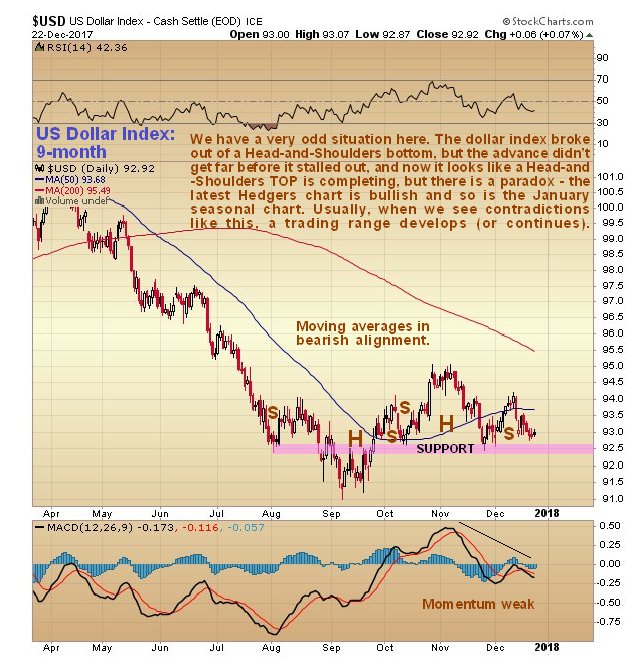
Chart courtesy of sentimentrader.comAs ever, when considering the outlook for gold, we have to factor in the likely impact of dollar movements, so how does the dollar look? The 9-month chart for the dollar index presents a rather ambiguous picture. We did get a dollar rally between September and November as we were expecting, but it didn’t get as far as we thought it would before it turned down again, and what looked like a Head-and-Shoulders bottom from August through October morphed into an apparent Head-and-Shoulders top from October through December, and with momentum weak and moving averages in bearish alignment, the dollar increasingly looks sets to break lower on this chart.
However, there are two opposing factors on the other side of the scales that we must weigh against the bearish looking dollar index chart. One is the latest dollar Hedgers chart, which shows that Hedgers’ positions are at levels that have in the past led to rallies…
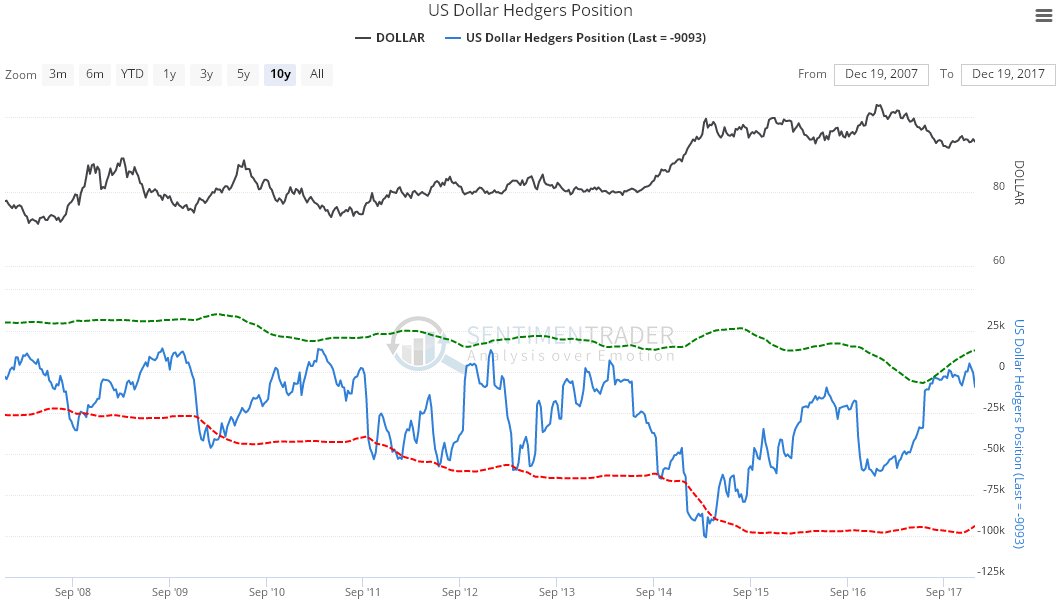
Click on chart to popup a larger clearer version. Chart courtesy of sentimentrader.comAnd in addition the dollar is about to enter its most seasonally bullish month of the year, although it must be emphasized that this is a background factor…
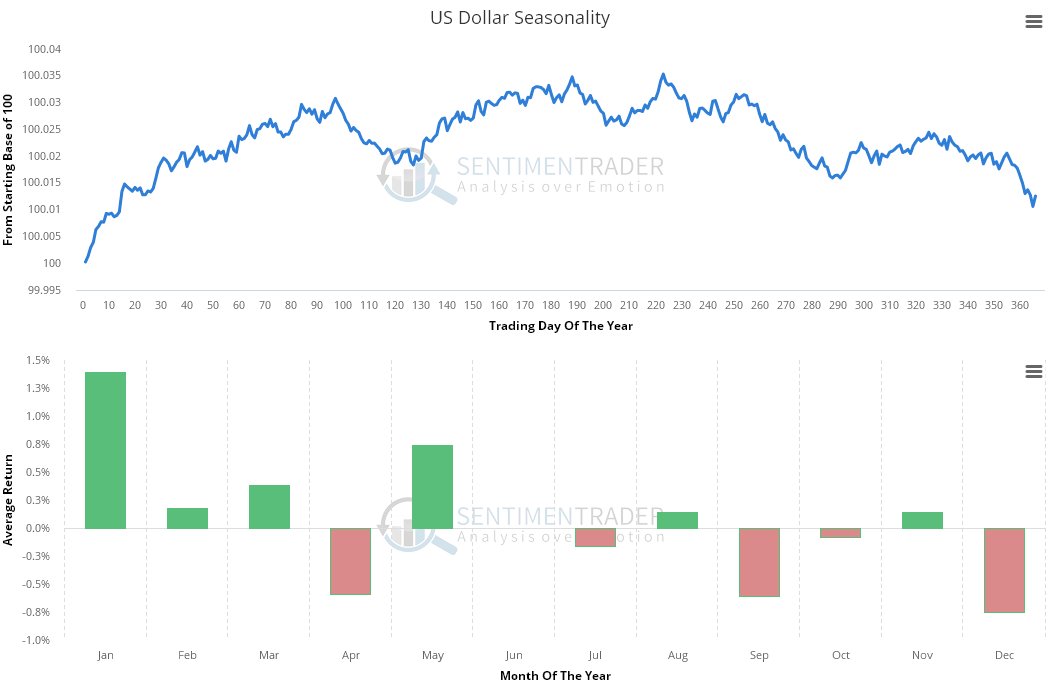
Chart courtesy of sentimentrader.comThis is a difficult set of opposing factors to weigh up, but experience shows that when one has a set of conflicting indications like this, it usually leads to rangebound behavior, until the conflicting factors resolve and the picture becomes clearer.
The conclusion to all this is that gold is building up to breaking out of its giant Head-and-Shoulders bottom to enter a major bullmarket phase, the start of which will be marked by gold breaking above $1400. In the meantime, before this breakout occurs, we can expect to see more erratic rangebound sideways trading behavior, with dips providing the opportunity to accumulate gold and especially undervalued PM stocks, since the risk of a more serious decline is considered to be very low.


Another Tool in the Toolbox!
Charts are fascinating! They reflect human action. We look at charts for direction, for support and resistance. Here is a chart (courtesy Stockcharts.com) that is just now in the process of showing a buy signal for gold mining stocks.

Featured is $BPGDM. This index rises or falls according to the bullish percentage among the stocks that make up the index. At the top we have inserted GDX, the miners ETF. In the past, whenever $BPGDM rose up from below 25 it gave a buy signal for mining stocks. Notice how the blue arrows point to excellent timing. The supporting indicators at the bottom (CCI and Slow Sto) have just turned positive, to provide confirmation.
Peter Degraaf is an investor with over 50 years of experience. Google him or visit www.pdegraaf.com
Precious metals expert Michael Ballanger explains why he finds gold stocks “dirt cheap.”

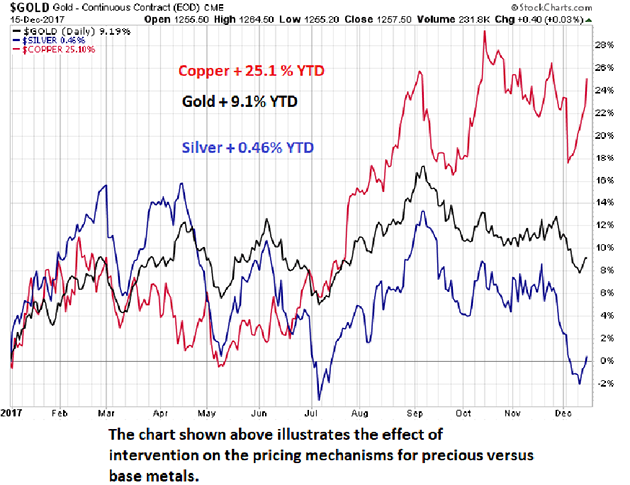
Here is a really good question. Anyone out there lose money trading gold and silver or related mining shares in the past couple of months? I did. My friends did. The bulk of the managed money (hedge fund) players did. However, it’s all “JUST FINE” because the Dow and the S&P hit all-time highs again as the last vestiges of the post-2008-GFC rescue reflation is now SURGING into paper assets. More importantly, those bullion bank millennials that were hired by their uncles and fathers and grandfathers in the banking business with EXPRESS INSTRUCTIONS to contain and control precious metals have now been given leave to TAKE PROFITS. Parties will be attended; frivolity and joy will be experienced; and massive bonuses will be paid. And the prices of gold and silver reside at levels representing 9.1% and 0.46% returns, year-to-date, versus 28.86% for the NASDAQ and 1,761% for Bitcoin. Is it any wonder why this new generation of investors ignores the precious metals complex like the bubonic plague?
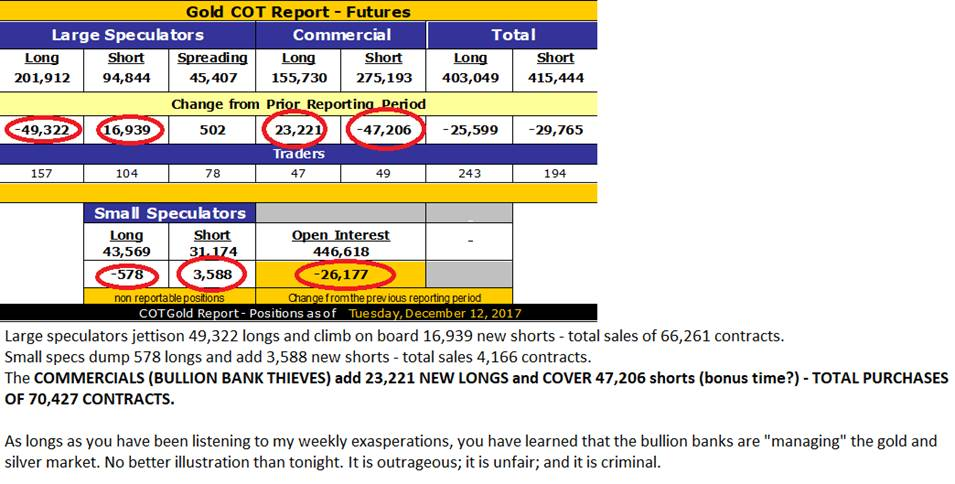
Friday’s COT report (as predicted) sent waves of revulsion through every nook and cranny of this portly countenance while sending my beloved canine howling into the upper regions of the house, certain beyond all doubt that wine bottles, coffee mugs, computer monitors, and the like were destined for flight paths not unlike the space shuttle on a clear day. The inappropriate and inordinately loud string of profanities and other rage-ridden invectives came as a result of the revelation of a massive reduction in the aggregate short position in gold and silver futures held by Commercial traders, otherwise known as bullion banks. As maddening as it was, it confirmed that greed rules the waves of highly motivated behaviors that exist today in the financial markets.
I opined at the end of November that “Bullion bank short covering will become year-end profit-taking” and received confirmation last Friday when they covered the equivalent of over 5.6 million “ounces” and it set a floor for pricing as it closed with its first weekly gain in the past four and only the third up week in the last twelve. The good (and possibly GREAT) news came Friday afternoon with a 70,427-contract swing comprised of new long and covered short positions and one of the top five Commercial purchase COT weeks in history. This is a classic repeat of the lows seen in early December of 2015 and while not as extreme in terms of the aggregate short position, the size of the drawdown was breathtaking and bullish for the near-term outlook. But then again, that was the analysis I gave in late November and again last week and continue to believe that the gold miners are dirt cheap here and certainly less stretched than the valuations virtually everywhere else. There are no champagne flutes tinkling at the gold miner parties this year; it has been a “beer and pretzels” year and not a great deal of fun.
There is an expression that has stayed with me since my early days as a commodities broker that came as a quote from a book I read highlighting stories from the soybean trading pit at the Chicago Board of Trade where the legendary Richard Dennis ruled the roost. “When they’re yellin’, ya should be “sellin’ and when they’re cryin;, ya shud be buyin’!!!” was the nuts and bolts of the phrase as it clearly defined one critical rule for trading against human emotion.
And, yes, there was indeed a time when one could utilize human fear and greed as a trading tool but that went the way of the dodo bird when the bankers decided to allow computers to manage markets and set prices arbitrarily by digital committee. The elitists that are now in control of the programmers and software engineers are, however, in full grasp and grapple of what is needed to keep the throngs at bay and avoid the storming of the banker Bastille complete with pitchforks and torches. They need rising paper markets! Whether it is Bowie Bonds or cryptocurrencies or blue-chip stocks or social media, give the legions of terminally indebted university grads the hope of enrichment and credit-relief by way of ANYTHING that can be bought, sold, traded or shorted, as long as it creates “flow” upon which the bankers can slice off their piece of flesh. Global “growth” is now 100%-dependent upon the financial economy with production of literally everything the responsibility of either robots or slave minimum-wage labor located in Third World sweatshops and Emerging Market warehouses. And this peculiarity is eventually going to rise up and bite the elitist price managers squarely on the backside.
Here in Canada, the Toronto housing bubble has made geniuses out of morons and millionaires out of part-time, construction-site laborers (not that there is anything wrong with work of that ilk) but you get my point. It has turned the city into an elitist stronghold and Asian mecca (again, nothing wrong with meccas or strongholds) but gone forever is the distinctive ethnic influence of the Irish, English, and Scottish ancestry that founded the city and morbidly diluted is the dominant influence of the Italians that built it later into the massive megalopolis that it has become. The Chinese money gorging on Toronto property is not just the result of “easy money” lending policies back home but more so “easily-printed-out-of-thin-air-money” that has been the national policy instrument allowing the migration of hundreds of thousands of cashed-up immigrants into the Canadian market place. The result has been infinitely unfair advantages for the holders of the Chinese shadow banking paper that gets easily converted to loonies and toonies and winds up in the hands of former residents of WASPy neighborhoods such as Rosedale and Forest Hill.
Now that speculators around the world have moved way beyond “yellin'” to the fever pitch of high-pitched, megaphone-assisted “howlin'”, the contrarian clarion call for equal and opposite reactions otherwise known as “sellin'”is long overdue. Similarly, the “cryin'” in the gold and silver pits and in the boardrooms of the junior exploration companies has been amplified to sound like Jerusalem’s Wailing Wall on a particularly bad day. Accordingly, the Senior (GDX/NUGT) and Junior (GDXJ/JNUG) gold miner ETFs are the items I will be “buyin'” as a suitable response to all that “cryin'”.
So, enjoy the rest of the month as we all race around completing our lists, emptying our bank accounts, and doing what we can to celebrate whatever it is we are supposed to be celebrating, be it religious or monetary or familial. I intend to curl up in my favorite recliner with a good book and a fine Chianti while sufficiently self-medicated to keep Fido calm and comfortable. Meanwhile, my significant other monitors gold and silver prices on an hourly basis, clad in her battle fatigues, her army-surplus flack jacket, mace canister, and emergency fog horn for that ominous moment where I descend into a calamitous state of unbridled rage. Based on the recent actions of the bullion bank behemoths, all should be well and good at least into late next month, after which we shall see.
Next update will be the 2018 Forecast Issue where I try to avoid total embarrassment. Minor embarrassment would be a bonus; accuracy would be heaven.
Originally trained during the inflationary 1970s, Michael Ballanger is a graduate of Saint Louis University where he earned a Bachelor of Science in finance and a Bachelor of Art in marketing before completing post-graduate work at the Wharton School of Finance. With more than 30 years of experience as a junior mining and exploration specialist, as well as a solid background in corporate finance, Ballanger’s adherence to the concept of “Hard Assets” allows him to focus the practice on selecting opportunities in the global resource sector with emphasis on the precious metals exploration and development sector. Ballanger takes great pleasure in visiting mineral properties around the globe in the never-ending hunt for early-stage opportunities.
Disclosure:
1) Michael J. Ballanger: I, or members of my immediate household or family, own shares of the following companies mentioned in this article: Stakeholder Gold Corporation. I personally am, or members of my immediate household or family are, paid by the following companies mentioned in this article: None. My company has a financial relationship with the following companies referred to in this article: Stakeholder Gold Corporation. I determined which companies would be included in this article based on my research and understanding of the sector. Additional disclosures are below.
2) The following companies mentioned in this article are billboard sponsors of Streetwise Reports: None. Streetwise Reports does not accept stock in exchange for its services. Click here for important disclosures about sponsor fees. The information provided above is for informational purposes only and is not a recommendation to buy or sell any security.
3) Statements and opinions expressed are the opinions of the author and not of Streetwise Reports or its officers. The author is wholly responsible for the validity of the statements. The author was not paid by Streetwise Reports for this article. Streetwise Reports was not paid by the author to publish or syndicate this article.
4) This article does not constitute investment advice. Each reader is encouraged to consult with his or her individual financial professional and any action a reader takes as a result of information presented here is his or her own responsibility. By opening this page, each reader accepts and agrees to Streetwise Reports’ terms of use and full legal disclaimer. This article is not a solicitation for investment. Streetwise Reports does not render general or specific investment advice and the information on Streetwise Reports should not be considered a recommendation to buy or sell any security. Streetwise Reports does not endorse or recommend the business, products, services or securities of any company mentioned on Streetwise Reports.
5) From time to time, Streetwise Reports LLC and its directors, officers, employees or members of their families, as well as persons interviewed for articles and interviews on the site, may have a long or short position in securities mentioned. Directors, officers, employees or members of their immediate families are prohibited from making purchases and/or sales of those securities in the open market or otherwise from the time of the interview or the decision to write an article, until one week after the publication of the interview or article. As of the date of this article, officers and/or employees of Streetwise Reports LLC (including members of their household) own securities of Stakeholder Gold, a company mentioned in this article.
All charts and images courtesy of Michael Ballanger.
Michael Ballanger Disclaimer:
This letter makes no guarantee or warranty on the accuracy or completeness of the data provided. Nothing contained herein is intended or shall be deemed to be investment advice, implied or otherwise. This letter represents my views and replicates trades that I am making but nothing more than that. Always consult your registered advisor to assist you with your investments. I accept no liability for any loss arising from the use of the data contained on this letter. Options and junior mining stocks contain a high level of risk that may result in the loss of part or all invested capital and therefore are suitable for experienced and professional investors and traders only. One should be familiar with the risks involved in junior mining and options trading and we recommend consulting a financial adviser if you feel you do not understand the risks involved.

Dec 19, 2017
- Are government, central banks, and fiat money the three biggest bubbles in the history of the world? I would suggest they are.
- The rise of private money (bitcoin) combined with the rise of China and India as economic empires is popping these bubbles. Against bitcoin, fiat is now burning like an out of control wildfire.
- Within a year or two, it could begin disintegrating against gold in a somewhat similar manner. Whether that happens or not depends on whether a blockchain currency backed with gold gets widely accepted in the blockchain community. I predict that it likely happens.
- Simply put, fiat is a barbaric relic and the younger generation isn’t interested in relics. There are almost three billion citizens in China and India. Many of them are obsessed with gold, and almost all of them respect it as the ultimate asset.
- There are about 600 million Indian citizens under the age of 35. They are now getting a taste of private money with bitcoin, and they like it! Blockchain is newer than fiat. It’s technologically superior. Fiat is like a rotary phone, and millennials want to trade up for the newest Iphone. In the currency world, that’s blockchain!
- Many analysts have noted the strong seasonal tendency for gold to rise from late December or early January until mid-February.
- To understand why that happens, please click here now. About 65% of all gold demand comes from China and India, and that demand increases exponentially with income growth. Incomes are growing, so Chinese New Year gold price rallies are intensifying.
- The rally begins as Chinese New Year buying begins. It ends when that buying ends, which is in mid-February for 2018.
- Note that China’s businesses (including gold shops) close for a week as the celebrations end. Commercial traders on the COMEX tend to buy long positions in gold ahead of Chinese New Year (now), and then short it as the demand begins to peak.
- A huge number of savvy Indian investors will also buy gold ahead of Chinese New Year to get in on the action. The price premium in India tends to rise as that happens.
- It’s risen to above 12% in the past few weeks.
- Please click here now. Double-click to enlarge this daily gold chart. Chinese New Year celebratory buying should see the price easily reach my $1310 area target.
- The bull wedge pattern looks fabulous. The current $1265 area supply zone is likely just a short term pitstop on the way to prices well above $1300 by mid-February.
- Top analysts at Goldman Sachs are predicting a rise in Indian GDP growth to 8% for 2018. That should be occurring as the Indian gold market restructuring gets completed. In India, as incomes grow, gold demand increases even more exponentially than it does in China.
- I’ve talked about the importance of getting more global rate hikes to boost inflation and commodity prices in the late stage of the business cycle. Gold stocks can’t really perform well relative to bullion if that doesn’t happen.
- On that note, please click here now. Goldman analysts clearly agree with my take on the situation for 2018, and a lot of powerful institutional money managers rely on Goldman’s analysis.
- It should be a great year for commodities in 2018. As the commodities rally, I’m predicting that new ICOs (initial blockchain coin offerings) will occur, featuring coins that are linked to various commodities.
- If this happens, it could add intensity to the general commodity price rally.
- Please click here now. All investor eyes should be on key 200 number for the CRB commodity index. There’s a base pattern in play, and a move above 200 would be a major breakout.
- This base pattern is in sync with the fundamentals. There was a big move higher during the late stages of the last business cycle in 2008. That was a speculative move and OTC derivative bets were rampant.
- This move higher in commodities should be steadier and continue for a long time. Twenty years of deflation have ended, and a long term upcycle for inflation is beginning.
- Please click here now. Double-click to enlarge this solid looking GDX chart. GDX should be able to reach my $25 – $26 short term target zone by mid-February.
- Note the nice inverse head and shoulders bottom pattern in play, with the head forming in a big support area near $21.
- More importantly, I expect that as the CRB index moves towards 240 – 280, that should trigger enough inflation-oriented institutional buying of gold stocks to send GDX into my medium term $31 – $37 target area. Are all gold bugs taking their seats on the inflationary train? I hope so, because it’s pulling out of the station very soon. All aboard!
Thanks!
Cheers
st
Dec 19, 2017
Stewart Thomson
Graceland Updates
website: www.gracelandupdates.com

-
I know Mike is a very solid investor and respect his opinions very much. So if he says pay attention to this or that - I will.
~ Dale G.
-
I've started managing my own investments so view Michael's site as a one-stop shop from which to get information and perspectives.
~ Dave E.
-
Michael offers easy reading, honest, common sense information that anyone can use in a practical manner.
~ der_al.
-
A sane voice in a scrambled investment world.
~ Ed R.
Inside Edge Pro Contributors

Greg Weldon

Josef Schachter

Tyler Bollhorn

Ryan Irvine

Paul Beattie

Martin Straith

Patrick Ceresna

Mark Leibovit

James Thorne

Victor Adair