Posted by Gary Tanashian - NFTRH
on
Monday, 18 December 2017 13:29
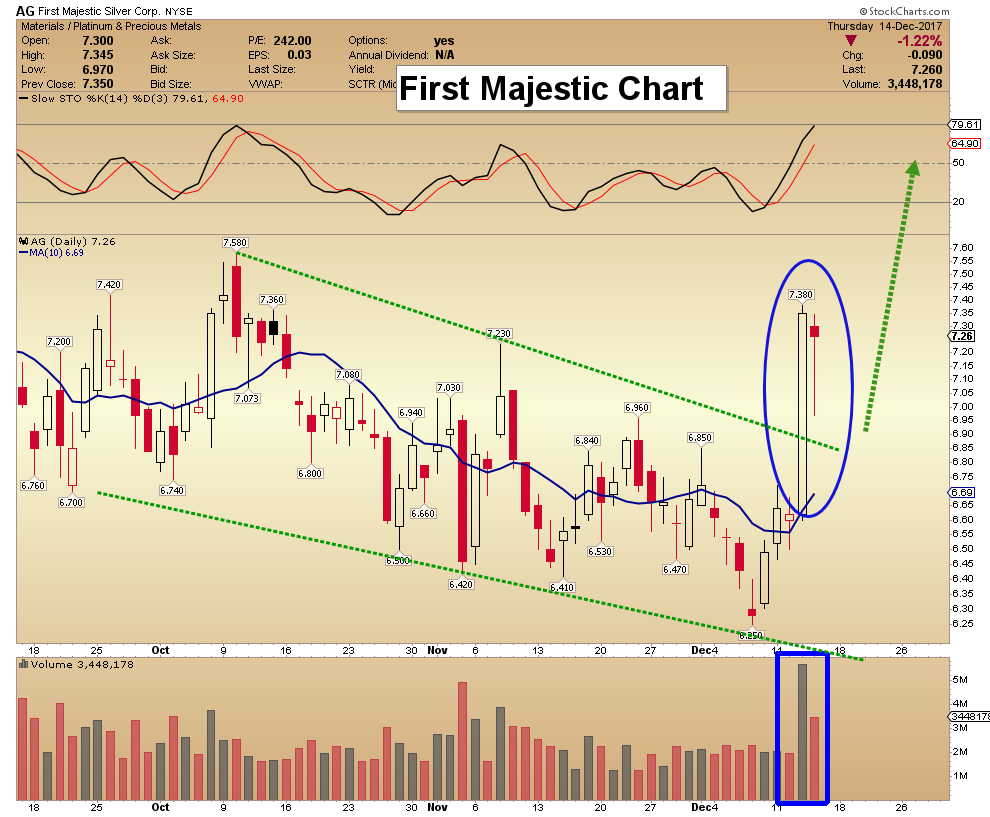
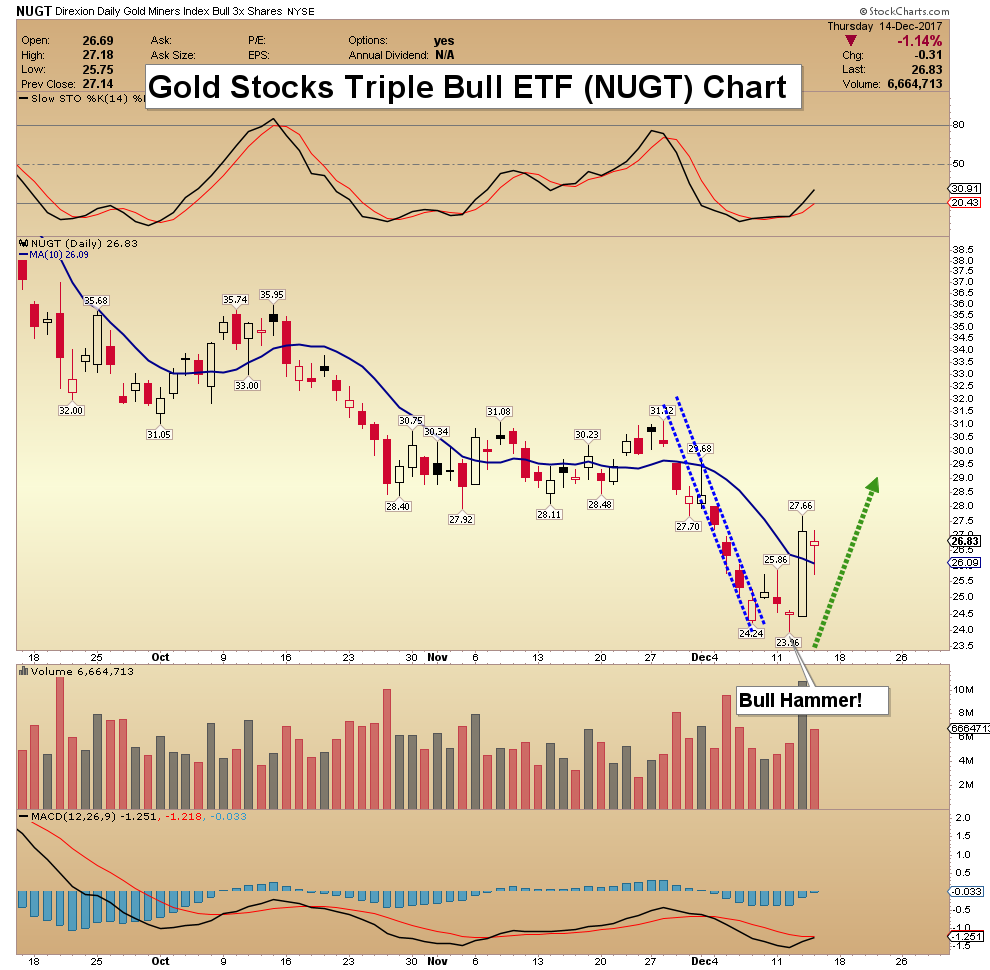
For the last couple of weeks we have been tracking improving gold and silver Commitments of Traders (CoT) data, noting that a seasonal low (on historical average) is in the offing and also ongoing tax loss selling as reasons to expect a bounce or even a significant rally in precious metals sector.
Last week the CoT played ball as it slammed to a bullish alignment in both metals. This was especially so in silver, which is the metal that would lead a sector rally. We saw significant Commercial short covering and large Speculative long capitulation in silver.
For a more dramatic look at the quick snapback to a bullish orientation in the would-be leader, let’s use this graphic from snalaska.com:

….for more analysis and charts go HERE
Posted by Morris Hubbartt - Super Force Signals
on
Friday, 15 December 2017 13:29
Dec 12, 2017
- Please click here now. I’ve predicted that a long period of deflation in the Western world would end with a Fed taper, rate hikes and quantitative tightening.
- That’s clearly in play now, and the deregulation of America’s thousands of small banks is perhaps the most exciting event taking place on this new “inflationary frontier”. Because of these powerful monetary trends, I’ve predicted big problems ahead for Wall Street and somewhat better times for Main Street.
- Having said, that, I think investors would be making a major mistake to assume America is going to experience any kind of fabulous rebirth and relive an economic growth era like the 1950s, let alone the Golden Age of the 1880s.
- The country now sports some of the worst demographics on the planet with horrific debt levels that are still growing under a president who is a spectacularly successful businessman.
- What happens when President Businessman is replaced with President Socialist? Some sort of currency revaluation endgame is what happens. The problems of America and most of the Western world are not going to be solved with pump-up speeches, sporadic tax cuts, and insane “good guys versus bad guys” wars.
- American GDP growth is going to continue to wallow at low levels while China and India blast into what I call the “bull era” at very high velocity.
- Global investors need to make themselves great, and the blockchain/crypto asset class is one way to do it with style. I view blockchain as a sub-sector of the gold asset class. Importantly, blockchain trading is set to become more regulated very quickly.
- Promoting regulation that doesn’t interfere with a market’s price discovery process appears to be a key goal of the Trump administration. It looks like new bitcoin regulation will be focused mainly on specific criminal schemes. That won’t stop the great upside price action taking place now on the legitimate exchanges.
- Institutional-grade trading of the cryptos is already beginning to happen, as demonstrated with the superb launch of fully regulated bitcoin futures on Sunday night.
- The launch proved that institutional money managers view the $16,000 price area as solid.
- My long term price target is two million US dollars per bitcoin. At www.gublockchain.com I analyse the main cryptos that are ready for serious upside action. A week ago, I highlighted key currency Litecoin at $100 for the gold community, issued a $1200 target, and showed potential subscribers a solid-looking chart.
- To view that chart, please click here now. Double-click to enlarge. To view the updated price action since then, please click here now. Double-click to enlarge.
- Even after this mighty blast higher, the $250 area for Litecoin should probably not be viewed as anything but a minor pitstop on a rocket ride to $1200.
- I’ll be highlighting what could be the “next Litecoin” for profit-hungry blockchain subscribers today. It’s critical for investors and freedom fighters to understand that in the big picture, both gold and bitcoin will remain investments that only create huge fiat money profits… until they are widely used in daily life for payment of regular goods and services.
- Then they can begin to compete with fiat money as the money of choice for citizens in a very serious way. I’ve predicted that this will happen because of the ability of blockchain technology to create digital gold-backed currency. That currency can be kept in a regulated and insured account, like a bank account.
- Debit and credit cards based on these accounts are coming, and when that happens I’ll dare to suggest that Mr. and Mrs. Fiat are going to start feeling very uncomfortable. If these blockchain payment systems go mainstream, government could soon find itself becoming obsolete in many ways.
- I predict that central banks will begin buying bitcoin as an asset to hold once it hits $2 trillion in “market cap”.
- The US Treasury should have initiated a bitcoin buy program years ago to help fix the government’s balance sheet. Instead it wasted precious time playing stock market cheerleader, government bond enthusiast, and ruined the bank account income of ageing citizens. That was a truly horrific mistake, one that all the citizens of the world can only hope never happens again.
- Please click here now. Double-click to enlarge this superb daily gold chart. Gold has a rough general tendency to rally after the US jobs report, unless a Fed rate hike is upcoming. In that case, gold often stagnates until the rate hike is announced, and then surges higher.
- The Fed is scheduled to hike rates tomorrow, and gold is now poised magnificently inside a bull wedge, ready to stage a mighty blast higher if a hike is announced tomorrow.
- Also, Chinese New Year buying will begin very soon. That tends to bring enormous demand from not only Chinese citizens, but also from gold-obsessed Indians who want to get in on the action. The combined population of these two countries is about three billion people. Please click here now. Goldman analysts just released a key study of gold and blockchain liquidity flows. I’ll take it a step further, and state adamantly that blockchain will increase demand for gold. Indian investors will seek to put a portion of their huge blockchain profits into physical gold because they are essentially mandated to do so by their Hindu religion.Western investors will do the same thing when the stock market finally rolls over. If gold-backed blockchain currency goes mainstream, demand for gold would increase even more significantly, and do so in a sustained way. I think it will happen.
- Regardless of whether it happens or not, when Chindians get serious about buying gold, the most powerful traders in the West also quickly position themselves to profit from the inevitable upside price action. On that note, please click here now. Next, please click here now. The powerful commercial traders have covered huge amounts of short positions and are eagerly racing to buy longs.
- What’s particularly exciting about these two COT reports is that the reports only cover the flows through last Tuesday. It’s highly probably that the commercial traders have taken even bigger buy-side action with gold and silver since the reports came out.
- Please click here now. Double-click to enlarge this key GDX chart. I’ve outlined the $23 – $18 area as a vital buy zone for gold stock enthusiasts. Within that price area, the $21 and $18 price points are most technically significant. The tiny bear flag in play suggests that investors will get a chance to buy the $21 area before an imminent major gold price rally carries GDX much higher. Investors can join me in placing some larger buy orders at both price points now, to be sure we’re all poised to participate in the ensuing rally time fun!
Thanks!
Cheers
st
Dec 12, 2017
Stewart Thomson
Graceland Updates
website: www.gracelandupdates.com
Posted by Rambus Chartology
on
Monday, 11 December 2017 13:01
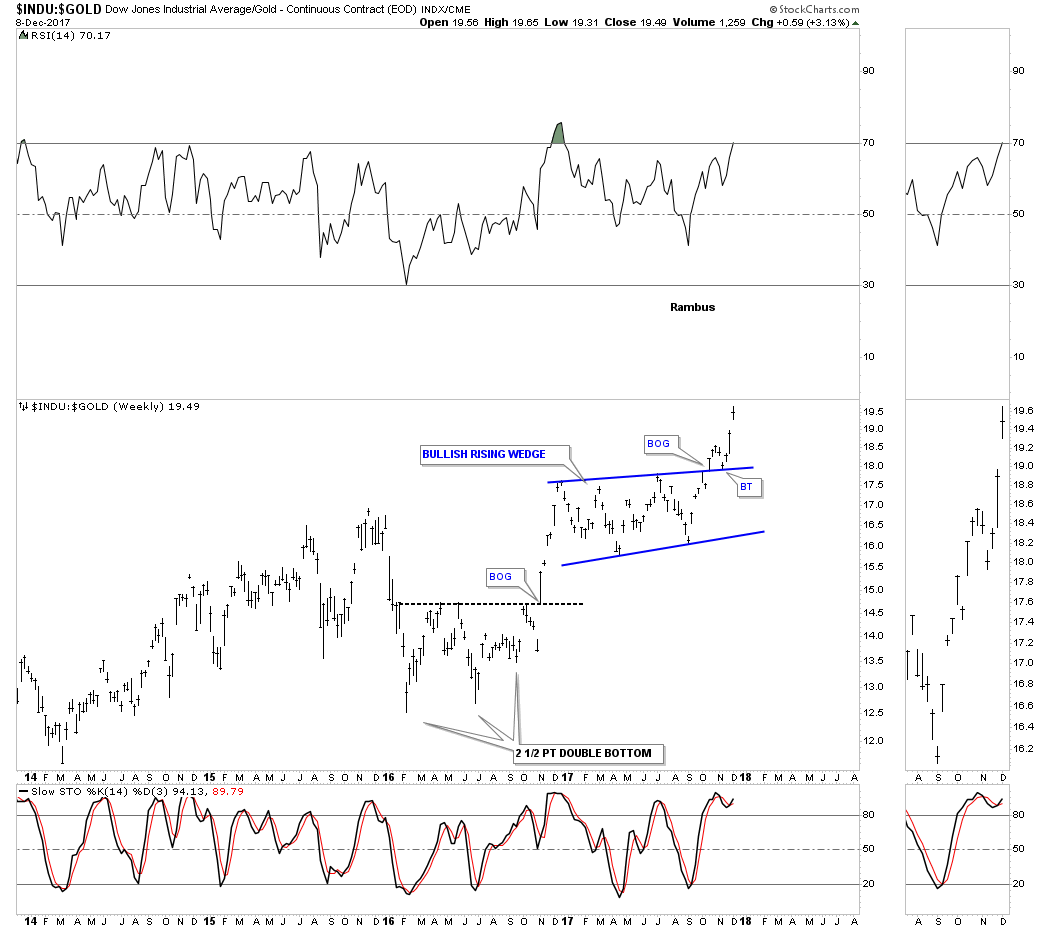
This next set of ratio charts I consider to be the most important ratio charts if you are deciding whether to be an investor in the INDU or in Gold.
When the price is rising The INDU ( Dow Jones Industrial Average ) (a proxy for General Stock Markets) is rising against Gold , and when it is falling Gold is rising against the Dow.
This first ratio chart for the INDU:Gold is a daily look which shows the ratio breaking out above the top rail of a bullish rising flag with a completed backtest. It doesn’t look that impressive on a daily chart, but when we look at the longer term ratio chart it becomes very important.

Below is a long term 10 year weekly chart which shows a massive H&S bottom on the ratio chart on top and a possible massive H&S top on gold on the bottom chart. Note how the blue bullish rising flag formed just below the neckline on the ratio chart which has given the ratio chart the energy it needed to finally breakout. I’ve been showing this ratio combo chart for a long time now so the breakout above the neckline is falling into place.
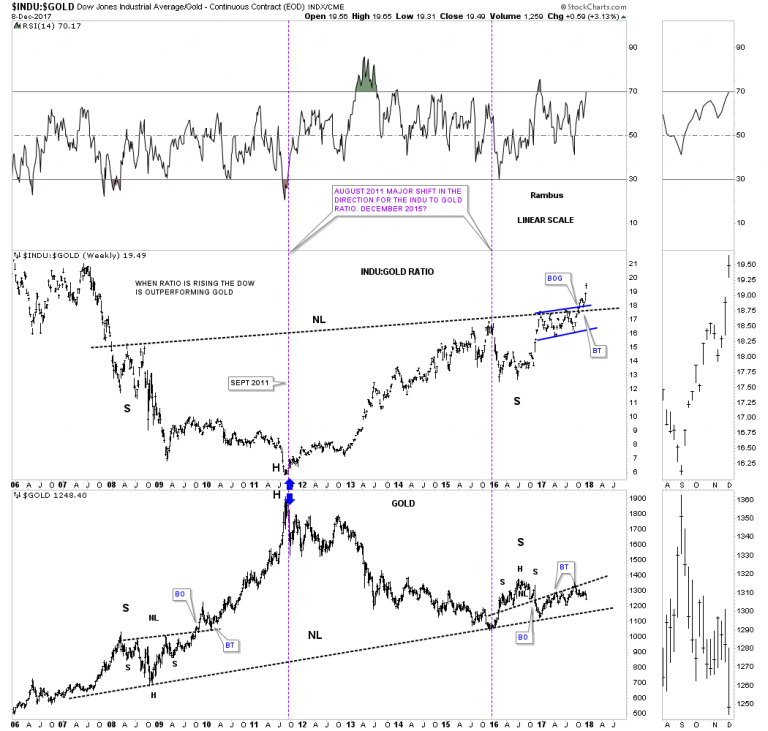
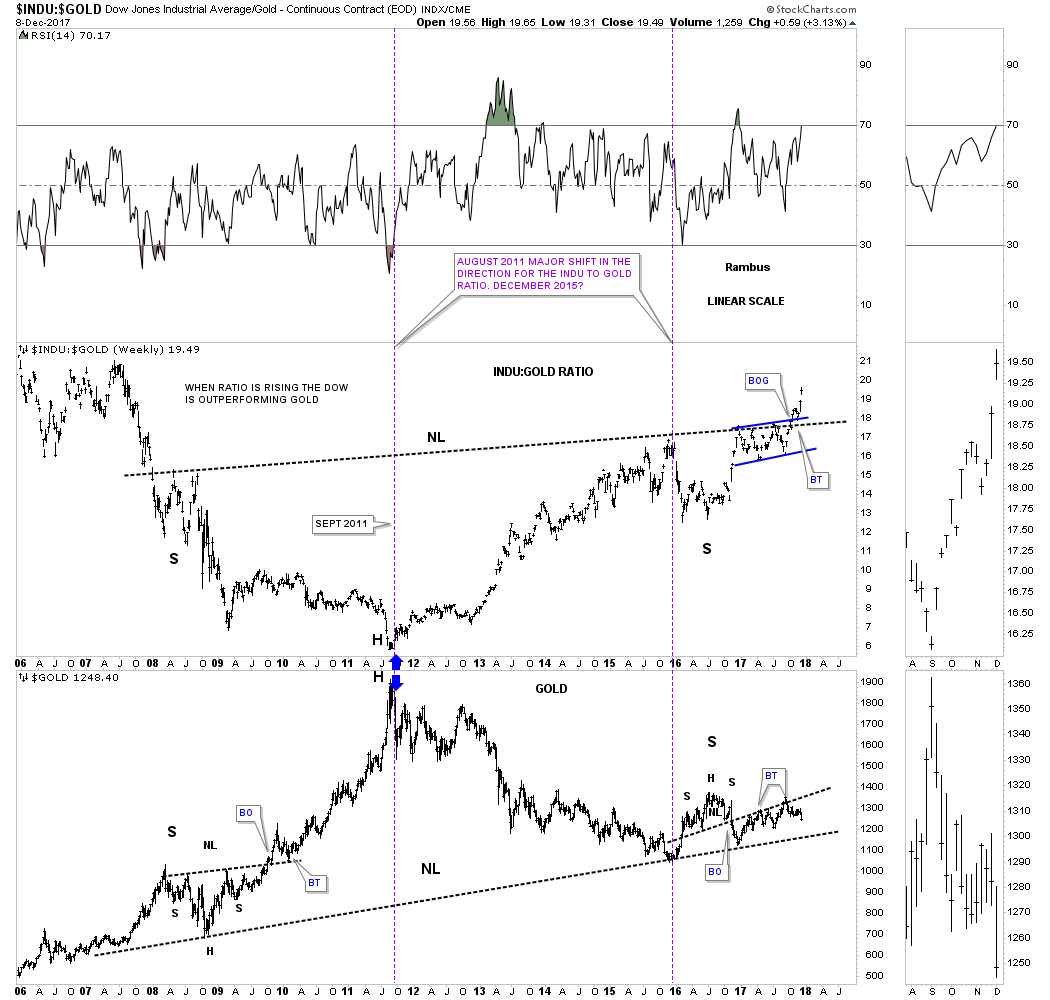
Below is a 38 year daily line chart for the INDU:gold ratio chart which puts the very big picture in perspective. This ratio chart tells you when you need to be trading in the INDU and out of Gold and visa versa. As you can see you wanted to be trading in the INDU going into the 2000 bubble top and out of gold. In 2000 that all changed. From that point forward you wanted to be trading in the PM sector staying away from the INDU.
There are many gold investors that swear that the ratio has to go as low a 1 to 1 before the gold bull market is over. As you can see the ratio got as low as 5.5 in 2011 which is close enough IMHO especially since the price action that followed that double bottom low. There is a massive H&S bottom with the breakout underway. We have a very clear line in the sand for the staunch gold bulls which is the neckline. As long as the price action trades above that neckline the INDU is going to outperform gold.
As the breakout is just now taking place this ratio could rise for many years to come regardless of all the reasons it can’t. I will have no problem reversing my stance if I see the neckline is broken to the downside, but until it is I have to give the ratio chart the benefit of a doubt. All the best…Rambus
https://rambus1.com/


