
Gold & Precious Metals
Today’s videos and charts (double click to enlarge):
SFS Key Charts & Video Update

SF60 Key Charts & Video Update

SF Juniors Key Charts & Video Analysis


SF Trader Time Key Charts & Video Analysis


Morris
| Friday, Dec 1st 2017 Super Force Signals Unique Introduction For 321Gold Readers: Send an email to trading@superforcesignals.com |

Every now and then we see some kind of anomaly on the precious metals market. Sometimes it’s particularly useful and sometimes it’s just something random. Yesterday was one of those days when something didn’t seem right. The USD Index rallied, silver declined, mining stocks declined and yet, gold closed the session higher. What can we infer from this uncommon event?
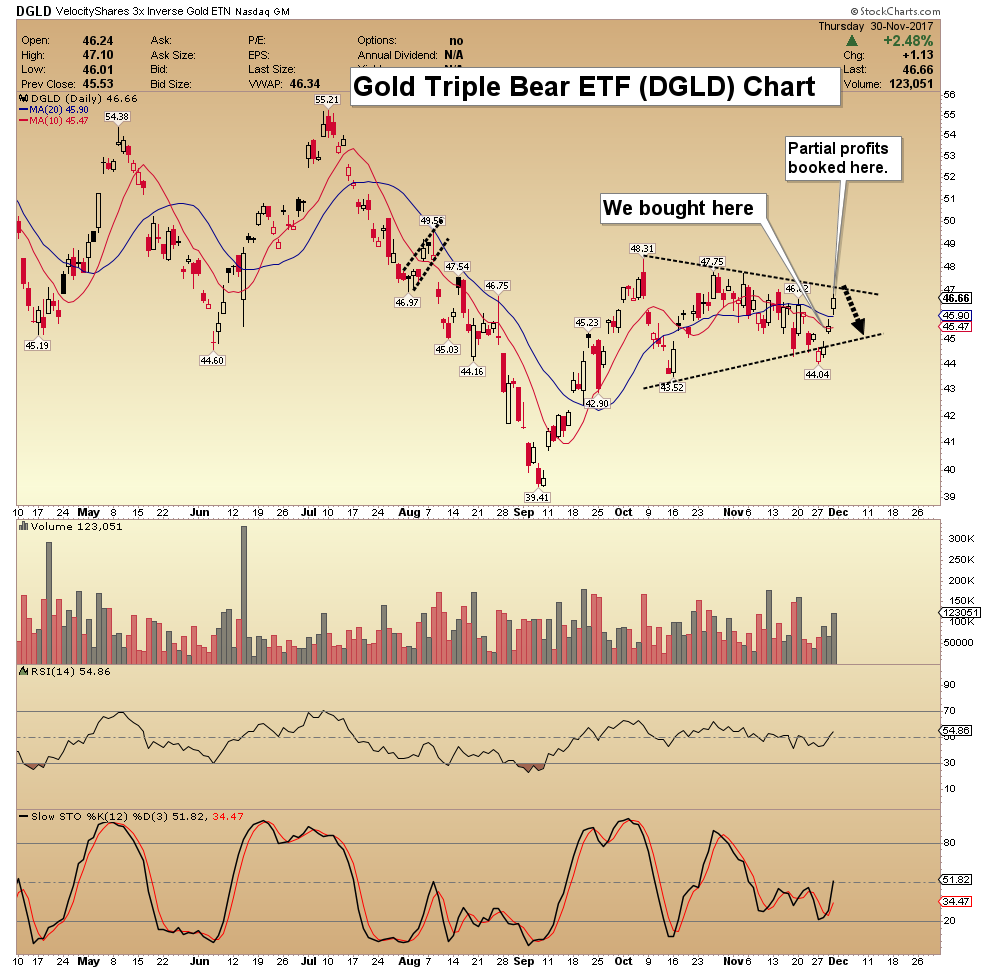
Unfortunately, not much. It was just one day when gold behaved in this way, so at this time we have no reasons to believe that gold’s one-metal rally was anything important. One thing that was visible in the gold market and that wasn’t visible in other parts of the precious metals market was gold’s breakoutabove the triangle pattern. Consequently, yesterday’s strength might have simply been a consequence of the breakout and we already described it yesterday. We wrote that we could see an upswing, but we don’t think it will be anything major, for instance a move to the October high. So, in a way, nothing changed, even though the relative moves during yesterday’s session might have raised many eyebrows.
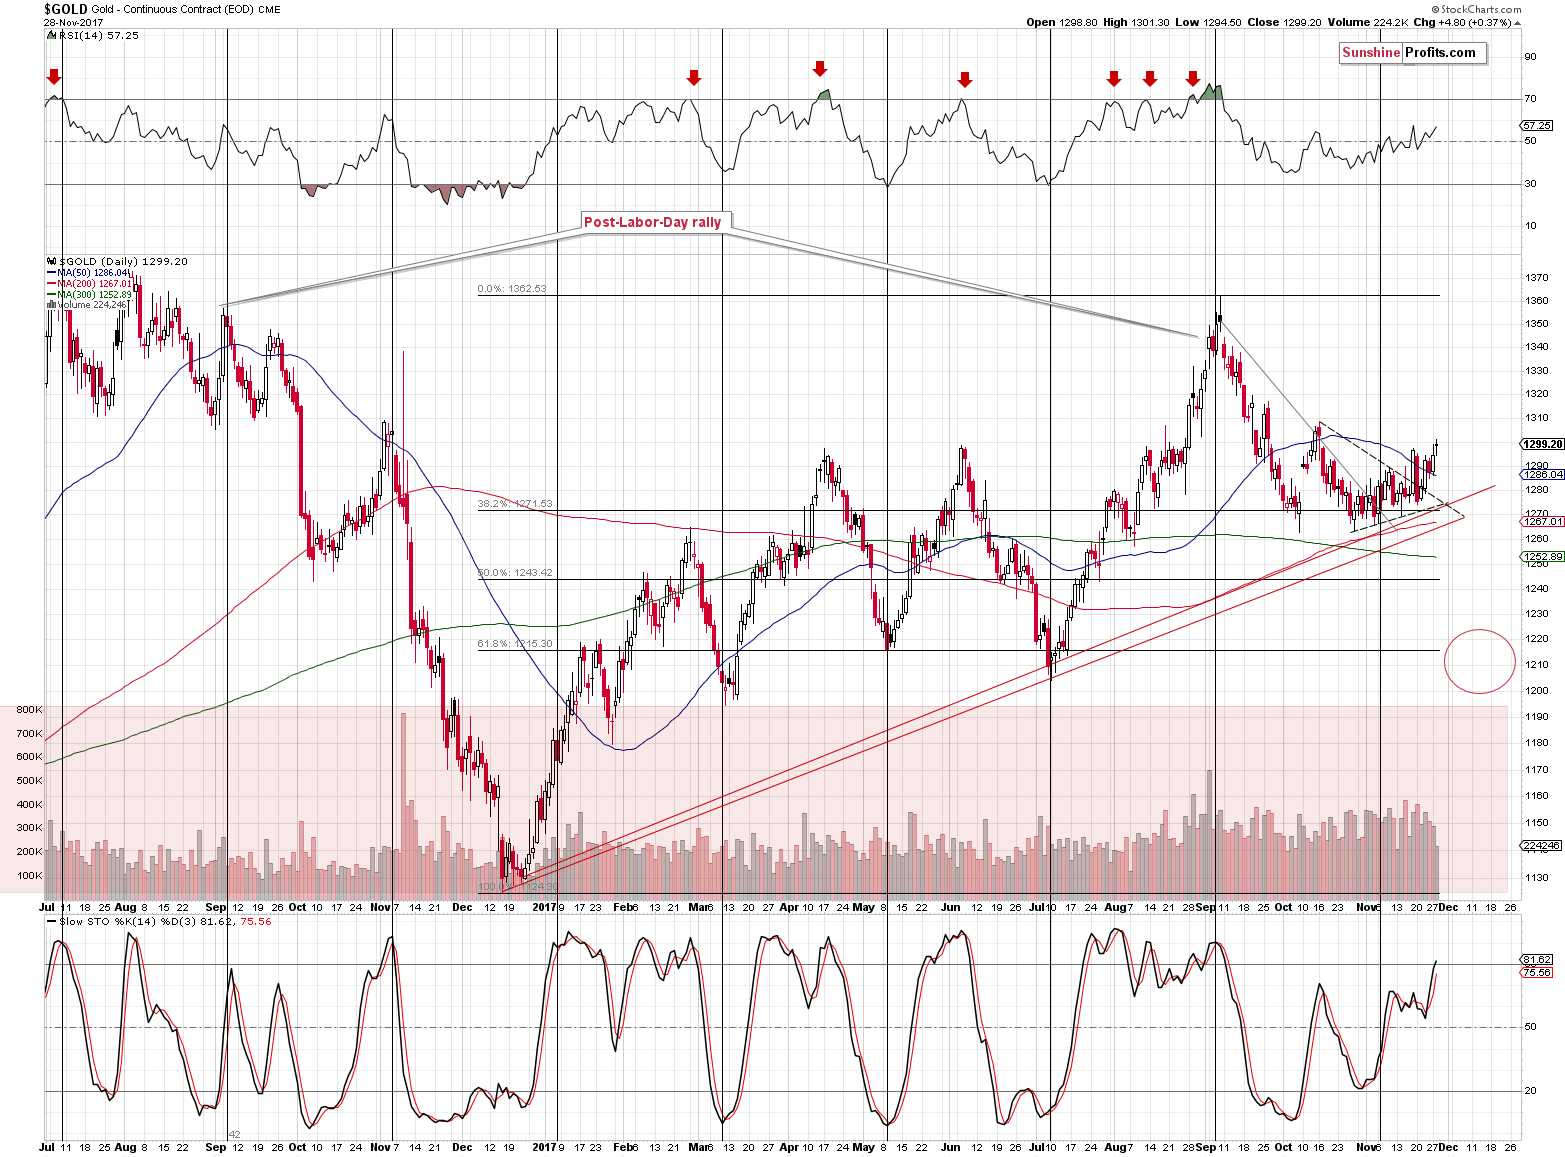
Let’s take a closer look at the gold chart for details (chart courtesy of http://stockcharts.com).
In yesterday’s alert, we wrote the following:
Gold moved higher on declining volume yesterday, but overall it continues to move back and forth below the $1,300 level. Its move above the 50-day moving average and then 2 closes above are somewhat similar to the October top. The Stochastic and RSI levels are similar as well. The above is a weak, but still, bearish sign. Even though Stochastic is at similar levels, we can see that the current reading is higher. In a way, even though the price of gold is lower, the above means that gold is closer to being overbought now, than it was in October.
On a bullish note, gold confirmed the breakout above the triangle pattern, which could result in a short-term rally. Still, we don’t expect the upswing to take gold much higher – the October high seems to be a likely target if gold’s rally continues. Again, that’s a big if, as based i.a. on the 61.8% Fibonacci retracement in the USD, the latter could rally immediately and gold could decline immediately as a result.
While Monday’s volume during the upswing was relatively low, the volume that we saw yesterday was very low. This, plus the fact that both silver and mining stocks declined, suggests that gold’s rally was most likely accidental – not an indication of a looming rally.
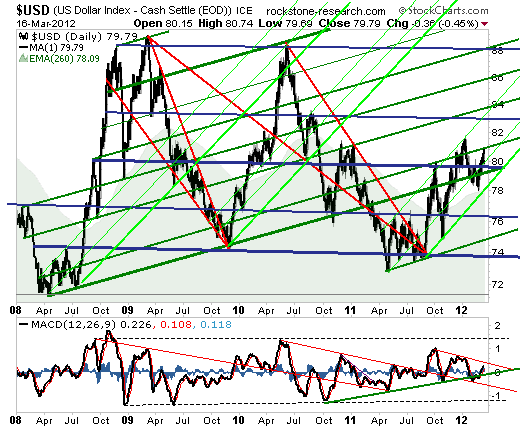
Having said the above, let’s discuss the situation in gold’s main adversary (after all, they tend to move in the opposite ways), the USD Index. If the latter was about to take a dive, we might still expect gold to soar. But is it likely?
No.
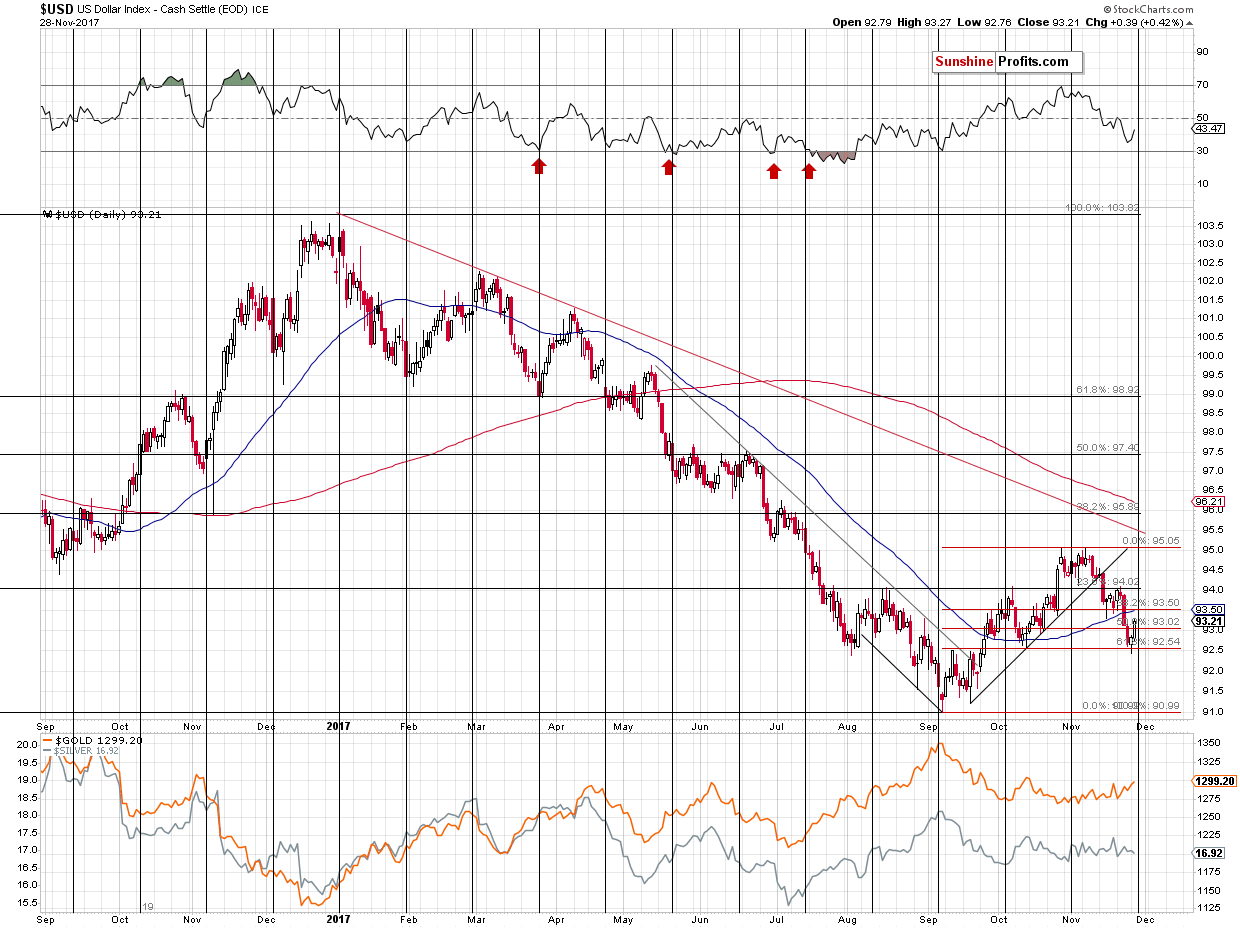
The USD Index moved lower in the past few weeks, but not in the past few days. In Monday’s alert, we wrote about a possible move below the 61.8% Fibonacci retracement level and a subsequent invalidation – that’s exactly what we saw during Monday’s session. The reversal took place quite close to the cyclical turning point, which further increases the odds that the bottom is really in and yesterday’s rally further confirmed it.
This is likely also based on the analogy in terms of time to the previous corrections in the early parts of major rallies in the USD.
One of the reasons due to which we expect the USD Index to rally in the coming months is the analogy to its behavior during previous series of rate hikes. The USD didn’t start to rally immediately after the rates were increased in the recent past and while it may seem surprising, this is exactly how things developed in the past. There was a specific delay in the USD’s reaction and it seems that it will also be the case this time. If the history is to repeat itself, it seems that the series of rate hikes is going to trigger a massive rally in the USD Index any week now.
But didn’t USD Index just decline for a few weeks? Doesn’t it invalidate any bullish implications here?
That’s a very good question and we decided to take a closer look at the analogy to the previous major bottoms and the early parts of major rallies. It is often said that time is more important than price and we analyzed the previous upswings and the early corrections with the above in mind. Namely, we checked how long the initial rallies lasted and how long the USD was correcting. You will find the details below:
- 1998 – 1999: the initial rally: 6 weeks, followed by 2 weeks of declines
- 1999 – 2000 the initial rally: 7 weeks, followed by 5 weeks of declines
- 2005 – the initial rally: 6 weeks, followed by 4 weeks of declines
- 2008 – the initial rally: 7 weeks, followed by 5 weeks of declines
- 2009 – 2010 – the initial rally: 4 weeks, followed by 3 weeks of declines
- 2011 – the initial rally: 10 weeks, followed by 2-5 (unclear) weeks of declines
- 2014 – 2015 – the initial rally: 4 weeks, followed by 4 weeks of declines
- 2016 – the initial rally: 4 weeks, followed by 3 weeks of declines
- 2017 (current upswing) – the initial rally: 7? weeks, followed by 4? weeks of declines
The initial rallies lasted between 4 and 10 weeks with the 10 number being the outlier. The average is 6, while the most recent rally either took 7 weeks (quite in tune with the past patterns) or it’s not over yet with 10 weeks so far. If it’s not over, then it would need to rally for an additional week or two, thus making the entire rally even longer than the previous outlier at 11 or 12 weeks (or longer).
Is it therefore possible that the rally will still continue before a bigger correction is seen? Yes. Is it likely? No. Based on the above time analogies it’s more likely that the initial rally is already over and we are after 3 weeks of declines.
Is the above good or bad? Both. It’s good, because we’re likely closer to the big decline in the precious metals market than it first appeared, but it’s bad because we may not get a meaningful and tradable corrective upswing in the precious metals sector after the USD Index moves close to the 96 level. Ultimately, it’s not really a matter of deciding whether the current environment is better or worse, but adapting to it and tweaking the strategy so that it remains up-to-date with the most recent observations. After all, trading is like a game of poker – at times you will get a good hand and at times you will get a back hand, but by having a good strategy toward both situations you’ll likely come out ahead over time.
So, what’s the likely follow-up action from here? If we are indeed after 3 weeks of declines, then if we can estimate how long the rally is likely to last, we could check how long it should take, additionally, for the USD to bottom.
The average length of the correction is between 3.5 and 3.875 weeks depending on the interpretation of the 2011 action. We are already after 4 weeks.
What if instead of using the average, we take into account the most similar cases – where the initial rallies took 6 or 7 weeks. In this case we get an average of 4 weeks (based on 2, 5, 4, and 5 weeks). 5 weeks is the most common analogy (half of the cases), though.
Finally, what if we assume that the most recent rally (2016) is most likely to be repeated as it’s most similar fundamental-wise? In this case, we should expect the decline to take 3 weeks. In other words, it could be over.
All in all, if we average the above approaches, it seems likely that we have either already seen the final bottom in the USD or we’re going to see it this week. Next week is also a possible time target, but it’s not as likely.
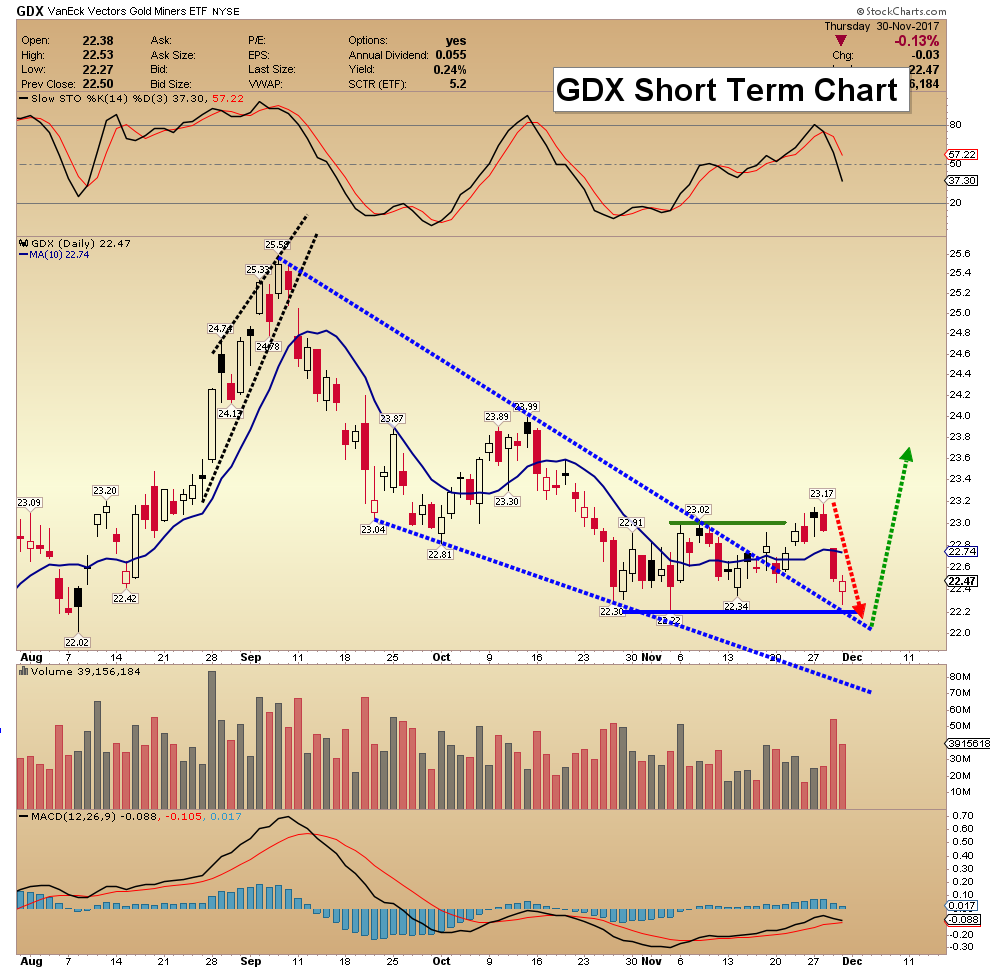
Summing up, gold’s rally that we saw yesterday is either inconsequential, if we focus on its performance relative to the rest of the precious metals market, or actually bearish, if we focus on it on a stand-alone basis and compare it to the size of the volume. Moreover, let’s not forget that even though the USD Index declined visibly in the past weeks, mining stocks were unable to invalidate the breakdown below the rising resistance line and the implications remain bearish. There are many signs pointing to a big move lower in the coming weeks and it seems that any short-term strength will be reversed sooner rather than later, especially if the decline in the USD Index is already over. The odds for the latter increased based on yesterday’s rally and the analogy to the previous early parts of major upswings.
Thank you.
Sincerely,
Przemyslaw Radomski
We hope you enjoyed today’s analysis, even though it might appear controversial. If you’d like to receive follow-ups, we invite you to subscribe to our Gold & Silver Trading Alerts.

Market participants are often heard saying things like “you can’t trade Gold on fundamentals.” With no cash flows to discount, Gold is a different animal than stocks or bonds. It is said to swing higher and lower due to changes in investor sentiment alone. Many a trader will advise you to simply follow the trend:
- When Gold is in an uptrend, own Gold.
- When Gold is in a downtrend, go to cash.
Going back to 1975 (when Gold futures began trading), how would such a strategy have fared?
At first glance, pretty good. Owning Gold when it closed above its 200-day moving average and moving to cash when it closed below it would have resulted in a higher return (5.1% vs. 4.6%) with lower volatility (16.5% vs. 20.0%) than buy-and-hold.

The maximum drawdown: 51% for trend following versus -69.6% for buy-and-hold.

Case closed, trend following wins?
Not so fast. We have yet to include the transaction costs that exist in the real world. The trend following strategy would have traded around 3.75 times per year going back to 1975. At a cost below 0.14% per trade, trend following still beats buy-and-hold. At anything above 0.14%, trend following underperforms.
 \
\
While 0.14% may seem somewhat high in today’s world, for a long time it would have been deemed quite cheap (see chart below). It’s likely that the average transaction cost (slippage and commission) since 1975 was well above 0.14%. Which means it would have been difficult for trend following to beat a buy-and-hold strategy in practice.

Source: A Century of Stock Market Liquidity and Trading Costs, Jones (2002)
Does that mean trend following in Gold “doesn’t work”? It depends on what your definition of “work” is. If by “work” you simply mean a higher return, then that might be be an accurate assessment (if we include transaction costs). But looking back at history, the real value in trend following is not on the return side of the equation, but on the risk side. (Note: we showed something similar in our research paper on moving averages and leverage in the equity market).
As evidence of this, trend following produced a higher return in all of the worst years for Gold. This is what leads to the lower volatility/drawdown profile, as you are cutting your losses after a break of the 200-day moving average that continues lower.

The trade-off, beyond higher transaction costs? Missing out on upside during strong periods (ex: 2002 – 2012) and being whipsawed in choppy, sideways markets (ex: 1990, 2014, 2017). Overall, the trend following strategy would have outperformed in only 35% of years since 1975 (ignoring transaction costs). This includes a long stretch from 1998 through 2009 where a simple buy-and-hold of Gold outperformed a trend-following strategy in every year except one (2002, when they were tied).

What should a trader/investor take away from all of this?
Markets are hard. The notion that simply “following the trend” in Gold will lead to vast riches is a false one. It would have been far from easy for someone to stick with such a trend following strategy over time (many, many periods of underperformance) and far from conclusive that doing so would have been superior than buy-and-hold (if we include transaction costs). And while most traders talk of trend following in terms of capturing profits from strong upward moves, the real value in trend following is just the opposite: in avoiding strong downward moves that continue lower for a period of time.
So while the saying “you can’t trade gold on fundamentals” may be true, that doesn’t mean trading it on technicals is any easier.
***
Related Posts:
To sign up for our free newsletter, click here.
This writing is for informational purposes only and does not constitute an offer to sell, a solicitation to buy, or a recommendation regarding any securities transaction, or as an offer to provide advisory or other services by Pension Partners, LLC in any jurisdiction in which such offer, solicitation, purchase or sale would be unlawful under the securities laws of such jurisdiction. The information contained in this writing should not be construed as financial or investment advice on any subject matter. Pension Partners, LLC expressly disclaims all liability in respect to actions taken based on any or all of the information on this writing.
CHARLIE BILELLO, CMT

-
I know Mike is a very solid investor and respect his opinions very much. So if he says pay attention to this or that - I will.
~ Dale G.
-
I've started managing my own investments so view Michael's site as a one-stop shop from which to get information and perspectives.
~ Dave E.
-
Michael offers easy reading, honest, common sense information that anyone can use in a practical manner.
~ der_al.
-
A sane voice in a scrambled investment world.
~ Ed R.
Inside Edge Pro Contributors

Greg Weldon

Josef Schachter

Tyler Bollhorn

Ryan Irvine

Paul Beattie

Martin Straith

Patrick Ceresna

Mark Leibovit

James Thorne

Victor Adair