
Gold & Precious Metals
We were recently asked to comment on Harry Dent’s predictions for the gold market and we thought that our reply might benefit other gold investors as well. To be precise, we were asked about Harry Dent’s 30-year cycle that supposedly peaked in 2011, and we supposedly could expect gold to peak again somewhere between 2038 and 2040 (you can watch the interview here). The indirect implication is that gold is not likely to soar sooner and that it’s likely to decline for a relatively long time.
Mr. Dent is referring to gold as a premier commodity and he claims that it moves up and down with the commodity cycle, which, in his opinion, is 30 years.
If the above is really the case, then the previous prediction may be well founded. But is it really so?
We respectfully disagree for two reasons.
The first reason is fundamental. Gold’s price reacts more to flows of gold than to mining supply and demand and thus it behaves more like a currency than a commodity. So, from the fundamental point of view, it may not be justified to view gold simply as a commodity (even a premier one).
The second reason is… Simply checking the facts and the facts confirm our thesis from the above paragraph, invalidating Mr. Dent’s claim that gold moves in a 30-year cycle.
The price of gold was fixed for most of history, so it’s impossible to analyze this cycle directly. No, that’s not our case against the theory. Our case is that we can use the best proxy that we have for the price of gold. The price of gold was fixed, but the prices of gold stocks were not and since the major tops and bottoms in both asset classes correspond to each other, gold miners could be used to check what gold could have done. The gold stocks ratio to the general stock market is even better because by using it we are taking out the part of the mining stocks’ price movement that depends on the stock market volatility.
Let’s check if this is indeed the case with the HUI to S&P 500 ratio (chart courtesy of http://stockcharts.com).


The above charts show the same ratio over the same time-span and they differ only in terms of scale. Since the link between the HUI to S&P ratio and gold is clearly visible in both linear and logarithmic terms, we can safely assume that our earlier assumption of using gold miners and their ratio as a proxy for gold was correct.
Unfortunately, we can’t use the HUI Index and its ratio in the case of the very long-term analysis as it wasn’t trading just a few decades ago. The gold stock that was trading and that we will use as a proxy for the entire sector (in light of lack of other alternatives) is Homestake Mining.
Can we observe a 30-year cycle in Homestake Mining prices and/or its ratio to the general stock market?


Sources: first chart, second chart
The bottoms in the ratio (second chart) are the moments when we can speak of “artificial tops” in gold. The 2011 top and the 1980 top were seen in gold directly and the only (!) addition that the above chart provides us with is the mid-1930s extreme.
We can see exactly the same thing on the chart featuring Homestake Mining directly. There was a major, long-term top in mid-1930s and then nothing extreme happened until 1980 with the exception of interim tops in the late 1960s and mid-1970s.
About 30 years passed from the 1980 top to 2011, but that’s it as far as the confirmations of the 30-year old cycle go and a cycle with only one occurrence is no cycle. The timespan between the 1980 top and the previous one is about 45 years, which is exactly between 2 supposed topping dates (that should be 30 and 60 years away). In other words, the mid-1930s observation couldn’t invalidate the 30-year cycle theory more than it already does.
On a side note, since gold topped in early 1980, taking the 30-year cycle and applying it to the letter would make one sell gold in early 2010 – more or less when gold was trading around $1,100, right before the biggest rally of the bull market.
Summing up, it doesn’t seem that gold is just a premier commodity as it’s price doesn’t seem to follow the 30-year cycle. Consequently, it doesn’t seem to be justified to expect gold to form the next big top between 2038 and 2040 – it could and is likely to rally much sooner. The above doesn’t mean that gold will not decline in the following months, but it does imply that one shouldn’t bet on a multi-year long decline in the prices of yellow metal. Therefore, when gold slides sharply, it is likely to serve as an epic buying opportunity – not the start of a boring, multi-year consolidation.
Thank you.
Przemyslaw Radomski, CFA
Founder, Editor-in-chief, Gold & Silver Fund Manager
Sunshine Profits – Tools for Effective Gold & Silver Investments

There is a new trend by individuals in the alternative media community who are now selling out of precious metals and buying into Bitcoin and cryptocurrencies. While this may seem like a good idea, especially when Bitcoin and the cryptocurrencies reach new all-time highs, it is likely a big mistake. Now, I am not saying that individuals shouldn’t invest in cryptocurrencies. Rather, it’s a lousy idea to sell all of one’s precious metals holdings and put it all into Bitcoin and cryptocurrencies.
Recently, Sean at SGTReport published a short video in which part of the headlined was titled as “SILVER BULL CAPITULATES.” In the video, Sean explains how past frequent guest and precious metal analyst, Andy Hoffman, has sold out of all his silver and is now only in Bitcoin and gold. Andy explains in his interview on Crush The Street that he sold all of his silver this summer as he really has no interest in it. He goes on to say, “Because, in a digital age, I just don’t believe people are going to store thousands of pounds of silver hoping that the gold-silver ratio is going to come down.”
I have to tell you, not only do I find this sort of thinking, utterly preposterous, I also find it quite troubling that analysts who have been promoting precious metals for the past decade are now implying that gold and silver are no longer high-quality stores of value. I disagree entirely with this faulty and superficial analysis.
There are several reasons why I believe it is essential to hold most of one’s wealth in precious metals than in Bitcoin and cryptocurrencies. However, the most important factor has to do with the fragile nature of a highly technical complex system that allows Bitcoin and cryptocurrencies to function. It takes a tremendous amount of energy to maintain and power the internet, servers and computer systems that give life to Bitcoin and cryptocurrencies.
Unfortunately, the majority of the alternative and mainstream media analysts believe in the ENERGY TOOTH FAIRY ( a term coined by Louis Arnoux). What do I mean by the ENERGY TOOTH FAIRY? It is the belief by a significant portion of the public and analyst community that the advanced world economy and markets will continue to prosper and grow forever. Yes, it’s true that some analysts, such as Harry Dent, believe that if we got rid of the corrupt bankers and politicians and allowed people to have a lot more babies, then economic growth will continue indefinitely.
For some odd reason, Harry Dent totally omits the impact of energy on his demographic analysis of the markets. Does ole Harry not realize that the exponential increase in global oil production has coincided with the exponential growth in human population??? Of course not. If he did, he would stop focusing on demographics and place his attention on what is happening in the global energy industry.
Regardless, selling out of one’s precious metals holdings might be unwise if we consider that the price of gold and silver are closer to their lows, and Bitcoin and the cryptos are reaching new highs.
PRECIOUS METALS PRICES NEAR LOWS vs. BITCOIN AT RECORD HIGHS
For example, the current gold price at $1,280 is only 10% above its annual average low of $1,160 set in 2015, while silver at $17 is only 8% higher than its average yearly low of $15.68 during the same year. However, if we look at Bitcoin, the price is near its current high of $8,200:

Here we can see that Bitcoin has increased more than ten times from $800 at the beginning of 2017 to over $8,000 currently. While Bitcoin traders and speculators with Dollar signs in their eyes are betting on much higher prices, let me show you another chart. This is the first Bitcoin price spike that skyrocketed to over $1,000:

As we can see in the chart, Bitcoin’s price surged ten times from $115 in October 2013 to $1,150 at the end of December. If we went back to this exact time, it looked like Bitcoin’s price was going to continue higher. However, if we go back and see what happened after Bitcoin spiked to $1,000, there was a huge consolidation period:

One year after Bitcoin hit $1,150, it was trading at $250. It took nearly three more years before Bitcoin surpassed its previous high. Will this happen to Bitcoin again? Who knows? It is almost impossible to gauge the value of Bitcoin and the cryptocurrencies. Yes, we could see Bitcoin continue towards $10,000. However, we must realize that most people are not getting into Bitcoin because they understand the potential benefits of blockchain technology, but rather because the price is surging higher and higher. There’s nothing like a skyrocketing price to bring in the speculators in huge numbers.
Recently, Mike Maloney of GoldSilver.com stated in a video that he took some Bitcoin profits and purchased silver. He believed that it was smart to take profits from Bitcoin as it looked like it was potentially overvalued and buy silver as it was undervalued. I agree.
Those Who Sold Their Precious Metals For Bitcoin Forgot About Our Dire Energy Predicament
As I stated at the beginning of the article, individuals who believe in a new high-tech world with Bitcoin and cryptocurrencies running the monetary system must have forgotten about our dire energy predicament we are facing. This baffles me. The U.S. infrastructure is falling apart while North American suffers from over 250,000 water main breaks a year, and we are going to transition into a new high-tech world of robots and cyborgs? Who are we fricken kidding?
Has anyone taken a good look at what happened to the Great Egyptian, Mayan and Roman Empires??? They PEAKED and DECLINED… LOL. And it was all based on their Falling EROI – Energy Returned On Investment. The more advanced and complex a society becomes, the more energy it takes to run and maintain it. Folks, we have run out of our CHEAP, ABUNDANT ENERGY.
I have provided many clues, but I believe it’s a good idea to present a few charts once again. The Global Oil Industry is cannibalizing itself just to stay alive. We know this is happening by looking at the massive increase in long-term debt:

The global major oil companies long-term debt had quadrupled from $84 billion in 2007 to nearly $380 billion last year. Why did their long-term debt increase when they were enjoying $100 a barrel of oil from 2011-2014?? The problem is that Falling EROI is now pushing costs higher as the net energy in a barrel of oil declines. This is a double-edged sword.
For example, these top seven major global oil companies enjoyed a combined net income profit of $100 billion in 2004 when the price of oil was $38 a barrel. However, even though the price was higher at $44 last year, their combined net income fell nearly 90% to $10.5 billion:

So, the BIG PROBLEM now is that the world market can’t really afford high oil prices and the oil companies can’t produce oil at a lower cost. If we take at this last chart, we can see just how bad the situation has become for the world’s major oil companies:

Back again in 2004, these top seven global oil companies enjoyed a Return On Capital Employed (ROCE) between 20-40%. We must remember, that year the price of oil was $38. However, if we compare the when the oil price was higher at $44, these companies ROCE was in the low single digits. Thus, they return on capital employed collapsed.
These three charts paint a very grim future for the global oil industry. Without the burning of oil, our economy grinds to a halt. I would like to remind those who believe WIND, SOLAR, and ELECTRIC VEHICLES are going to save us… they are nothing more than fossil fuel derivatives. The world needs to burn a lot of oil, natural gas and coal to produce the so-called renewable green wind, solar and EV’s.
So, when oil and natural gas supply declines, so will the delusion of renewable energy. Now, I am not saying it isn’t wise to own solar panels on one’s home or to have an electric car. Instead, it’s unwise to believe solar, wind, electric vehicles, and a new high-tech world is our future.
It isn’t.
I believe we are going to experience one hell of a market crash and deflation. Not only will the oil price drop like a rock, but so will the value of most STOCKS, BONDS, and REAL ESTATE. If you have sold your precious metals for cryptos at this time, you may find out that was a big mistake.
Check back for new articles and updates at the SRSrocco Report.
It has been a while since we’ve applied historical analysis to the precious metals sector. It is something we really enjoy as history can help define and contextualize current trends and help us spot opportunities. Back in March of this year we noted that the gold stocks could be following the path of recovery of housing stocks since their 2009 bottom. Recently, James Flanagan of Gann Global Financial has produced some excellent videos discussing some historical comparisons that are quite relevant to the gold stocks at present. We saw his videos, remembered our housing analog and wanted to take it a step further. What was the path of recovery of markets following mega bear markets?
We define a mega bear market as at least an 80% decline that lasted roughly three to four years. The image below highlights the data we’ve compiled. Some of the bears are only two years long but they follow the general recovery path. That consists of a very strong initial rebound that lasts six to twelve months which is followed by a correction and consolidation which usually lasts 18 months to two years. Then, the market begins its next impulsive advance.

Next we will look at the three best fits to the gold stocks at present.
The housing stocks may be the best analog. They lost 81% during a bear market which lasted nearly four years. Then they recovered 137% before correcting 42% over 18 months. Over the next 18 months (from the 2011 low to 2013), the housing stocks gained 177% . 
The S&P 500 during the Great Depression is also a good fit. The market lost 86% over nearly three years. That led to a 177% rebound which was followed by a 34% correction over one year and eight months. The market then rebounded 132% over the next two years.

Finally, Thailand is an interesting example. It lost 87% over a greater than four year bear market. Both time and price were similar to the bear market in gold stocks. After rebounding 142%, Thai stocks lost 54% over the next year and four months. While that low in late 2000 marked the corrective low in price, the market did not begin an impulsive advance for another year. However, it was worth the wait as the market gained 200% over the following two years.

The gold stocks have followed the recovery path of these markets but there are some slight differences. The corrections and consolidations in Housing and the S&P 500 were less severe as those markets tested or at least came close to testing their initial rebound peaks. The correction in Thailand was more severe as that market shed 54% in 16 months. At present, gold stocks are in the 16th month of their correction and are down roughly 30%-35%. In any case, we expect the current correction and consolidation to continue into 2018.

There is no guarantee of a future breakout move in precious metals but the gold stocks are following a specific history of recoveries following mega bear markets and that history implies a major move higher should begin sometime in 2018. When we consider the time of the corrections and time between the two bottoms along with the slight weakness in gold stocks as compared to some of the examples, we expect the next significant low to be in Q2 or Q3 2018. The low does not necessarily have to be an absolute price low. It would mark the point from which the gold stocks would begin an impulsive advance. In the meantime, the key for traders and investors is to find the best companies and seek oversold situations with value and catalysts that will drive buying.
Jordan Roy-Byrne CMT, MFTA

Today’s videos and charts (double click to enlarge):
SFS Key Charts & Video Update

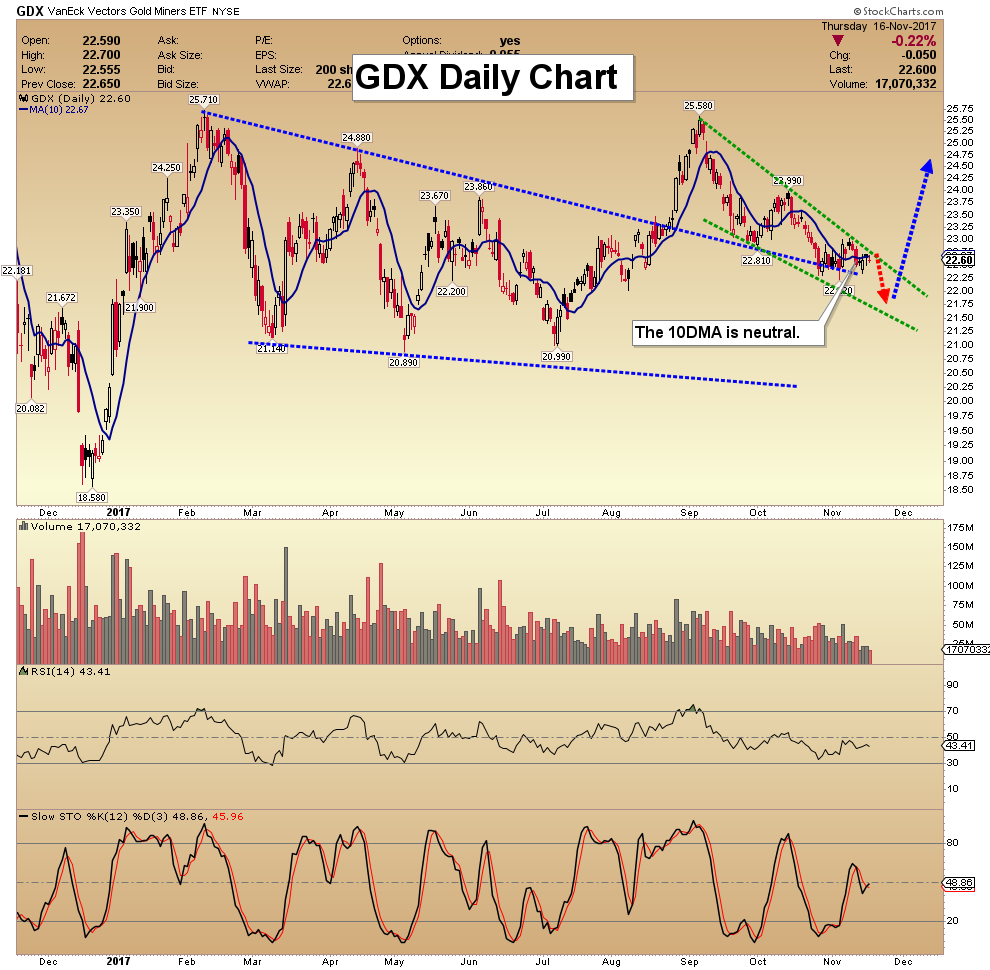
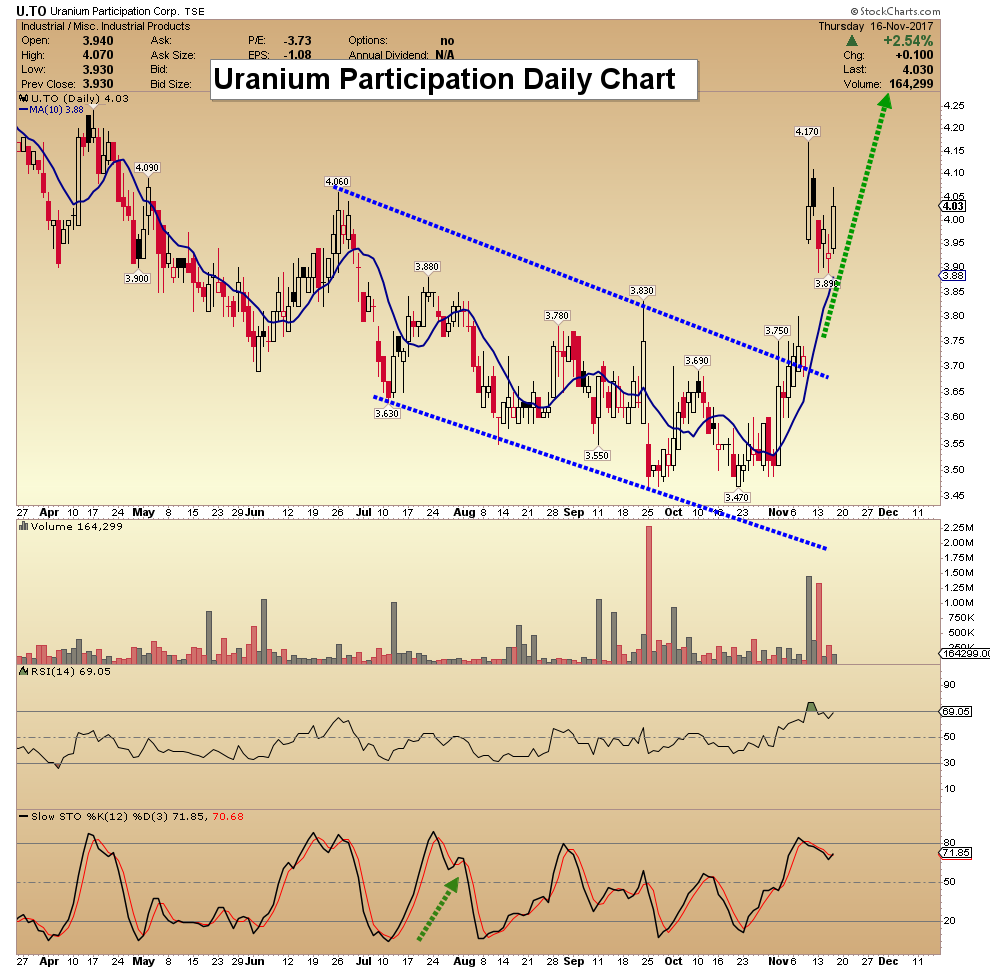
SF60 Key Charts & Video Update
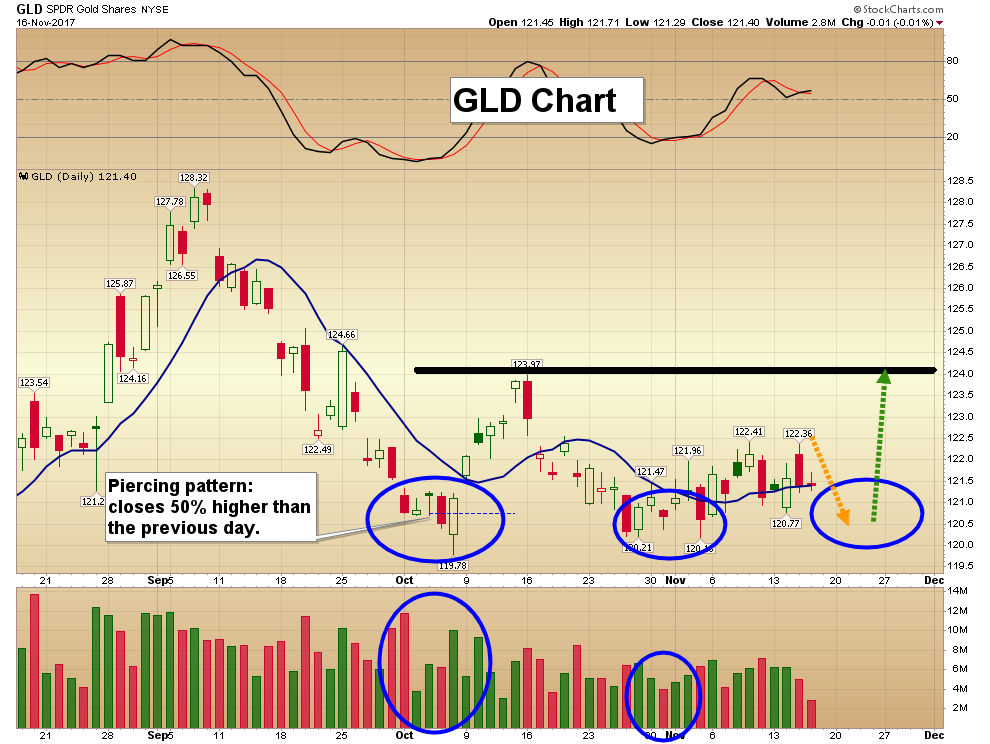
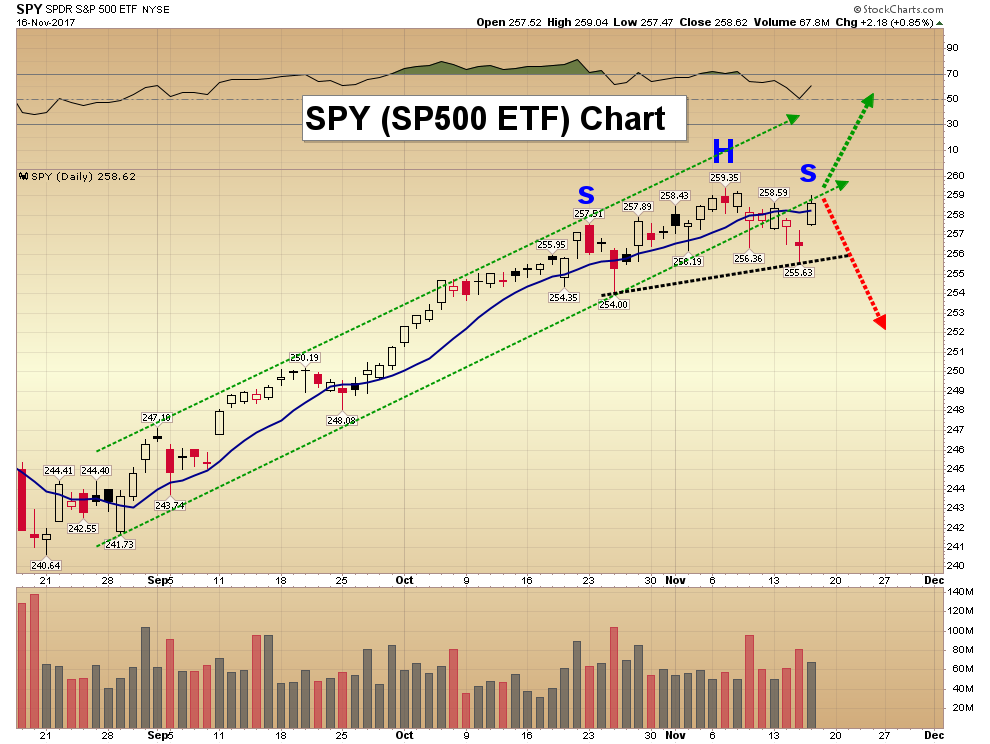
SF Juniors Key Charts & Video Analysis
SF Trader Time Key Charts & Video Analysis
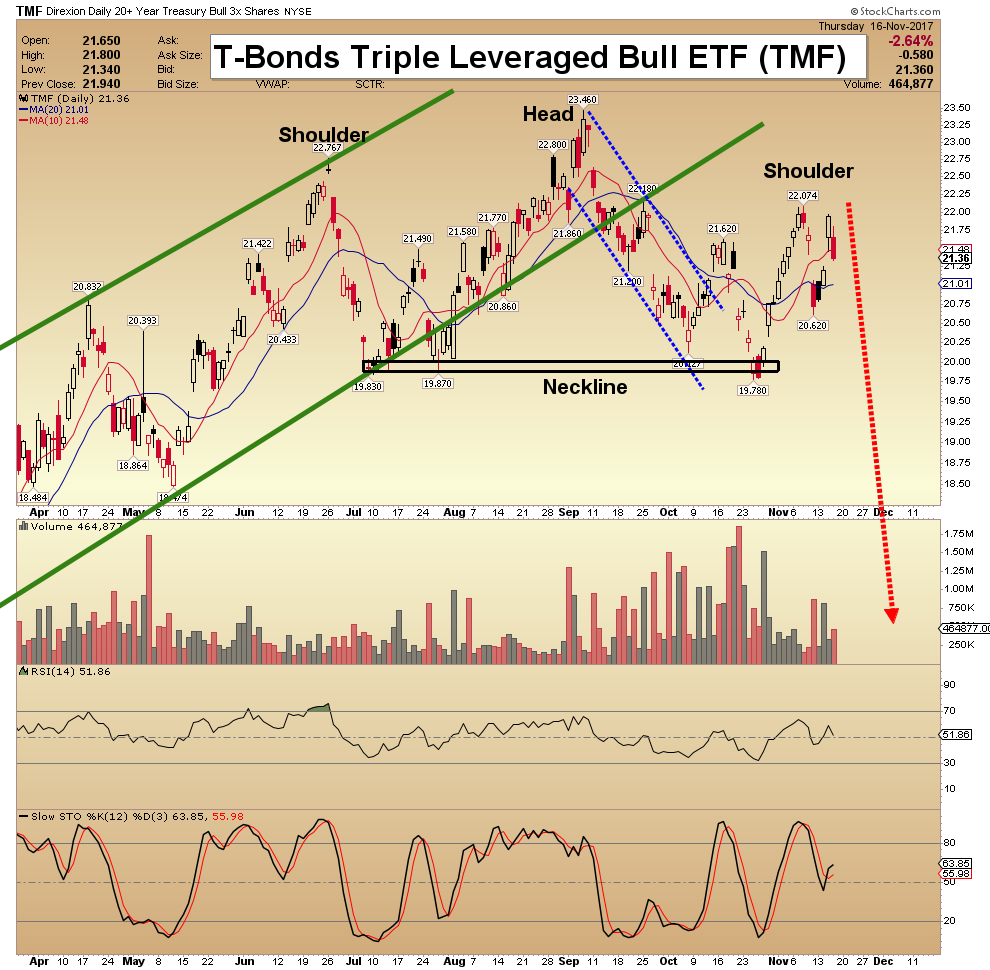
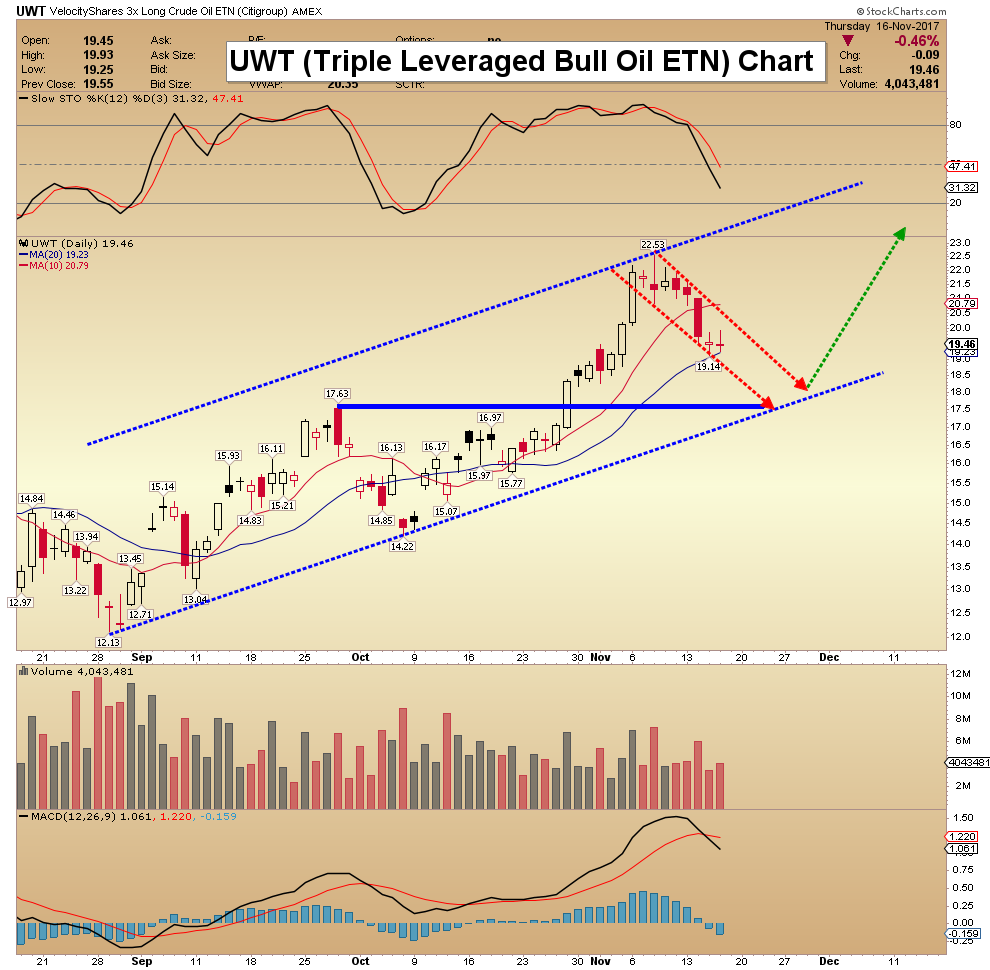
Morris
Friday, Nov 17th 2017 Super Force Signalswebsite: www.superforcesignals.com
It has been a rough year for many primary silver miners as two-thirds have suffered declines in production. Also, many high ranking silver producing countries are also experiencing a pronounced reduction in their domestic silver mine supply. According to the data put out by World Metal Statistics, Chile’s silver production is down 20% in the first eight months of the year, while Australia is down 19%, Mexico declined 2% and Peru lower by 1%.
The Silver Institute will be releasing their 2017 Silver Interim Report shortly which will provide an update on current silver production and forecasts for the remainder of the year. However, I believe global silver production will take a big hit this year due to several factors including, falling ore grades, mine closures, and strikes at various projects.
For example, Tahoe Resources was forced to shut down its Guatemalan Escobal Mine in July due to a temporary suspension of its operating license by the country’s Supreme Court. However, even after the Guatemalan Supreme Court reinstated Tahoe Resources Escobal Mine’s license in early September, an ongoing road blockade has hampered the ability of the project to continue mining. Regardless, Tahoe’s silver production declined a stunning 6.7 million oz Q1-Q3 2017 versus the same period last year.
Now, on the other hand, silver production at Fresnillo’s operations in Mexico jumped by nearly six million oz during the first three-quarters of 2017 primarily due to the start-up of its San Julian Mine phase II expansion and a ramp-up of its phase I:

While the gain in silver production at Fresnillo’s operations helped to offset the significant decline at Tahoe’s Escobal Mine, two-thirds of the top primary silver companies in the group experienced a reduction in mine supply this year. Hecla’s silver production fell by 3.7 million oz in the first three-quarters this year due to an ongoing strike at its Lucky Friday Mine in Idaho. Moreover, output at Silver Standard’s Puna operations in Argentina fell by 3.2 million oz due to a 36% decline in ore grade at is open-pit Pirquitas Mine. Silver Standard’s Pirquitas Mine is one of the few open-pit silver operations in the world. The overwhelming majority of primary silver mines in the world are underground operations.
Overall, production at these top primary silver miners fell 9 million oz in 2017 compared to the same period last year:

Now, if Tahoe Resources Escobal Mine was not forced to shut down or if Hecla’s Lucky Friday Mine’s strike was resolved, overall production at these top primary silver miners would have likely increased by approximately one million oz this year. Unfortunately for Tahoe’s Escobal Mine and its investors, it may be quite some time before full production resumes. As I have mentioned in previous articles about the troubles plaguing the Escobal Mine by the local and indigenous peoples living by the operation, there are two very different opinions on the underlying problems.
While I have stated that the negative issues put forth by the local and indigenous peoples about the Escobal Mine are likely more valid than the pro-western stance taken by the Tahoe Managment or the Mainstream financial media, time will tell how this is resolved. However, the notion put forth by Tahoe Management that the problems are stemming from “non-locals” who are supposedly radicalizing the locals around the plant, is unfounded when we understand that it is a huge ground-roots movement led by a large percentage of the inhabitants surrounding the mine.
According to the article, Tahoe Resources’ Social Licence in Guatemala Non-Existent, as Uncertainty Plagues Escobal Permits:
Tahoe CEO Ron Clayton is also wrong when he states in a recent press release that community opposition comes from “non-locals”. Lack of social license has dogged Tahoe Resources since the beginning of its project. Since 2011, tens of thousands of residents in eight municipalities around the Escobal mine have voted in municipal plebiscites demonstrating their opposition to the project, or any mining in the area, out of concern for their water supplies, health, and local agriculture. Five municipalities refuse to receive any royalty payments from Tahoe’s mine operations and are now parties to the legal proceedings over discrimination of the Xinka Indigenous population and the Ministry of Energy and Mines’ failure to consult with them.
As the article states, five municipalities refuse to receive any royalty payments from Tahoe’s mine operations and are now supporting legal proceedings. This does not sound like a small group of non-locals instigating trouble. Rather, this has been an ongoing issue ever since the Escobal Mine was initially planned, during its construction phase and ever since it produced its first ounce of silver in 2014.
Lastly, it looks like global silver production will take a big hit this year. We could see world silver mine supply fall by 40-50 million oz in 2017 if the trend continues for the remainder of the year. One country that I did not report on about silver production was China. According to the World Metals Statistics, they show Chinese silver production down by a stunning 25% in the first eight months of 2017. However, I don’t believe the decline is that high. Even though the World Gold Council stated that Chinese gold production was down 10% so far this year, I doubt their silver production fell 25% this year.
We will have to wait and see what production figures the Silver Insitute will release in their 2017 Silver Interim Report when it’s published in the next few weeks. Regardless, the world’s economies are being propped up by a massive amount of debt, derivatives and money printing. When the markets finally crack, global silver production will fall considerably as for demand for base metals will drop like a rock. We must remember, 58% of world silver production is a by-product of copper, lead and zinc production. So, when base metal demand falls, so will base metal production.
Thus, as the market and economy continue to disintegrate, global silver supply will fall right at the very same time investment demand surges
Check back for new articles and updates at the SRSrocco Report.

-
I know Mike is a very solid investor and respect his opinions very much. So if he says pay attention to this or that - I will.
~ Dale G.
-
I've started managing my own investments so view Michael's site as a one-stop shop from which to get information and perspectives.
~ Dave E.
-
Michael offers easy reading, honest, common sense information that anyone can use in a practical manner.
~ der_al.
-
A sane voice in a scrambled investment world.
~ Ed R.
Inside Edge Pro Contributors

Greg Weldon

Josef Schachter

Tyler Bollhorn

Ryan Irvine

Paul Beattie

Martin Straith

Patrick Ceresna

Mark Leibovit

James Thorne

Victor Adair