
Gold & Precious Metals


Our rendition of an Elliott Wave chart shown on the next page says it’s time to sell gold; i.e. once minor corrective rally Wave ii completes—that may be today). Targets lower are 1,210; then 1180-level. And if the US dollar catches a major bid, there is scope to test the swing low of 1,123 from mid-December 2016 (gold vs. dollar weekly chart page 3). Note: The 55-week gold to US dollar index correlation is a whopping -84.3%; i.e. as gold goes up, the dollar goes down, and vice versa.
Gold Futures Daily Wave Chart

Gold Futures vs.. US Dollar Index Weekly Chart

We should find out soon whether Mr.. Elliott is correct..
Regards,,
Jack Crooks, President, Black Swan Capital
jcrooks@blackswantrading.com
www.blackswantrading.com
772 – 349 – 6883 / Twitter: bswancap

BOB HOYE
PUBLISHED BY INSTITUTIONAL ADVISORS
OCTOBER 26 , 2017
Our September 14th Pivot noted that the decline in the DX seemed to be basing. In which case, as the dollar recovered, the sector would sell off.
Our conclusion was that the Precious Metals sector could be much cheaper by late in the year.
This year’s high for the GDX was 25.58 at the first of September. This week’s decline to 22.25 has taken out the 20-Week ema at 23.22.
To look to the brighter side, the decline could diminish the old mojo that the Fed is evil and will drive the dollar down. This of course will drive gold, for those who know someone at the CIA, to “Ten Thousand Dollars!”.
Highly unlikely.
Further on the brighter side, the completion of this financial bubble will set up a real cyclical bull market for gold and gold stocks.
By “real” we mean that gold’s real price and gold mining profitability will increase, which is one of the features of a post-bubble contraction.
This could get underway early in 2018.
In the meantime, we will be watching for the buying “window”.


 My good friend Pierre Lassonde, cofounder and chairman of Franco-Nevada, doesn’t know how we’ll replace the massive gold deposits of the past 130 years or so. Speaking with the German financial newspaper Finanz und Wirtschaft this month, Pierre says we’re seeing a significant slowdown in the number of large deposits being discovered. Legendary goldfields such as South Africa’s Witwatersrand Basin, Nevada’s Carlin Trend and Australia’s Super Pit—all nearing the end of their lifecycles—could very well be a thing of the past.
Over the medium and long-term, this could lead to a supply-demand imbalance and ultimately put strong upward pressure on the price of gold.
According to Pierre: If you look back to the 70s, 80s and 90s, in every one of those decades, the industry found at least one 50+ million ounce gold deposit, at least ten 30+ million ounce deposits and countless five to 10 million ounce deposits. But if you look at the last 15 years, we found no 50 million ounce deposit, no 30 million ounce deposit and only very few 15 million ounce deposits.
So few new large mines are being discovered today, Pierre says, mostly because companies have had to slash exploration budgets in response to lower gold prices. Earlier this year, S&P Global Market Intelligence reported that total exploration budgets for companies involved in mining nonferrous metals fell for the fourth straight year in 2016. Budgets dropped to $6.9 billion, the lowest point in 11 years. Although we’ve seen an increase in spending so far this year, it still dramatically trails the 2012 heyday.
And because it takes seven years on average for a new mine to begin producing—thanks to feasibility studies, project approvals and other impediments—output could recede even more rapidly in the years to come.
“It doesn’t really matter what the gold price will do in the next few years,” Pierre says. “Production is coming off, and that means the upward pressure on the gold price could be very intense.”
Have we reached peak gold?
What Pierre is talking about, of course, is the idea of “peak gold.” I wrote about this last year and suggested another factor that could be curtailing new discoveries—namely, the low-hanging fruit has likely already been picked. Gold is both scarce and finite—one of the main reasons why it’s so highly valued—and explorers are now having to dig deeper and venture farther into more extreme environments to find economically viable deposits.
Other factors contributing to the decline include tougher regulations and higher production costs. And unlike with the oil industry, no “fracking” method has been invented yet to extract gold from hard-to-reach areas, though Barrick—the world’s largest producer by output—has been experimenting with sensors at its Cortez project in Nevada.
Take a look at how drastically annual output has fallen in South Africa, once the world’s top gold-producing country by far. In the 1880s, it was the discovery of gold in South Africa’s prolific Witwatersrand Basin—responsible for more than 40% of all gold ever mined in human history, if you can believe it—that helped transform Johannesburg into one of the world’s largest and most populous cities. Today, South Africa’s economy is the most advanced and stable in Sub-Saharan Africa, all thanks to the yellow metal.
In 1970, miners dug up more than 1,000 metric tons—an unfathomably large amount. Since then, production has steadily dropped. No longer in the top spot, South Africa produced only 167.1 tons in 2016, an 83% plunge from the 1970 peak. Meanwhile, miners in the notorious Mponeng mine—already the world’s deepest at 2.5 miles—continue to follow veins even deeper into the earth at greater and greater expense.
Australia could soon be seeing a similar downturn over the next four decades. A first-of-its-kind study conducted by MinEx Consulting and released this month, shows that Australia’s gold production is expected to see a significant drop between now and 2057. By then, all but four of the 71 currently operating mines in the country will be exhausted. Most of these will close in the next couple of decades. Any additional production will be dependent on new exploration success, which will become increasingly difficult if companies don’t invest in exploration and if the Australian government doesn’t relax rules in the mining space.
MinEx estimates that “for the Australian gold industry to maintain production at current levels in the longer term, it will either need to double the amount spent on exploration or double its discovery performance.”
To be fair, large discoveries haven’t disappeared entirely. Back in March it was reported that Shandong Gold Group, China’s second-largest producer, uncovered a deposit in eastern China containing between 380 and 550 metric tons of the yellow metal. If true, this would make it the country’s largest ever by amount. The mine has an estimated lifespan of 40 years once operations begin.
In addition, Kitco reports this month that Toronto-based Seabridge Gold recently stumbled upon a significant goldfield in northern British Columbia. The find appeared, coincidentally, after a glacier retreated. It’s estimated to contain a whopping 780 metric tons.
“There’s no question that as glaciers retreat, more ground will become available for exploration and more discoveries could be made in that part of the world,” Seabridge CEO Rudi Fronk told Kitco. The company already has the permits to begin mining.
Exploration budgets jumped
As I said earlier, we just saw an encouraging spike in the amount spent on exploration. According to S&P Global Market Intelligence, exploration budgets increased in the 12-month period, as of September, for the first time since 2012. Budgets jumped 14% year-over-year to $7.95 billion, with gold explorers leading the way. During this period, gold companies spent around $4 billion on exploration, which is roughly half the value of all nonferrous metals mining budgets.
But because exploration is getting more expensive for reasons addressed earlier, senior producers might very well decide instead to acquire smaller firms with proven, profitable projects.
This could create a lot of value for investors, so I would keep my eyes on juniors that look like targets for takeover. Dealmaking in the Australian mining industry, for example, is showing some growth this year compared to last, according to a September report by accounting firm BDO. Last year, Goldcorp finalized its deal to acquire Vancouver-based junior Kaminak Gold, and in May of this year, El Dorado announced it was taking over Integra Gold for C$590 million. I expect to see even more deals in the coming months.
In the meantime, I agree with my friend Pierre’s “absolute rule” that investors should hold between 5 and 10% gold in your portfolio. I would also add gold stocks to the mix, especially overlooked and undervalued names, and rebalance once and twice a year.
Janet Yellen’s term as Federal Reserve chair ends on February 3rd. President Trump is expected to announce the new Federal Reserve Chair very soon, perhaps even this week. He said that we’ll get to know his choice before a tour in Asia in early November. Since that has not taken place so far, we would like to prepare you for the outcomes of Trump’s possible decisions. Moreover, we will analyze which candidate would be the best for the gold market.
The list of pretenders is rather short:
- Gary Cohn;
- Kevin Warsh;
- Janet Yellen;
- John Taylor;
- Jerome Powell
We will start with Gary Cohn, as his odds are the smallest, just about 2 percent, according to PredictIt. This is because Cohn, who is the president’s chief economic adviser, has neither formal economics background nor experience in central banking. He also worked years for Goldman Sachs, making a decent fortune, which may be not welcomed in Senate, and especially not by the Democrats. Last but not least, he criticized Trump’s response to the protests in Charlottesville. It’s difficult to categorize him as hawk or dove, as very little is known about his view on monetary policy. But as he is pragmatist and stands not very far from Yellen’s stance, his choice – which is very unlikely – would not significantly affect the gold market (but there might be some volatility at the beginning until his views would become clear for the investors – and because it would surprise markets).
Kevin Warsh has greater chances – PredictIt assigns him a 11 percent probability of becoming the next Fed chair. He was an economic adviser to President George W. Bush from 2002 to 2006 and a Fed governor from 2006 to 2011, so his experience is better suited than Cohn’s. Warsh’s impact on the gold market could be significant as he is considered to be among the most hawkish of the contenders. He opposed the second round of quantitative easing, so he might try to accelerate the quantitative tightening a bit. He will also support the deregulation of the financial industry. Hence, his choice would increase the interest rates, a bearish factor for the gold prices. Indeed, when he led the polls two weeks ago, the short-term interest rates moved higher.
Janet Yellen has about 19 percent odds to be reappointed as the Fed chair. It would be in line with tradition, and we would not be surprised if Trump eventually nominates her after all this fuss. He said that he liked low interest rates, so dovish Yellen (who is actually not so dovish, given her focus on tightening) could be fine. However, Yellen’s Democratic views, opposition to less discretionary monetary policy and far-reaching deregulation of the financial sector might be serious obstacles to her being picked. Her choice would not shake the gold market, as it would keep the status quo. And from the long-term point of view, Yellen should be, well, neutral for the yellow metal, which could remain in the sideways trend (big price swings could still happen, but gold would not be likely to stay away from the current price levels for long). As the chart below shows, the price of gold is now very close to the level seen in February 2014, when Yellen was appointed.
Chart 1: Gold prices during Yellen’s term (London P.M. Fix, monthly average).

As we write these words (October 21), John Taylor’s odds are the same as Yellen’s. However, he has recently gained momentum after press reports that Stanford University economist impressed Trump and his team during a meeting at the White House. Actually, the White House spokeswoman told reporters on Friday that Trump was considering nominating John Taylor for either the Chair or the Vice Chair (and Powell for the Fed’s second top job). Taylor’s nomination would be very interesting and could have a lasting impact on the gold market. This is because he is a strong supporter of a rule-based framework for interest rates policy. Have you heard about the Taylor rule? Yup, it was created by our candidate. And the key thing is that this rule suggests that rates are still far too low. Far, far too low: according to Taylor’s model, the Fed should raise its policy rate to about 3 percent (or even higher, as there are several versions of Taylor’s rule) from 1.15 percent currently, as one can see in the chart below.
Chart 2: Actual Fed funds rate (green line) and Taylor Rule prescription (red line) over the last ten years.
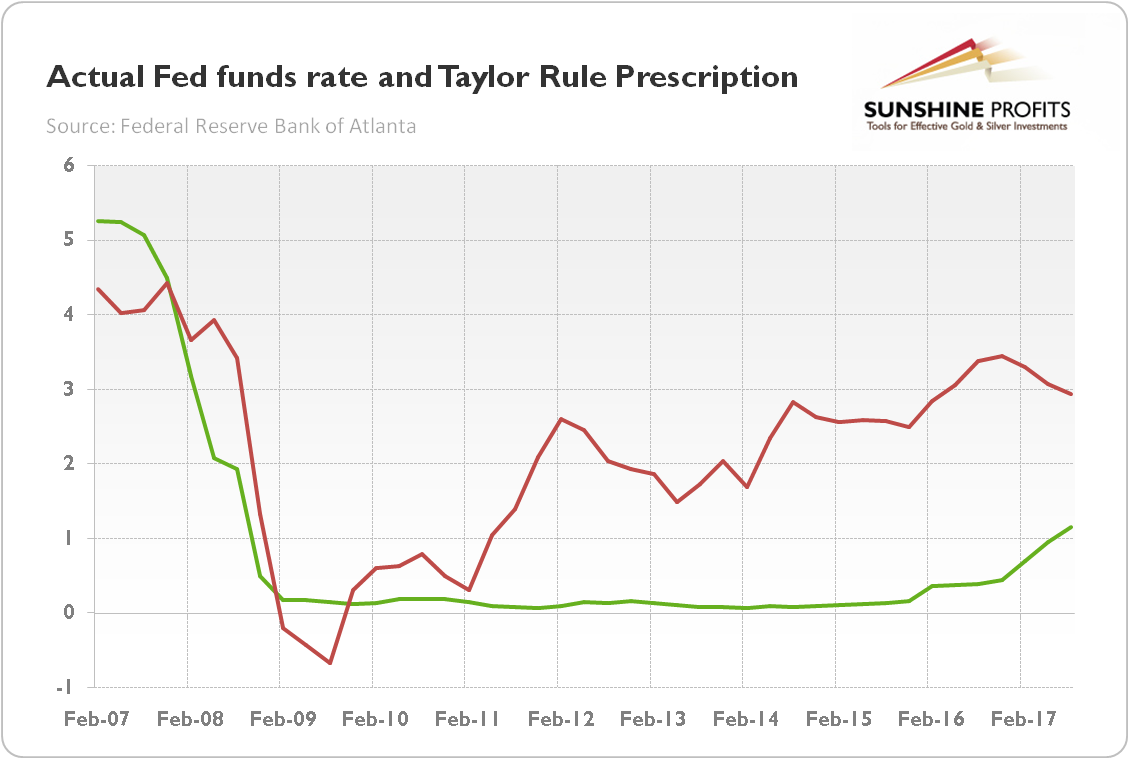
We are skeptical as to whether Taylor – if nominated – would immediately hike interest rates to the level suggested by his rule. Nevertheless, his belief in a rule-based monetary policy makes him a hawk (in the eyes of markets). Hence, his nomination would support the U.S. dollar and real interest rates, which would be bad news for the gold market.
And finally, Jerome Powell – the front-runner in the race – with odds as high as 56 percent. He is the current Federal Reserve Governor, so he has needed experience and he would provide continuity. And he is allegedly favored by Treasury Secretary Steven Mnuchin. How would his nomination impact the gold market? Well, not so much. First, he leads the polls, so that choice would not surprise the market. Second, he has been in line with Yellen. Actually, he never dissented at the Fed, so his nomination would result in a de facto keeping of the status quo. The only difference is that Yellen is a Democrat, while Powell is a Republican – but it might be crucial for Trump and his team. The brief comparison between the candidates is presented in the table below.
Table 1: Comparison between candidates for the next Fed Chair.
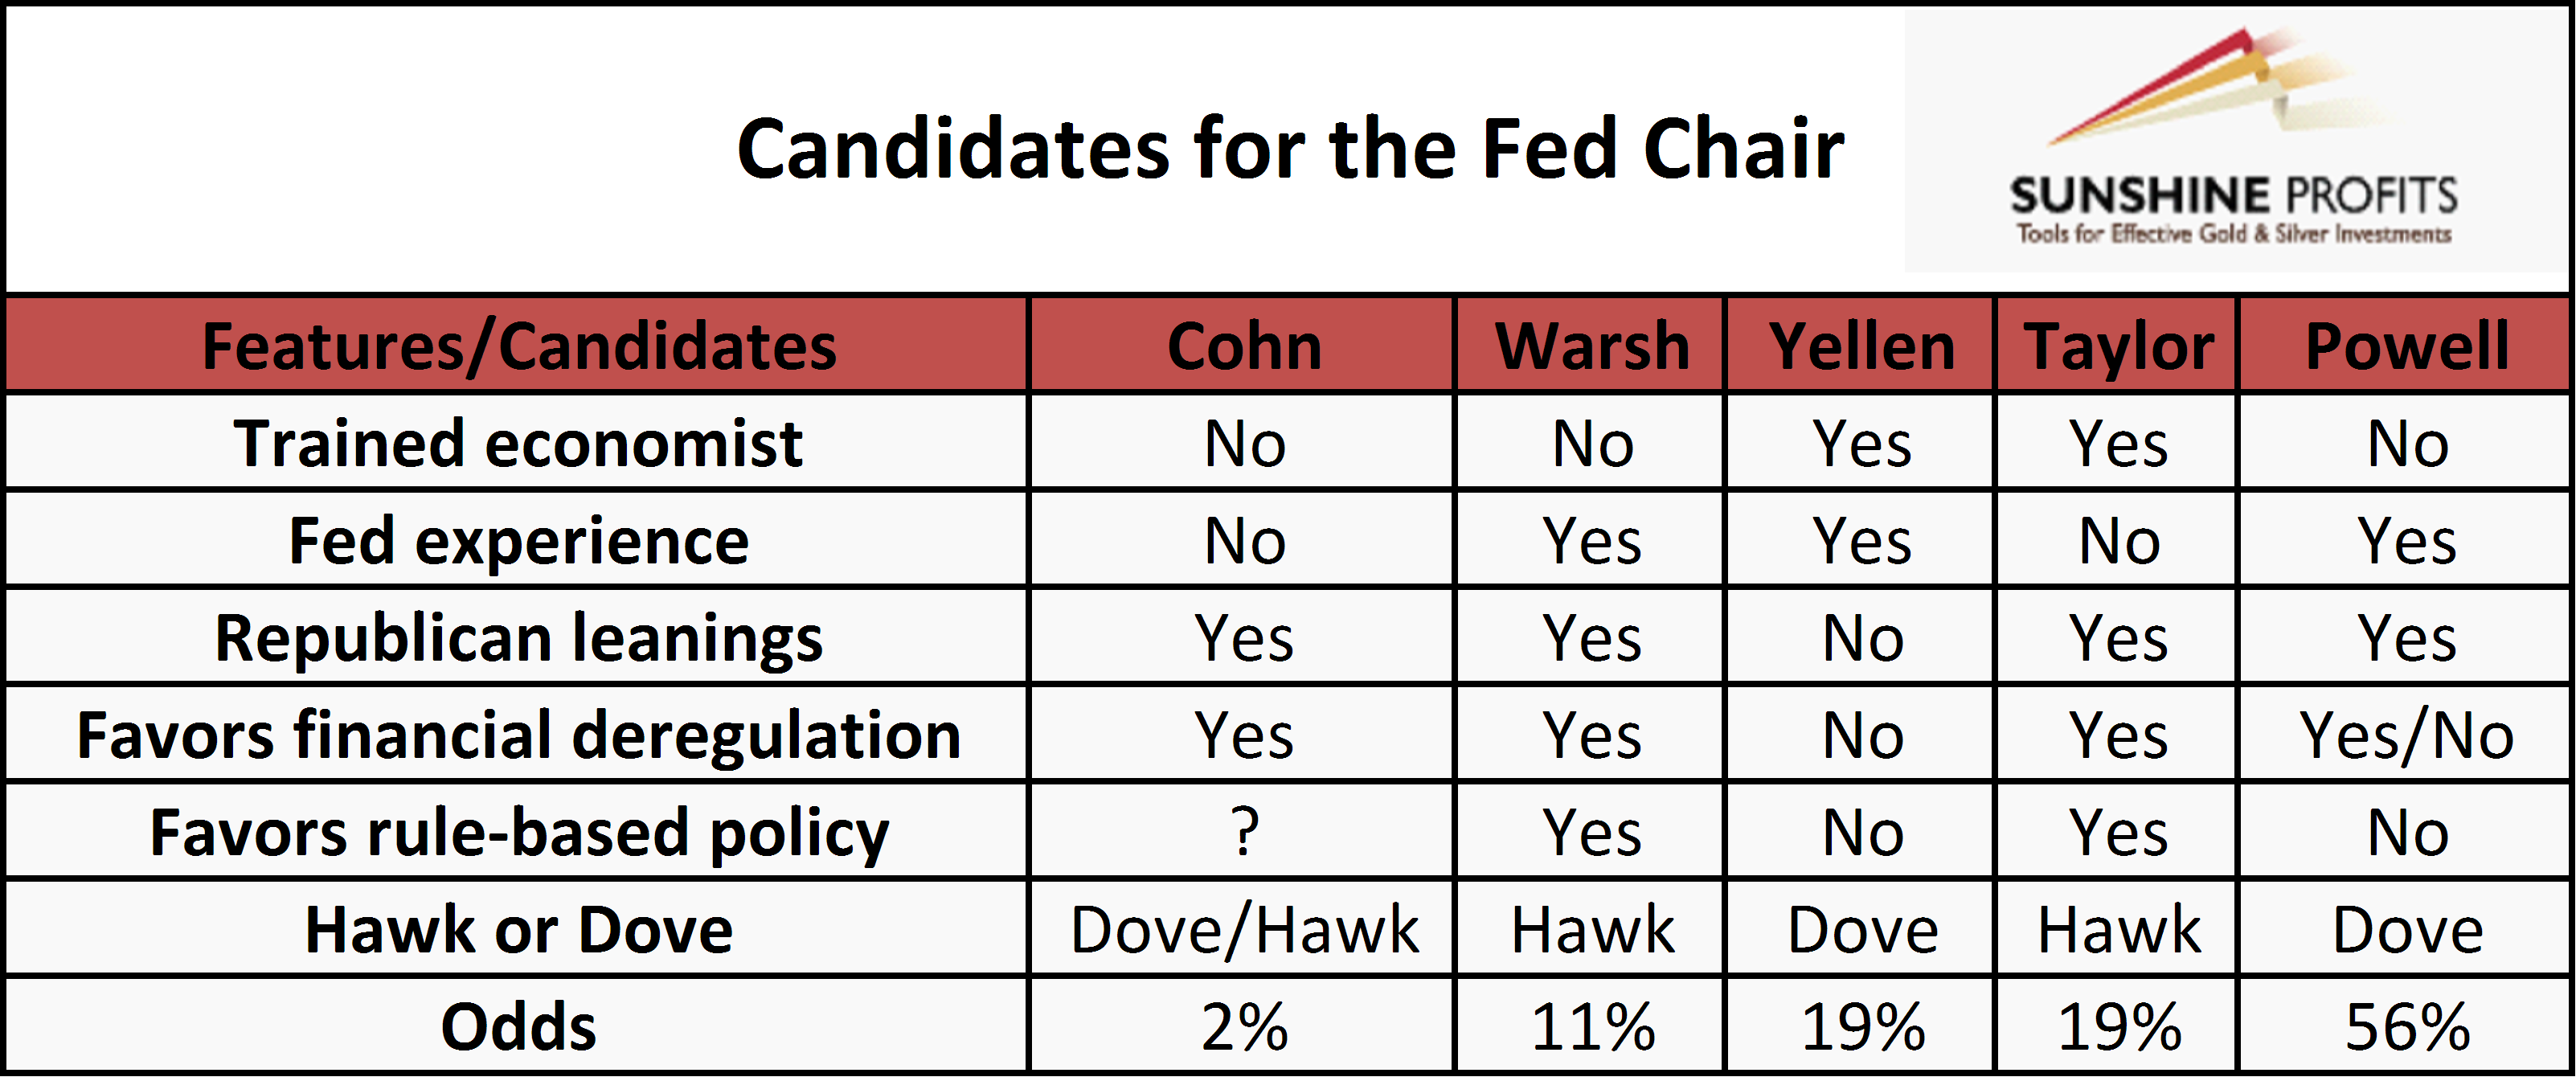
To sum up, Trump is going to announce the next Fed chair in the coming days. Taylor and Warsh are the most hawkish (the worst candidates for gold), while Yellen and Powell the most dovish (theoretically, the best for gold, but keeping the status quo should not affect the markets significantly). Cohn is somewhere in the middle, but he is practically out of the equation. Currently, Powell decisively leads (but his nomination is not a done deal). Hence, any other choice could surprise markets and affect the price of gold. Taylor is behind him and there are rumors that these two may now rule the Fed. Indeed, it makes sense: Powell as the Fed Chair could provide continuity and would continue his gradual approach to normalizing policy, while Taylor as the Fed Vice Chair would please monetary hawks and supporters of the rule-based monetary policy among Republicans. That scenario is already priced in to a significant extent, so the initial effect on the gold market may be limited. However, in the medium-term, the Fed would be more hawkish than under Yellen and Fischer, which is negative for the gold prices at the margin.
And one final remark: it is of course important who leads the Fed. But investors should not overestimate the importance of the upcoming nomination. The FOMC is a collegial body and the next Chair will face the same dilemmas as Yellen. The Fed Chair plays as the conditions allow him (or her). It may be one of the most important jobs in the world, but even the Fed chair cannot control the economy – and the broad macroeconomic outlook will be the most important driver of the gold prices. Stay tuned!
PS. At the beginning of November, Powell’s chances increased even further. His nomination will be more dovish event than Taylor’s nomination, as Powell will continue Yellen’s gradual approach to tightening and cautious approach toward monetary policy. However, investors should not forget that John Taylor is expected to become the Fed Vice Chair. Why is it important for the gold market? Well, Powell-Taylor duo will be more hawkish than Yellen-Fischer, which is not good news for the yellow metal.
If you enjoyed the above analysis and would you like to know more about the impact of the changes in the Fed’s policy on the gold market, we invite you to read the November Market Overview report. If you’re interested in the detailed price analysis and price projections with targets, we invite you to sign up for our Gold & Silver Trading Alerts. If you’re not ready to subscribe at this time, we invite you to sign up for our gold newsletter and stay up-to-date with our latest free articles. It’s free and you can unsubscribe anytime.
Thank you.
Arkadiusz Sieron, Ph.D.

-
I know Mike is a very solid investor and respect his opinions very much. So if he says pay attention to this or that - I will.
~ Dale G.
-
I've started managing my own investments so view Michael's site as a one-stop shop from which to get information and perspectives.
~ Dave E.
-
Michael offers easy reading, honest, common sense information that anyone can use in a practical manner.
~ der_al.
-
A sane voice in a scrambled investment world.
~ Ed R.
Inside Edge Pro Contributors

Greg Weldon

Josef Schachter

Tyler Bollhorn

Ryan Irvine

Paul Beattie

Martin Straith

Patrick Ceresna

Mark Leibovit

James Thorne

Victor Adair