
Gold & Precious Metals

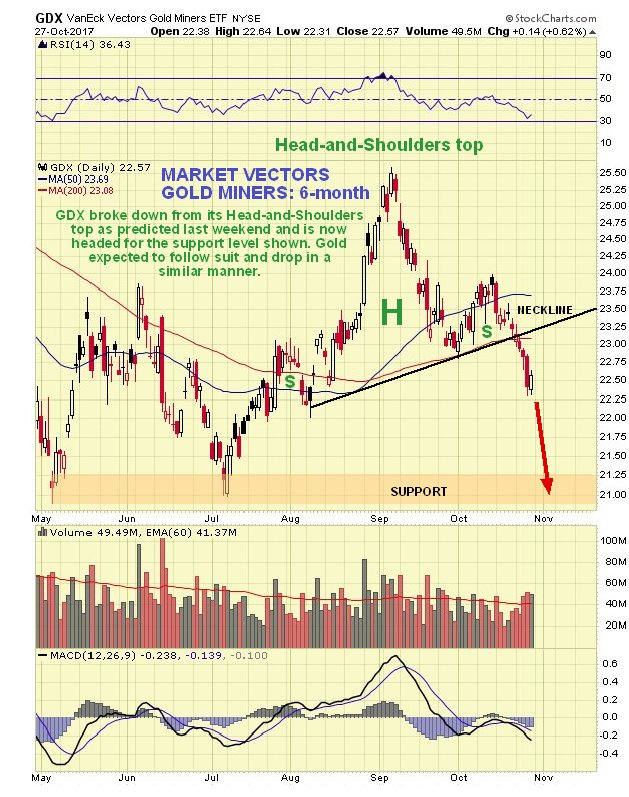
The big news last week for the Precious Metals sector was that the dollar broke out of its Head-and-Shoulders bottom to start its “Swansong Rally”, a development predicted in the last update, and for weeks before that. This caused PM sector stocks to break sharply lower, and brought gold to the point of breakdown from its Head-and-Shoulders top, as we can see on its latest 6-month chart shown below. It hasn’t quite broken down yet, but is expected to follow stocks’ lead and break down soon and head lower. Target is support in the $1200 – $1215 zone which is expected to be reached as the dollar index arrives at its upside target in the 97 area.

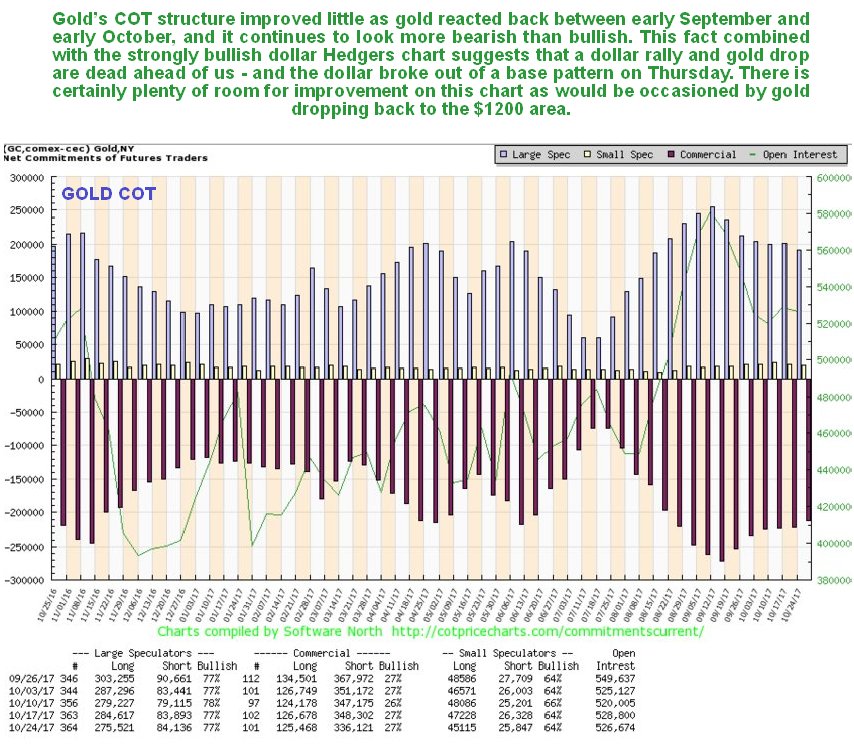
Gold’s latest COT chart shows some improvement over the past week but still looks more bearish than bullish, with a lot of room for further improvement, such as would be occasioned by a drop to the $1200 – $1215 area, which now looks imminent after last week’s dollar breakout…
Click on chart to popup a larger clearer version.
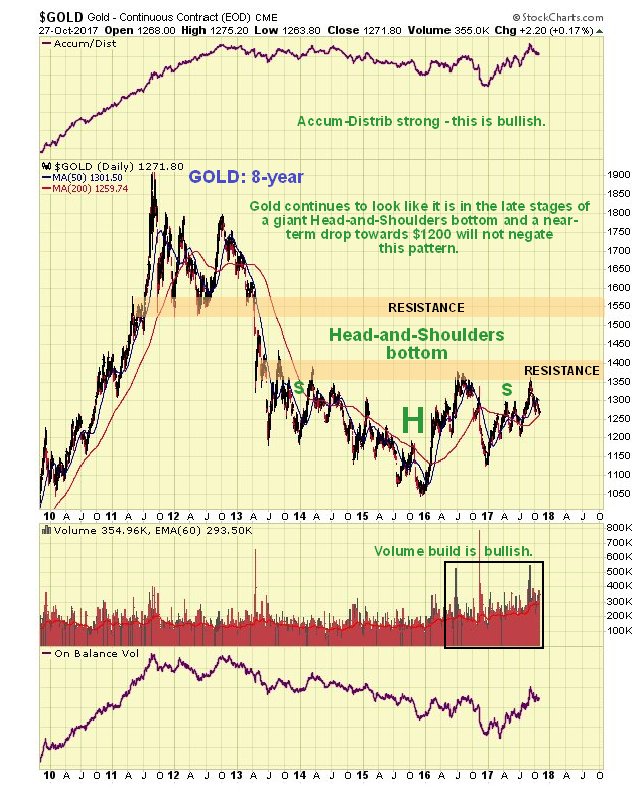
On gold’s 8-year chart it continues to look like it is in the late stages of a giant Head-and-Shoulders bottom pattern. The buildup in volume over the past 20 months certainly looks positive, especially over the past several months, all the more so because it has driven volume indicators higher, notably the Accum-Distrib line, which is not far off making new highs – exceeding its level at the 2011 peak. Once gold breaks above the resistance level approaching $1400 it will be on its way, although it will then have to contend with another important band of resistance in the $1510 – $1560 range. A near-term retreat by gold to the $1200 – $1215 area in the face of a dollar rally will not damage this long-term technical picture.
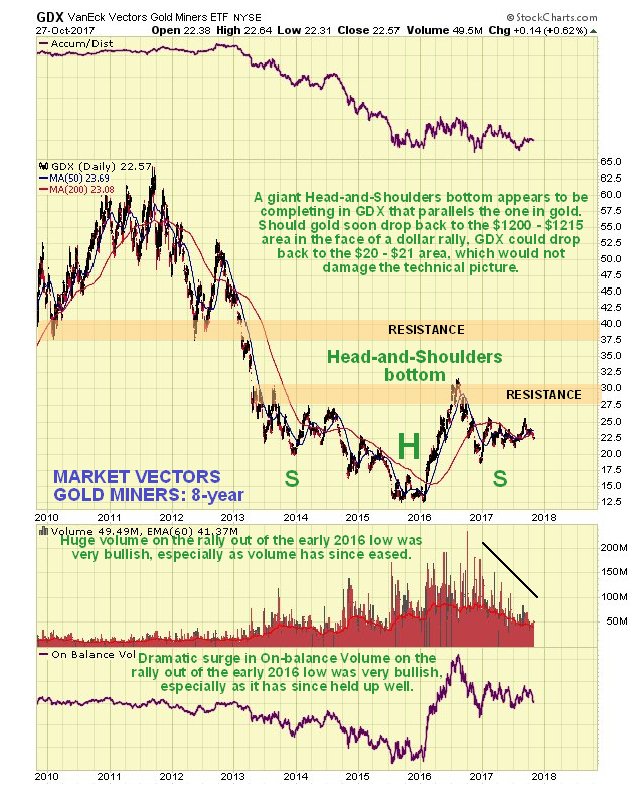
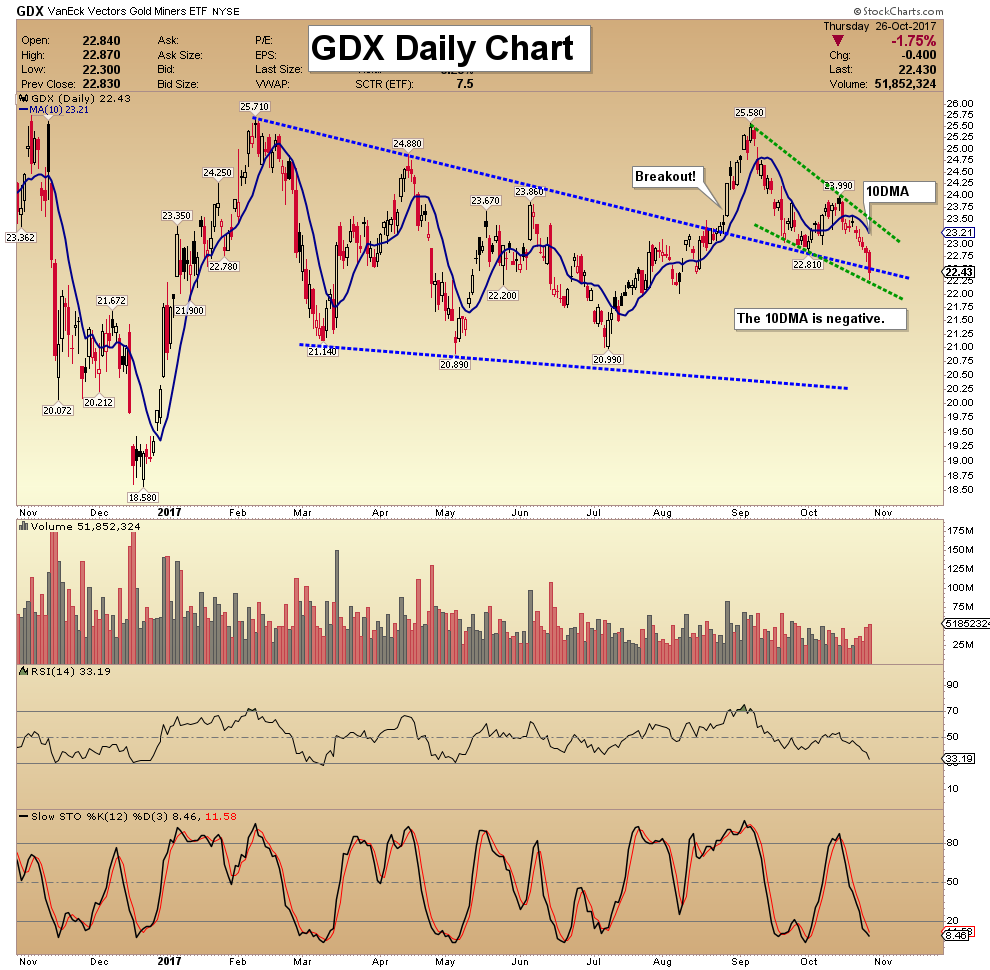
The Market Vectors Gold Miners, GDX, which functions as a gold stocks index, is marking out a giant Head-and-Shoulders bottom that roughly parallels the one completing in gold itself. A near-term decline to $20 – $21 in GDX will be viewed as presenting another important buying opportunity for the sector. The volume pattern during the build out of this base pattern is very bullish, with big volume on the rise out of the low (Head) of the pattern, tailing off steadily as the Right Shoulder has formed.
GDX broke down from its upsloping Head-and-Shoulders top last week, as predicted in last weekend’s update, which actually occurred ahead of the dollar breakout. When the dollar did break out, it accelerated away to the downside, as we would expect. It is targeting the $21 area on the dollar index rally to the 97 zone and may go a little lower.
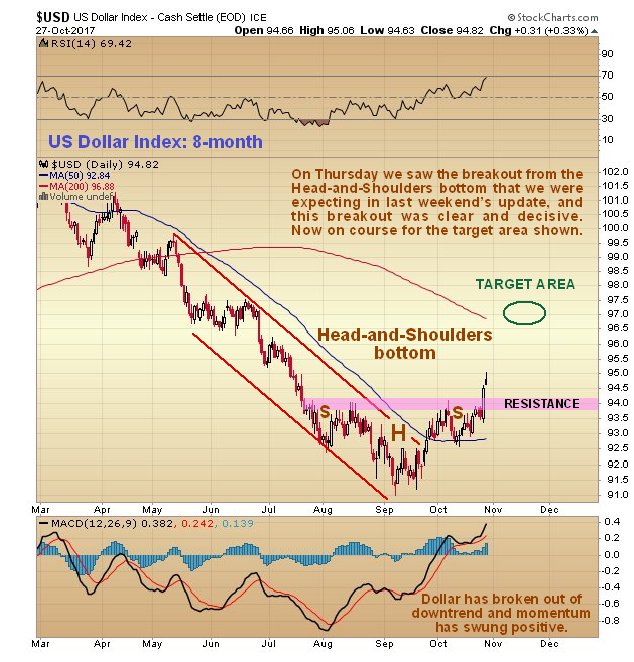
Turning to the dollar now, it staged a convincing breakout on Thursday from its Head-and-Shoulders bottom, a development we had been expecting for some considerable time, as can be seen on its latest 8-month chart below. Fundamental reasons for this appear to be a combination of a short period of mildly rising interest rates in the US coupled with the possibility of a euro meltdown if Catalonia succeeds in becoming independent from Spain. European elites are ganging up on Catalonia and threatening to economically blockade it if it goes ahead, since they do not want devolution and diminution of their power and privilege, and if Catalonia succeeds, the floodgates will open and the European Union will disintegrate, which is going to happen one day anyway, and Spain itself may resort to crude physical force in an attempt to impose its will, which could have unforeseen consequences. A logical target for this “Swansong Rally” is the 97 area on the index, where there is resistance near to the falling 200-day moving average. After reaching this target it should churn for a while and then drop away again.
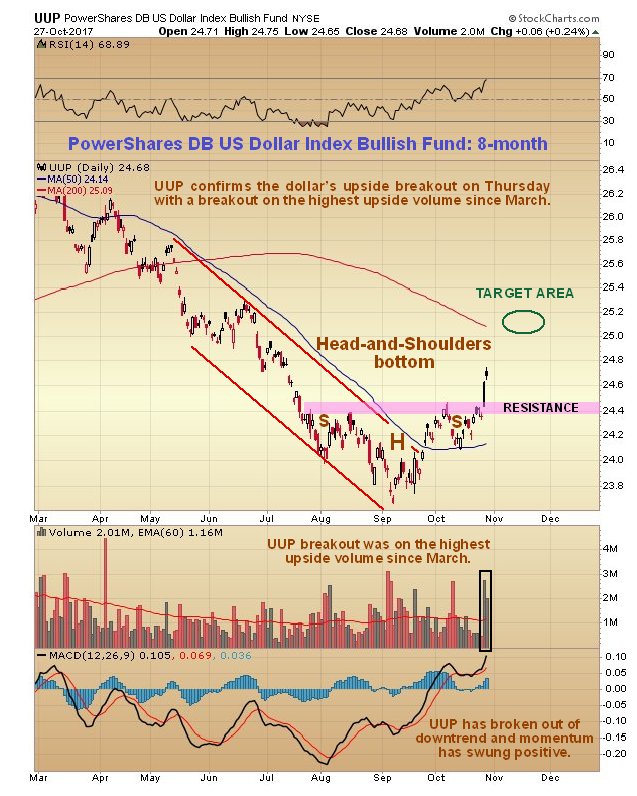
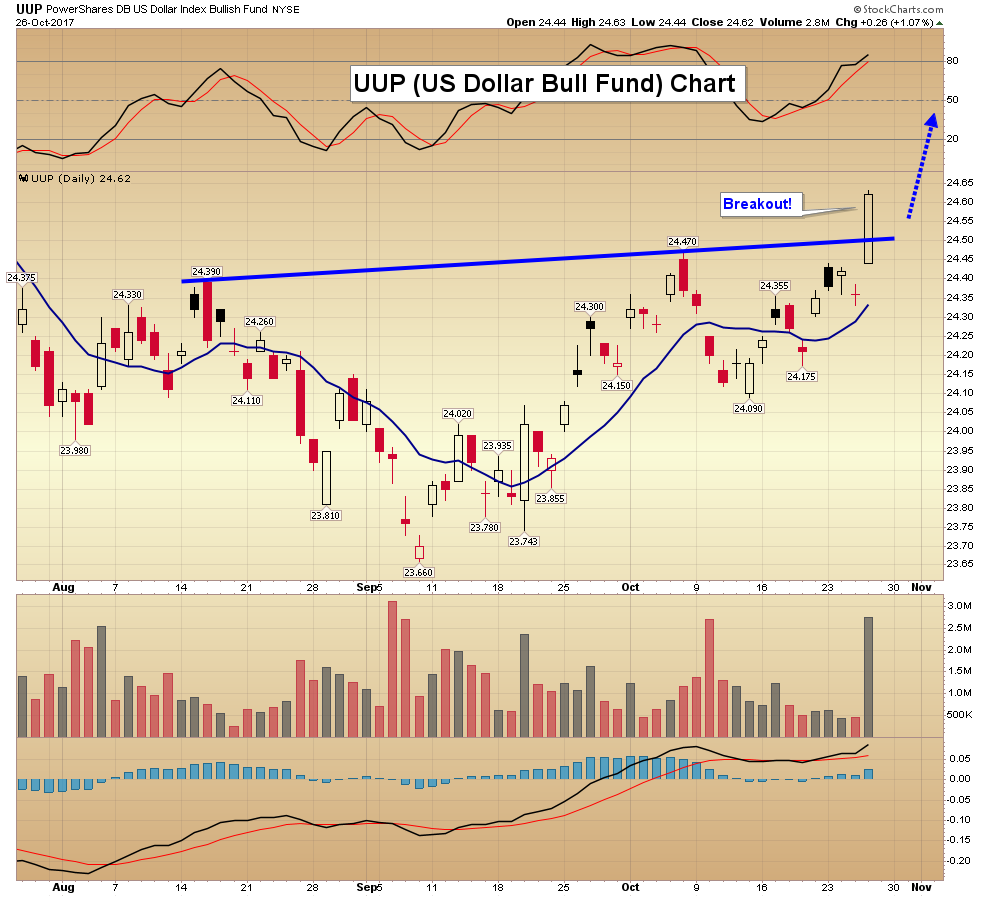
It is worth looking also at the 8-month chart for dollar proxy UUP, because we can check the volume on Thursday’s breakout, which aids in assessing its validity. As we can see, volume was heavy on this breakout, the highest upside volume for over 6 months, which is a strong indication that the breakout was valid.
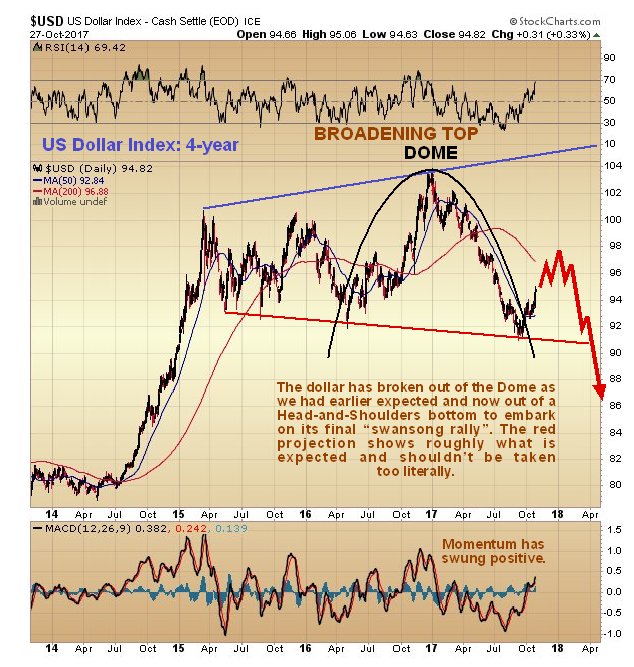
On the 4-year chart for the dollar index we can see how, after contacting the lower boundary of a large Broadening Formation and breaking out from the Dome that had earlier forced it lower, it has started to trend higher again within the Broadening Formation, having just broken out of the Head-and-Shoulders bottom that we looked at above and that we can just make out on this chart. It is thought unlikely that this this rally will get above the 97 area where there is resistance, although there is some chance it could make it to the mid-point of the pattern at about 99.
The Hedgers chart has been warning for weeks that the dollar will reverse and rally, as has been pointed out repeatedly. The latest chart shows that the rally just getting started with Hedgers positions at levels that have in the past led to significant rallies.
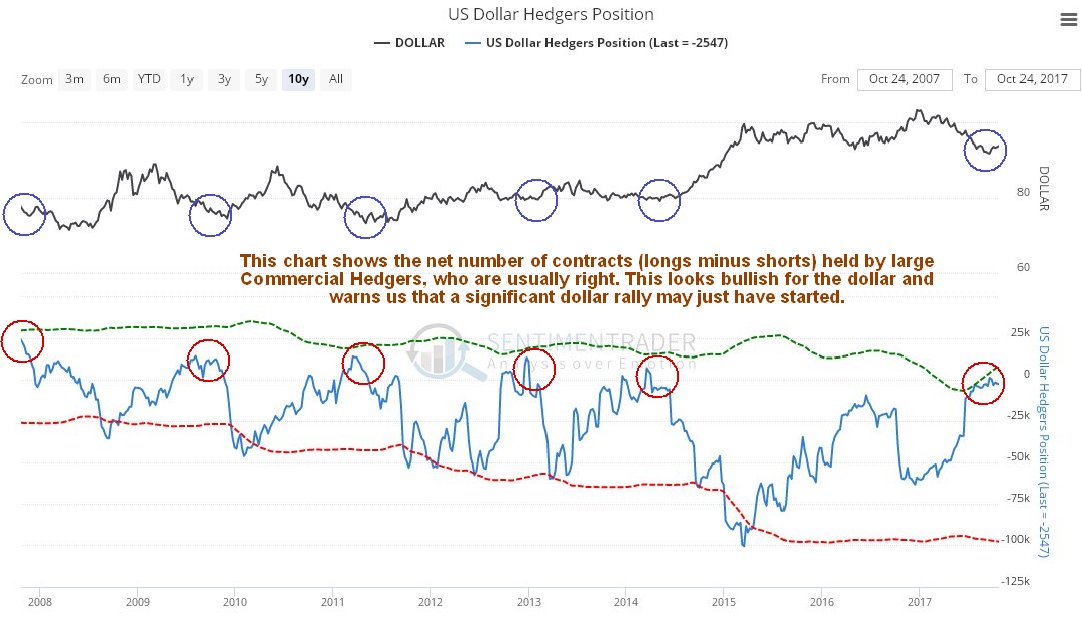
Click on chart to popup a larger clearer version.Chart courtesy of www.sentimentrader.com
Rates cannot rise much in the US because of the crushing debt levels, so the current trend for rising rates there is unlikely to carry far before it peters out, and then the dollar should be beaten back down again, with a big reason being China’s move to exit the Petrodollar via its Yuan oil futures contract convertible into gold and the general move by those world powers big and strong enough to deter US military aggression, such as China and Russia, to de-dollarize, a big reason for which being that these countries are fed up with bankrolling US military adventurism and dominance as made plain in just 5 minutes by Max Kaiser in On path to de-dollarization. On the geopolitical front there are big changes afoot which will have a major bearing on the price of gold, which would explain why a giant base pattern is slowly approaching completion. As mentioned above, Madrid and the European Union are united in their intention to crush the Catalonian drive for independence, and water down the British Brexit, because they don’t want to cede their centralized power which provides, in the case of the European elites, massive salaries and privileges including exclusive shopping areas etc. and the ability to remotely control every aspect of their citizens’ lives via literally thousands of rules and regulations. If Catalonia succeeds, the floodgates will open as there are a host of other regions who might try their luck, like the Basque Country, Flanders and Northern Italy to name just three. Meanwhile, in the US, and especially elsewhere, it is not possible for any truly educated person to have any respect at all for Donald Trump. His continual crass, contradictory and intemperate behavior could perhaps be excused if he hadn’t got down on bended knee before the Deep State and Military Industrial complex and reneged on almost every promise he made to his supporters and the American people in the run up to his election, within 8 months of becoming President. One of the latest examples of his subservience to his Masters is reneging on the nuclear agreement between Iran and many countries including the US, or rather getting Congress to do this, in order to pave the way for sanctions and possibly military aggression against Iran, a long cherished objective of the Neocons and that little country in the Mid-East that controls the US. Most of what are called his “base” are too brainwashed by the mainstream media and ignorant regarding what has happened since he took office to realize this of course, otherwise they’d really be up in arms. The man is a buffoon and a marionette of the powerful vested interests that really control the US and would be more at home in a casino than supposedly running a country. In stark contrast Vladimir Putin is a true strongman and a statesman, who on the one hand has skillfully resisted being goaded into military conflict by the US, but on the other has stepped in boldly and decisively to block the Neocon’s plot to overthrow the democratically elected government of Syria in pursuit of their geopolitical objectives. Instead of informing the general public about what is really going on in the world, the mainstream media in recent weeks have served up an endless stream of irrelevant drivel about the womanizing excesses of movie director Harvey Weinstein – who cares? – this sort of thing has been going on in Hollywood since the movie industry started, for 80 years or more. This is how it works – a would-be lead actress enters the director’s office, who says to her “I know how much you want this lead role, my dear, but – you know what it takes…” “Oh sure I do” she replies “and I really don’t mind because, as it happens, I have a penchant for arrogant, domineering, overweight, swarthy old gentlemen like yourself, especially when they have a powerful sounding name and run a movie studio”. Apparently though, Weinstein would not take “no” for an answer on those occasions when his advances were rebuffed and forced himself on a number of the young women – they should have gotten together and outed him, but they wouldn’t because they put their careers first – if they had he could have been stopped years ago. As for the Las Vegas massacre that was an obvious “False Flag” incident – a step on the long road to disarming the American public, and the supposed attacker conveniently didn’t live to tell any tales, like Lee Harvey Oswald. With respect to the files on JFK being released – it only took 50 years, and that isn’t all of them, and they’ve been redacted, which we can take to mean stripped of anything incriminating, at least to anyone now alive – and in any case who in their right mind would want to wade through thousands of pages of this irrelevant and outdated garbage?Larry Edelson of Weiss Research has repeatedly pointed out that there is a confluence of various war cycles converging to reach a peak in 2019 – 2020 and it is clear that we are entering a very dangerous phase in world history. This is because the US Neocon Empire faces financial strangulation, as the dollar is usurped from its role as the global reserve currency – starved of funds it will grind to a halt – it will no longer be possible to wage various overseas wars and maintain a network of hundreds of military bases around the world. They will therefore be tempted to use force to achieve their geopolitical objectives before this happens – and the clock is ticking with the Yuan futures contracts for oil, convertible into gold, in the pipeline – they will probably start with Iran, and maybe North Korea, or both, which are relatively soft targets, although this unfortunately might involve some “collateral damage” in South Korea. The Neocons, who are largely humorless power-crazed old men (one thing they did break into a chuckle over during the 1st Iraq war was “the luckiest man in Iraq”, a truck driver who had just crossed a bridge before it got blown to pieces by a smart bomb), regard ordinary human beings much as you might think of an ant or a termite, as unimportant and expendable, and in the sense that the world is overpopulated and in need of a cull they could perhaps be considered correct.Where were we? – Oh yes, gold. Short to medium-term outlook down to $1200 – $1215 area as dollar rally plays out, then turning up to break out of the giant base pattern shown on the 8-year chart above as the dollar rolls over and tips into a severe and possibly terminal bearmarket as the era of dollar dominance finally comes to an end.
End of update.

Today’s videos and charts (double click to enlarge):
SFS Key Charts & Video Update


SF60 Key Charts & Video Update


SF Juniors Key Charts & Video Analysis


SF Trader Time Key Charts & Video Analysis


Morris
| Friday, Oct 20th 2017 Super Force Signals Send an email to trading@superforcesignals.com |

Michael has twisted arms again over at Eric Coffin’s HRA newsletter and arranged for a fantastic opportunity for you to try a 3 month subscription for only $7 – that is only 10% of the regular price.
Eric’s list of winners over the past two years is impressive – takeouts like Silvercrest (SVL), Reservoir (RMC) and Kaminak (KAM) – base metals runs like Excelsior (MIN) and much much more.
Take a spin – it’s only $7!

-
I know Mike is a very solid investor and respect his opinions very much. So if he says pay attention to this or that - I will.
~ Dale G.
-
I've started managing my own investments so view Michael's site as a one-stop shop from which to get information and perspectives.
~ Dave E.
-
Michael offers easy reading, honest, common sense information that anyone can use in a practical manner.
~ der_al.
-
A sane voice in a scrambled investment world.
~ Ed R.
Inside Edge Pro Contributors

Greg Weldon

Josef Schachter

Tyler Bollhorn

Ryan Irvine

Paul Beattie

Martin Straith

Patrick Ceresna

Mark Leibovit

James Thorne

Victor Adair