
Gold & Precious Metals

In China, nearly all physical gold supply flows through the Shanghai Gold Exchange (SGE). Likewise, nearly all gold demand in China is met by physical gold withdrawals from the Shanghai Gold Exchange’s nationwide network of precious metals storage vaults.
Therefore, using the broadest definition of gold demand, SGE gold withdrawals are a suitable proxy for overall gold demand in China. This gold demand can be labelled as “Chinese Wholesale Gold Demand” and comprises two main categories, namely, consumer gold demand and institutional gold demand. Consumer gold demand generally refers to gold jewellery fabrication demand, retail physical gold bar and coin demand, and in some cases also includes industrial fabrication demand. Institutional demand can be viewed as individual and institutional investor purchases of gold bullion directly on the SGE trading bourse, and withdrawal of this gold from the SGE vaults.
SGE gold withdrawals for 2016 totalled 1970 tonnes. Although this was 24% lower than 2015’s record 2596 tonnes of SGE gold withdrawals, it was still in line with 2014’s total of 2102 tonnes of gold withdrawals
Contents
Highlights
-
The vast majority of overall gold demand in China is met by gold withdrawals from the Shanghai Gold Exchange (SGE).
-
This ‘Wholesale’ gold demand consists of 2 main components, namely consumer gold demand and institutional gold demand.
-
Institutional gold demand is a term used to reflect direct purchases of physical gold on the SGE by both institutions and individuals with SGE trading accounts.
-
Western precious metals consultancies are infamous for only reporting consumer gold demand (gold jewellery fabrication, gold bar and coin demand, and industrial gold demand), and by and large ignoring direct purchases of gold on the SGE.
-
Western precious metals consultancies therefore vastly understate the true magnitude of gold demand in China, which, based on SGE gold withdrawals, is far larger than the consumer demand figures would suggest.
Chinese Wholesale Gold Demand
Controversially, a number of Western precious metals consultancies, such as the World Gold Council, limit their definitions of Chinese gold demand solely to consumer gold demand.
For example, for 2016, the World Gold Council (which uses gold demand data collected by consultancy Metals Focus) reported Chinese gold demand of 913.6 tonnes, comprising jewellery demand of 629 tonnes, and gold bar and coin demand of 284.6 tonnes. This total is less than half of total SGE gold withdrawals for 2016.

What these consultancies methodologies fail to take into account, however, is that direct purchases of gold by institutions and individuals with trading accounts on the Shanghai Gold Exchange represent a substantial additional component of overall Chinese gold demand above and beyond consumer gold demand.
BullionStar Gold University article “Mechanics of the Chinese Domestic Gold Market” illustrates that a series of simple equations generally hold true for gold supply and demand in the Chinese gold market, and that any comprehensive definition of true Chinese gold demand must take into account both consumer gold demand and direct purchases of gold at the SGE.
Specifically:
SGE Physical Gold Supply = SGE Gold Withdrawals = Chinese Wholesale Gold Demand
On the Supply side:
SGE Physical Gold Supply = Gold Imports + Domestic mine gold supply + Gold Scrap / Recycling + Disinvestment + Recycled Distortion
Here, disinvestment refers to the sale of gold which was previously purchased directly for investment. Recycled distortion is a term that refers to recycled gold that is not scrap and that is not disinvestment. An example would be process scrap. Recycled distortion flowing through the SGE vaults overstates both the supply and demand sides of the equation, and needs to be subtracted from SGE withdrawals since it could be scrap that re-entered the supply chain.
When Recycled distortion is subtracted from SGE withdrawals, the result can be viewed as ‘True Chinese gold demand’.
On the Demand side:
Chinese Wholesale Gold Demand = Consumer Demand + Institutional Demand + Recycled Distortion
where Institutional Demand = Direct Gold Purchases At The SGE
SGE Gold Withdrawals – Recycled Distortion = “True Chinese gold demand”
and “True Chinese Gold Demand” = Consumer Demand + Institutional Demand
As a reminder, standard gold ingots and bars are VAT exempt when sold on the SGE but not when sold outside the SGE (off SGE). In contrast, non-standard gold is VAT exempt when sold outside the SGE, and non-standard gold cannot be traded on the SGE.
Standard gold refers to gold ingots of 1 kg, 3 kg (both 999.9 fine), and 12.5 kg (995 fine) weights, and also gold bars of 0.1 kg and 0.05 kg (both of which 999.9 fine). An example of non-standard gold would be a 0.2 kg (200 gram) gold bar.
Direct Gold Purchases at the SGE
Given that ‘True Chinese Gold Demand’ comprises both consumer demand and institutional demand, it’s important to look beyond the consumer demand categories of gold jewellery fabrication, gold bar and gold coin demand and industrial fabrication, and to also examine the ‘institutional demand’ category, i.e. a category which really refers both individual and institutional direct purchases of gold on the SGE.
The following bar chart graphically captures both the supply side and demand side components of the domestic Chinese gold market. The gold supply side comprises gold mine output, gold imports, scrap, disinvestment and recycled distortion. The gold demand side comprises jewellery demand, coin and bar demand, and industrial demand (all of which are consumer related), a recycled distortion component which is the same size as on the supply side, and also direct gold buying on the SGE (institutional demand).

From the above bar chart, it can be seen that the main reason why annual gold demand, as defined by precious metals consultancies, is far lower than the size of SGE withdrawals each year is because these consultancies only estimates consumer gold demand and ignores institutional demand.
By ignoring institutional demand, which is essentially investment demand, the consultancy data is vastly underestimating investment demand for gold in China. The Western consultancy data is therefore incomplete and is not an accurate representation of full gold supply and demand in China
On a cumulative basis from January 2007 to September 2016, the difference between SGE gold withdrawals and GFMS gold demand reaches a massive 5922 tonnes of gold, as can be seen in the following chart:

It’s interesting to note that the China Gold Association (CGA) defines the difference between Chinese total gold demand and Chinese consumer gold demand as ‘Net Investment’. i.e.:
Net Investment = SGE Withdrawals – Consumer Demand
Net Investment = Institutional Demand + Recycled Distortion
The composition of ‘Direct Purchases on the SGE‘ is also illuminating. In China, anyone can open an account and buy gold directly on the Shanghai Gold Exchange. This includes individual citizens and wholesale enterprises such as jewelry manufacturers and bullion banks. About 50% of SGE gold withdrawals are from wholesale gold manufacturers/fabricators. The other 50% of SGE gold withdrawals are from individual and institutional customers who purchase gold on the SGE and then withdraw it from the SGE vault network.
Chinese Commercial Bank Balance Sheets
According to Macquarie Research, by the end of 2016, there were over 3000 tonnes of gold accumulated on the balance sheets of Chinese commercial banks.
Although there is little transparency into why these commercial banks are holding gold on their balance sheets, these banks do, to various extents, report gold holdings in their accounts, although the reporting is not generally granule in nature. It is also not clear how much these commercial bank gold activities influence SGE gold withdrawals.
Koos Jansen of BullionStar has analysed a number of these bank statements, and reveals that some reasons for holding this gold on their balance sheets is as follows:
- Gold savings belonging to banks’ customers
- Gold inventory held for banks’ retail gold businesses
- Gold held as part of gold leasing operations
- Gold held for hedging purposes
- Gold held outside China
The first component, gold savings or gold deposits, represents customer gold held in Gold Accumulation Plans (GAPs) operated by these the banks. Bank customers have a claim on this gold and so it is a liability of the bank, but the bank also records the same gold as an asset on its balance sheet. Some of the banks offering GAPs in China include ICBC, China Construction Bank, and Bank of China. For example, as of the end of 2014, ICBC held GAPs representing more than 250 tonnes of gold, and GAP customers in excess of 1 million.
In the second component, since Chinese banks offer an array of retail gold investment products through their branch networks and also via the internet, these banks need to hold their own gold inventory held to back up these activities. This is also reflected on Chinese bank balance sheets as an asset.
Thirdly, Chinese banks, such as Bank of Communications and Shanghai Pudong Development Bank, are involved in the gold leasing market, and they record this gold leasing / and gold interbank lending activity on their balance sheets. As to how much of this gold leasing business represents SGE gold withdrawals is unclear, but much of the interbank leased gold probably stays within the SGE vaulting network.
References and Links
1.^ “An update on SGE Vault Withdrawals and SGE Price Premiums”, BullionStar blog, May 2017 https://www.bullionstar.com/blogs/ronan-manly/update-sge-vault-withdrawals-price-premiums/
2.^ “Spectacular Chinese Gold Demand 2015 Fully Denied By GFMS And Mainstream Media”, BullionStar blog, August 2016 https://www.bullionstar.com/blogs/koos-jansen/spectacular-chinese-gold-demand-2015-fully-denied-by-gfms-and-mainstream-media/
3.^ “Mechanics of the Chinese Domestic Gold Market”, BullionStar Gold University https://www.bullionstar.com/gold-university/the-mechanics-of-the-chinese-domestic-gold-market
4.^ “The Great Physical Gold Supply & Demand Illusion”, BullionStar, October 2016 https://www.bullionstar.com/blogs/koos-jansen/the-great-physical-gold-supply-demand-illusion
5.^ “Reconciliation and discrepancies of gold flows into China”, Maquarie Research presentation to LBMA, October 2016 http://www.lbma.org.uk/assets/events/Conference%202016/S4_Turner.pdf
6.^ “What Are These Huge Tonnages In “Precious Metals” On Chinese Commercial Bank Balance Sheets?” BullionStar blog, August 2016 https://www.bullionstar.com/blogs/koos-jansen/what-are-these-huge-tonnages-in-precious-metals-on-chinese-commercial-bank-balance-sheets/


The Next Phase in Gold’s Seasonality
Once again gold is entering an important seasonal juncture. In the best of years gold picked up momentum coming out of August (1977, ’78, ’79, ’80, ’82, ’86, ’01, ’02, ’03, ’04, ’05, ’07, ’09, ’10 & ’12). The rallies generally took prices higher into October and occasionally beyond.
Every instance since 1975 that September exceeded the high of the last complete week of August (i.e. last week; Aug 21st-25th) it needed to hold that week’s low. Any breakout that reversed through that support went on to make lower lows (2000, 2006, 2011 & 2016). Last year is a prime example. Prices made new highs on the week of September 9th, violated the $1321 low on September 13th and then dropped to $1125 by December.
Although prices are through the resistance line from the all-time high, any movement through last week’s high means that it is time for traders to place tight stops below last Friday’s low.

CHARTWORKS – 8/27/2017

Opinions in this report are solely those of the author. The information herein was obtained from various sources; however, we do not guarantee its accuracy or completeness. This research report is prepared for general circulation and is circulated for general information only. It does not have regard to the specific investment objectives, financial situation, and the needs regarding the appropriateness of investing in any securities or investment strategies discussed or recommended in this report and should understand that statements regarding future prospects may not be realized.
Investors should note that income from such securities, if any, may fluctuate and that each security’s price or value may rise or fall. Accordingly, investors may receive back less than originally invested. Past performance is not necessarily a guide to future performance. Neither the information nor any opinion expressed constitutes an offer to buy or sell any securities or options or futures contracts. Foreign currency rates of exchange may adversely affect the value, price or income of any security or related investment mentioned in this report. In addition, investors in securities such as ADRs, whose values are influenced by the currency of the underlying security, effectively assume currency risk. Moreover, from time to time, members of the Institutional Advisors team may be long or short positions discussed in our publications.
BOB HOYE, INSTITUTIONAL ADVISORS EMAIL bhoye.institutionaladvisors@telus.net WEBSITE www.institutionaladvisors.com
CHARTWORKS – 8/27/2017
We started employing analog charts during the latter stages of the seemingly forever bear market in precious metals. Comparing current to past trends by using price data is not considered technical analysis but it is extremely valuable because history tends to repeat itself. It also helps us identify extremes as well as opportunities. For example, in 2015 it was clear the epic bear market in gold stocks was due for a major reversal. Today, precious metals appear to be in the early innings of a cyclical bull market and the analogs suggest there is plenty of room to run to the upside.
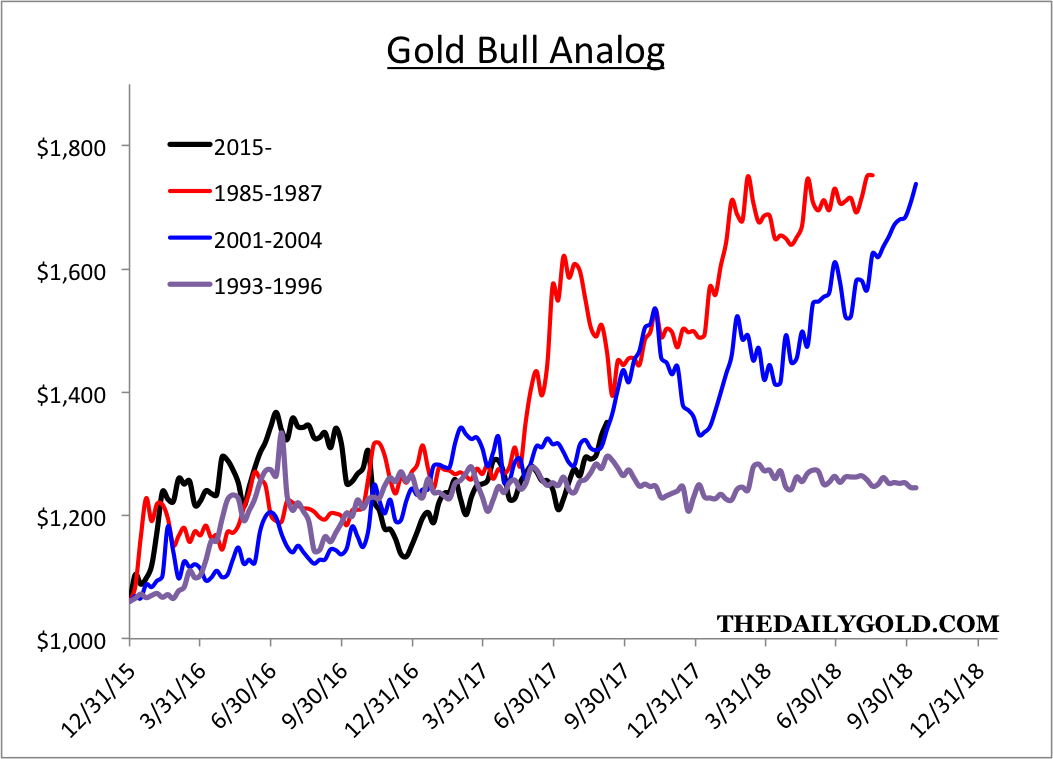
The first chart compares the current recovery in Gold to past recoveries. In recent quarters we had anticipated a similar, explosive rebound like in 2008 and 1976. However, with 18 months of evidence we can now say the current rebound most resembles the rebounds that started in 1985 and 2001. Both of those rebounds imply Gold could reach $1700/oz by Q4 of 2018. However, if Gold cannot takeout the resistance around $1375 then it could end up following the path of the 1993 rebound.
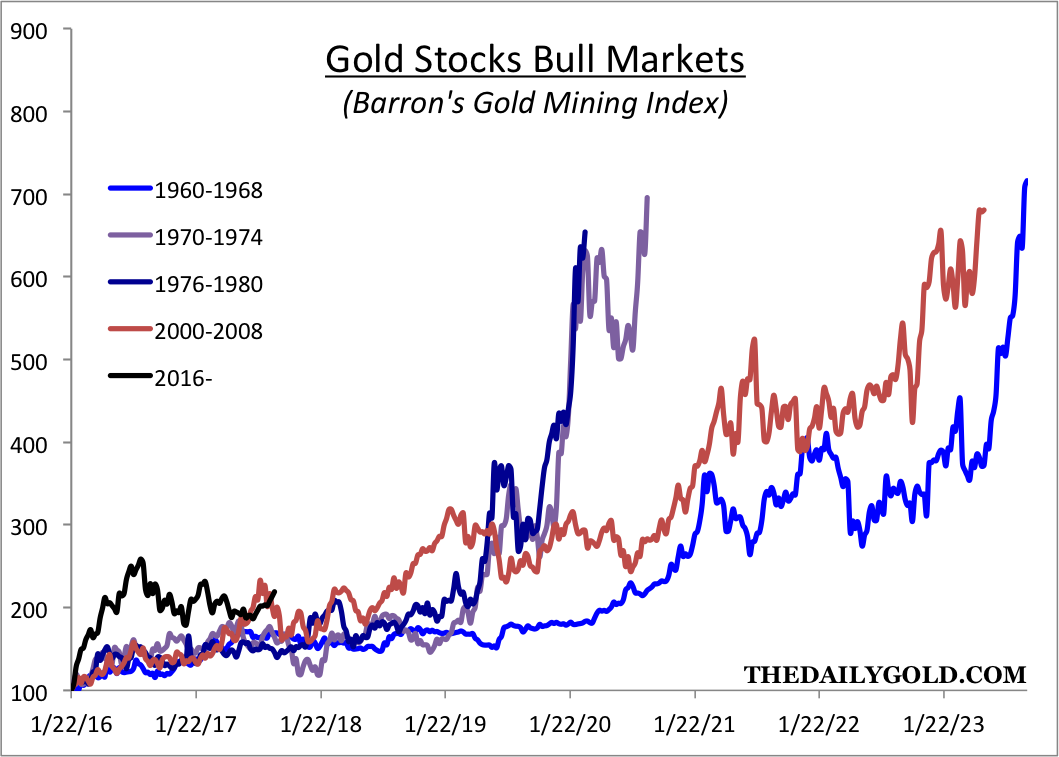
Next we look at the large cap gold stocks. The data is from the Barron’s Gold Mining Index (BGMI) which is one of the few indices with a multi-decade history. If one were to look at the HUI or GDM (parent index of GDX) it would show the gold stocks are currently behind the rebound that began in the fourth quarters of 2000 and 2008. Data from the BGMI implies the rebound in gold stocks is ahead of schedule. In a broader sense, the BGMI certainly has plenty of room to run as many of its bull markets have achieved 7-fold returns.
Next is an analog constructed from data from my custom junior gold indices. The juniors are currently right at the point where the 2001-2007 bull made a massive move higher over the next 12 months. The two bulls for comparison are a very long cycle (+6 years and less than 3 years). At worst, I’d expect this bull to last somewhere in between. If Gold makes a clean break above $1375/oz then I’d expect this bull to advance to the 14x peak the other bulls achieved before 2019.

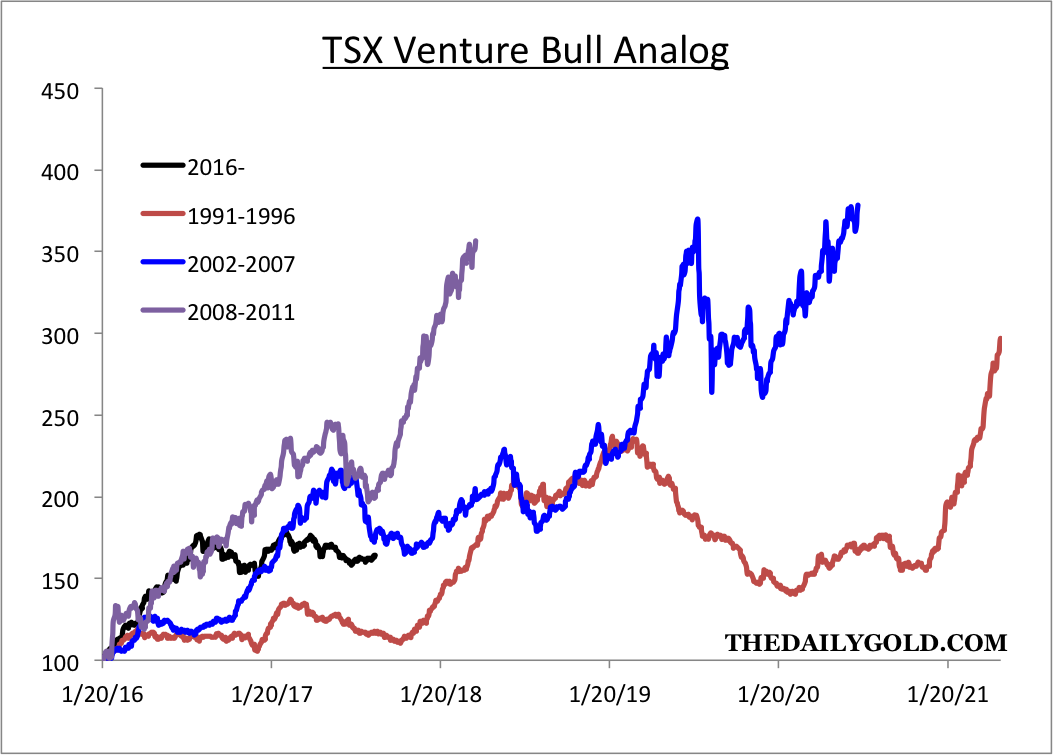
Finally, here is the TSX Venture Index. The three previous bulls averaged close to a 250% gain. The current bull is up roughly 60%. The gains for the overall index are muted as the index contains a large amount of worthless companies. Nevertheless, the bull market has plenty of room to run in terms of time and price.
The analogs show that the current bull market in Gold, gold stocks and juniors is obviously in the early innings in both time and price. Interestingly, the analog for Gold and the junior gold stocks suggests there is the possibility of strong upside potential over the next 12 months. If Gold breaks above major resistance around $1375/oz, then the juniors and large gold stocks could realize that upside potential over the next 18 months. Although the fledgling correction in precious metals could continue and expand, the broader risk to reward is skewed to the upside. Therefore, we want to accumulate the best opportunities in the juniors on weakness.
Jordan Roy-Byrne CMT, MFTA

-
I know Mike is a very solid investor and respect his opinions very much. So if he says pay attention to this or that - I will.
~ Dale G.
-
I've started managing my own investments so view Michael's site as a one-stop shop from which to get information and perspectives.
~ Dave E.
-
Michael offers easy reading, honest, common sense information that anyone can use in a practical manner.
~ der_al.
-
A sane voice in a scrambled investment world.
~ Ed R.
Inside Edge Pro Contributors

Greg Weldon

Josef Schachter

Tyler Bollhorn

Ryan Irvine

Paul Beattie

Martin Straith

Patrick Ceresna

Mark Leibovit

James Thorne

Victor Adair