
Gold & Precious Metals
Today’s videos and charts (double click to enlarge):
SFS Key Charts & Video Update


SF60 Key Charts & Video Update

SF Juniors Key Charts & Video Analysis

SF Trader Time Key Charts & Video Analysis

Morris


With a sharp lurch higher, December Gold has broken above the 1301.20 resistance I’d flagged as crucial to the intermediate-to-long-term outlook. The rally is encouraging, but we should remain cautious for two reasons:
For one, the move was catalyzed by news that Kim Jong Un-sane had fired a missile over Japan. As someone pointed out in the Rick’s Picks chat room on Tuesday, however, traders who have faded market moves caused by seemingly shocking news have only made money. Indeed, every geopolitical crisis in memory, including the bombing of Pearl Harbor and the Cuban missile showdown turned out to have been a great opportunity to buy stocks at relative bargain prices. Indeed, DaBoyz used these crises and countless others to shake down shares so that they could by more of them at bargain prices. This was clearly the case here. On Sunday evening, index futures plummeted on news of Kim’s brazen aggression. But Wall Street, cynical as ever, treated the short-lived panic as a fire sale. The result was that, by the end of Tuesday’s session, traders had reversed a 134-point selloff on the opening to close the Dow up 57 points — a 190-point reversal.
The second reason we should treat gold’s ‘breakout’ cautiously is that it is still well shy of election night’s watershed top at 1353.00. Until such time as that high is exceeded, the 1462.70 rally target given here earlier will in my estimation be more theoretical than probable. For now, caveat emptor. I
If you don’t subscribe, click here for a free two-week trial
Why Gold’s Surge Beckons Caution

Strengths
- The best performing precious metal for the week was gold, closely followed by silver, up in tandem 0.56 percent and 0.47 percent, respectively, after a see-saw week in price action for the metals. Prices have been choppy over the last seven trading sessions but have held onto recent gains.
- As reported by ZeroHedge, the price of gold started moving up on Friday after Dallas Federal Reserve Bank President Robert Kaplan spoke on Bloomberg TV. Kaplan, who shared his thoughts ahead of Janet Yellen’s speech, said that a market correction wouldn’t necessarily hurt the economy, but instead could be healthy. The dollar also headed lower Friday after Yellen’s speech that left the possibility of a rate hike up to interpretation.
- Some investors have been pulling money from ETFs betting on gold, but hedge funds are flocking to gold, reports the Financial Times. According to the article, buying of gold futures contracts by hedge funds and other speculators has surged a record $19 billion or 474 tonnes over the past month. Analysts say this movement is spurred by concern over “lofty equity market valuations and geopolitical tensions.” Just prior to Yellen’s speech on Friday, futures contracts representing 2 million ounces of gold crossed hands, keeping the trend alive.
Weaknesses
- The worst performing precious metal for the week was platinum, down just 0.44 percent on little price-moving news over the course of the week.
- Tahoe Resources took another leg down, about 19 percent of Friday, as news from a Guatemalan Constitutional Court issued a decision to uphold the lower court’s preliminary decision to suspend mining at its Escobal Mine.
- Gold prices fell lower on Thursday as investors awaited signs on interest rates from the Jackson Hole Economic Summit, along with pressure from a firmer dollar, reports Reuters. Gold failed to break through the top of its $1,200 – $1,300 range in April and June of this year as well, but with the threat from Trump of a government shutdown, there is still underlying support for the yellow metal.
Opportunities
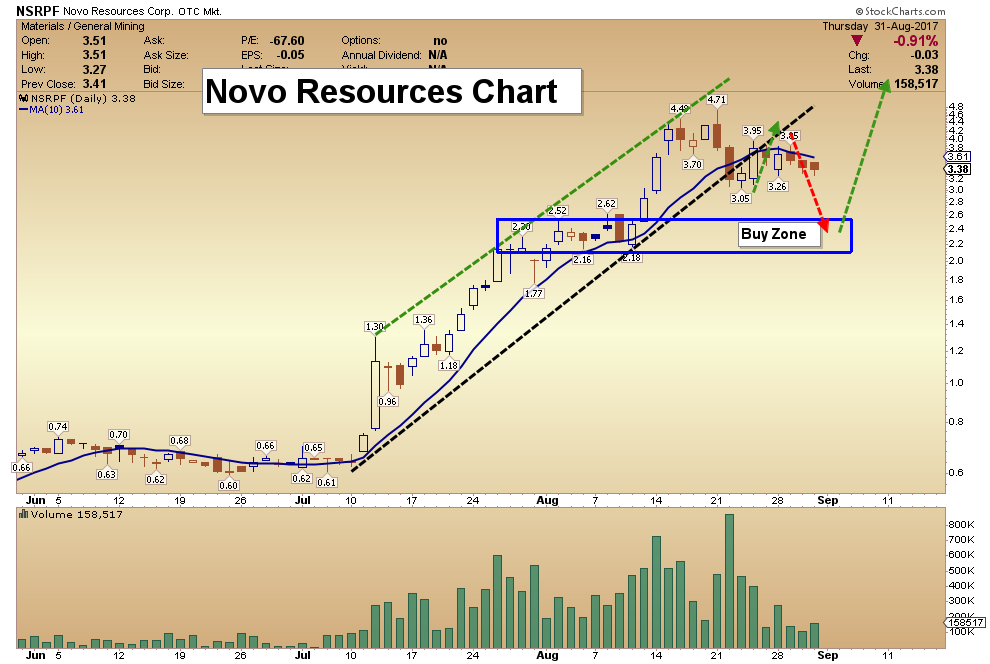
- The president of Novo Resources has spent 13 years searching for clues that back a hunch, reports Bloomberg: that the world’s biggest gold resource has lost siblings elsewhere on the planet. Now Quinton Tood Hennigh thinks he may have found what he has been looking for near Australia’s northwest coast. In July, Novo zeroed in on a gold find that’s confounded geologists and sparked a 500-percent surge in the company’s share price, writes Bloomberg. Hennigh admits he isn’t 100 percent sure that this will turn into a mine, but the potential upside is seen by some as huge.
- Traders have pushed gold futures to near a nine-month high, reports Bloomberg, but if the history of gold’s relationship with oil is any guide, the surge in the yellow metal could last longer than the flare-up in geopolitical tension. Looking at the chart below, the current price divergence in oil and gold may still be going (meaning gold should continue to outperform oil before the roughly 34-month cycle ends).

- Bank of America Merrill Lynch has a bullish outlook on gold and believes the price could surge to $1,400 an ounce early next year, reports Kitco News. The bank’s global head of commodities research, Francisco Blanch, says one major catalyst for this could be the European Central Bank embarking on a tightening cycle. Nearer term, Trump’s threat to shut the government down, (unless Congress agrees to fund the border wall with Mexico) with the approaching debt ceiling coming into focus, could generate enough uncertainty to spark a convincing rally through $1,300 per ounce.
Threats
- More of China’s consumers “are giving up substance for style when it comes to gold,” reports The Asian Review. Happy to buy less-pure pieces if it means keeping up with the latest trends, sales of platinum and 18-karat gold pieces in China climbed 22 percent on the year for the April-June quarter. China is the world’s second-largest gold consumer, “but overall consumption of the yellow metal in China could start to dip if 18- and 22-karat jewelry gains traction,” the article continues.
- Investors have made a fortune on palladium this year; in fact, the metal surged 38 percent to its highest price since 2001, reports Bloomberg. That’s the good news. The bad news? ETFs that track the precious metal have lost more than $49 million as investors are cashing out. “The explanation for the outflows lies in part in the scarcity of physical palladium and a robust borrowing market that has developed among users and speculators,” the article reads.
- Is the Brazilian government trying to balance the books on the back of the Amazon jungle? Opening an area for mining known as Renca or the National Reserve of Copper and Associates, which was set aside by the military government three decades ago to safeguard resources and sovereignty, is drawing plenty of criticism from environmental groups. Belo Sun Mining has had its mining permits in limbo after indigenous groups got the company’s mining license suspended.
 First published on Sun Aug 20 for members: With the metals providing us with the pullback we were expecting in our report last weekend (Aug 12-13), they continued to push higher from that pullback. Moreover, the structure continues to look quite bullish. However, the only question the market has yet to answer is if we see one more drop before the parabolic rally commences, or if we simply begin to rally strongly from here.
Since the market has not done anything unexpected this past week, I have to note that my overall perspective has not changed. My main expectation is still looking for a bit more pullback before we are ready to rally through resistance. Moreover, there is really not much more I am able to provide by way of further analysis to what I have been saying all week:
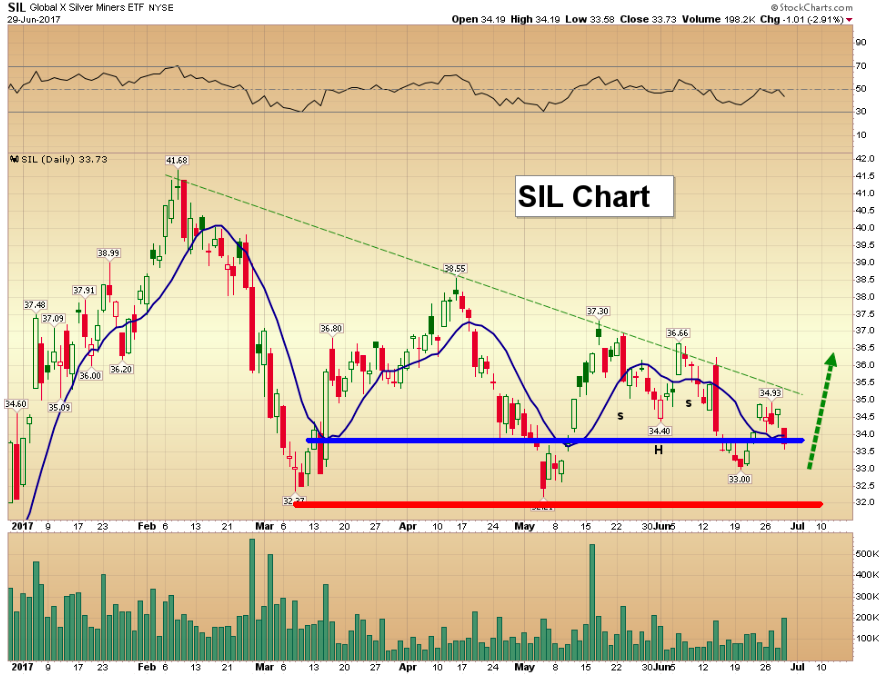
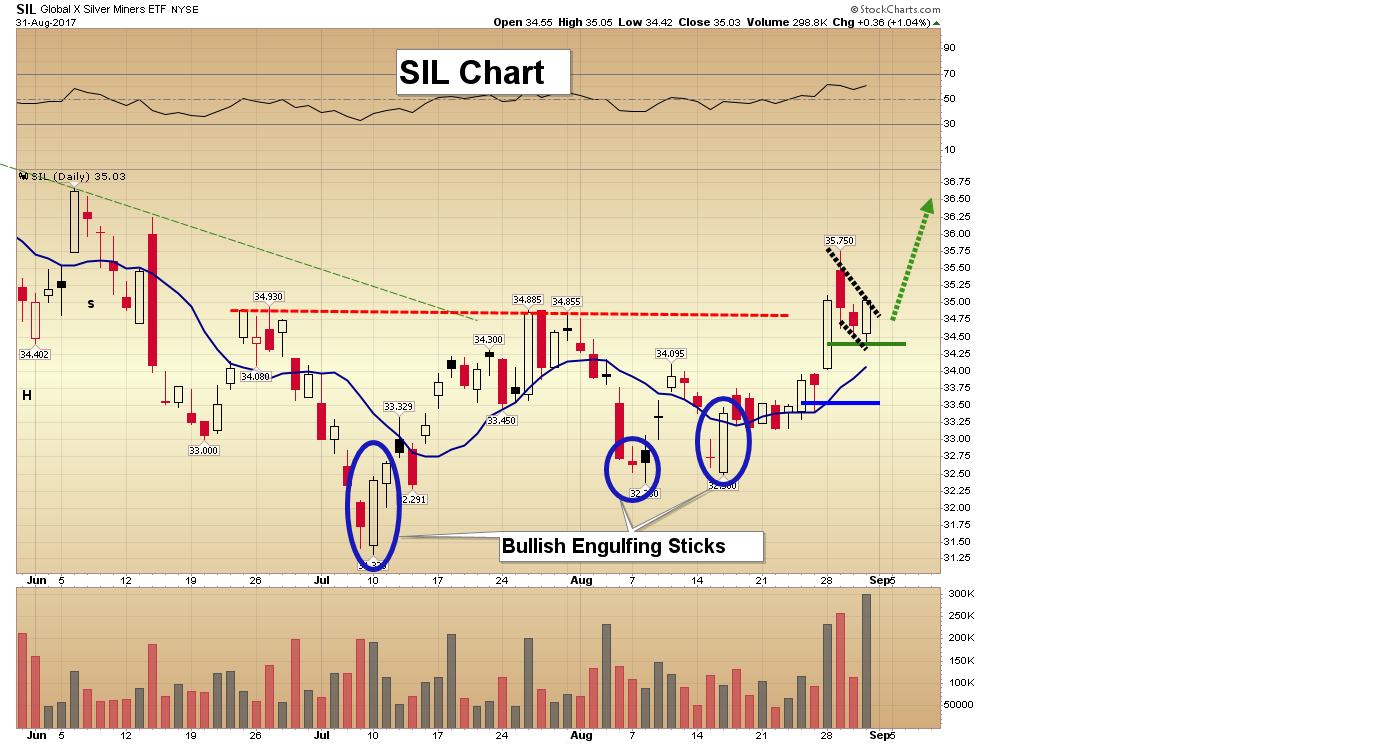
When dealing with fireworks, all it takes is one spark, and the entire box can be ignited. The metals market is in no different position right now. It does have the potential for a direct break out, and if we should see silver take out its blue box overhead with strong buying volume, do not stand in its way, since it means someone has lit the match, and it will likely have begun the heart of its 3rd wave higher.
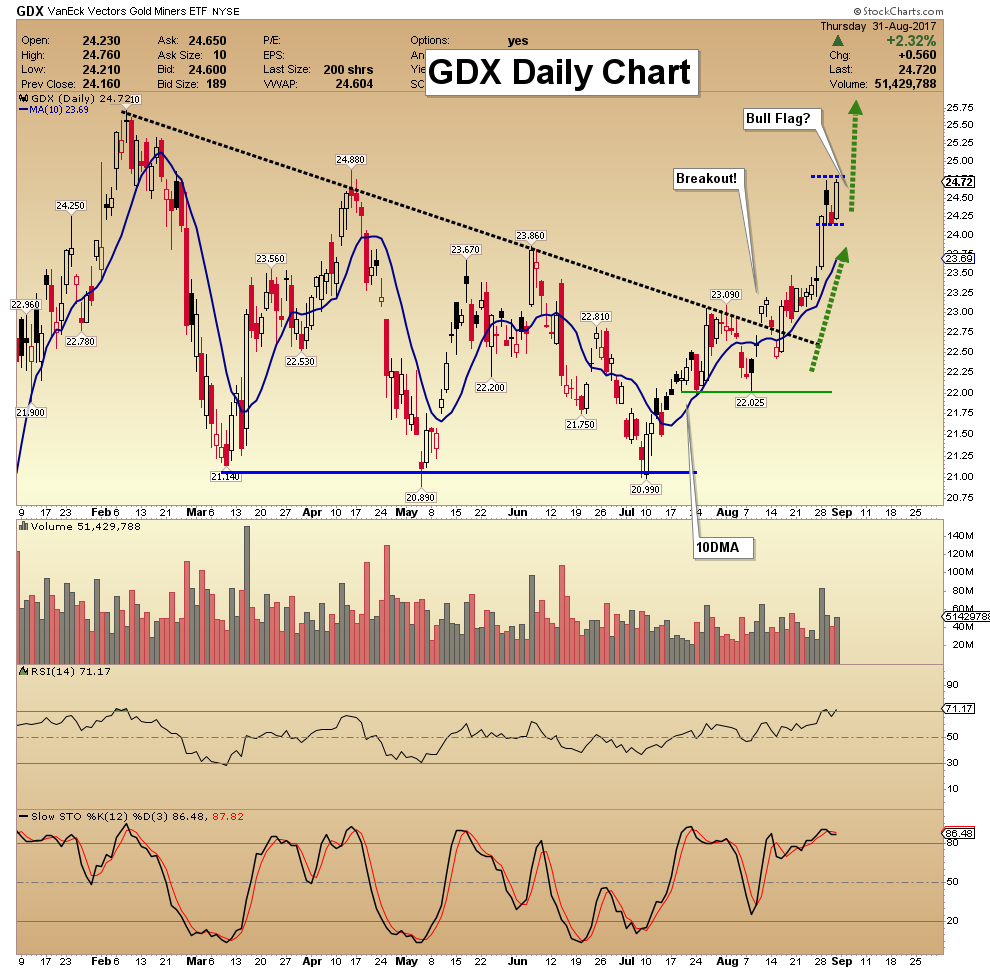
As far as GDX is concerned, as I have been saying for the last several weeks, the micro structure is truly messy on this rise. While GLD and silver have been displaying truly ideal Elliott Wave structures, GDX has been an overlapping mess. So, the question of how to count the micro structure has become a bit of a challenge. Rather than provide you with multiple count potentials, I am going to provide resistance and support levels. Currently, the resistance for GDX resides between 23.60-23.96. As long as we remain below that resistance region, I am expecting another pullback in the complex. However, should we see a direct break out of that region, then you should set your stops just below the 22.83 region, for if it is a true 3rd wave break out from that point, we should not see the 22.80 region again.
In summary, I remain bullish the complex, but am on alert for one more pullback before the market finally breaks out for a rally into the fall of 2017.
The one difference that I can add to this weekend’s analysis is that I am now just a little less confident that GLD can drop down as deeply as the 117-118 region, and it may hold over 118 on the next pullback. It has provided us with a much stronger bullish count in this rally off the July lows, and the pullbacks may no longer be as deep as we have seen in the past. Should this occur, rather than seeing the deeper pullback in the coming week or two, it is a first sign that GLD has changed its “nature,” and shallow pullbacks may now be the order of the day, which is often what we see when this chart begins to act extraordinarily bullish.
Lastly, I have warned many times about analysis that follows simple trend lines, as they have been the most whipsawed type of analysis in the metals market for years. You see, metals usually move towards extreme positions. This means that we have often seen the metals move just outside of trend lines to get those following them either overly bullish on a break out or overly bearish on a break down. At that point, they have then reversed strongly in the opposite direction. We have seen this occur more times than I can count over the last several years. This is likely why you see some of the most bullish analysis on the internet on a break out and the most bearish on a break down, which explains why these folks have been terribly whipsawed at each high and low.
At this point in time, the three charts we follow – GLD, GDX and silver – have all broken out of downtrend channels. And, yes, many of the same people have again turned uber-bullish. And, while GLD has been grinding just beyond the resistance we noted weeks ago, both GDX and silver are still below their respective resistance regions. This is why using Fibonacci Pinball is a much more accurate measure of market movements as compared to any analysis that primarily uses trend lines and channels.
In fact, my resistance on GDX was 23.60-23.96, whereas it seems to have topped this past week within 12 cents of that resistance. Silver still has not been able to move through the bottom of our resistance, which begins at 17.26, with the high in silver being struck at 17.30 this past week with a spike and reversal on Friday. It has not been able to sustain any move through our resistance level.
So, for now, I am on high alert for another pullback in the complex before the real break out is seen. But, again, if the market is able to overcome these resistance regions noted above, then do not stand in its way, as a 3rd wave is likely in progress.
See charts illustrating the wave counts on the GDX, GLD, and Silver Futures (YI).
Avi Gilburt is a widely followed Elliott Wave technical analyst and author of ElliottWaveTrader.net (www.elliottwavetrader.net), a live Trading Room featuring his intraday market analysis (including emini S&P 500, metals, oil, USD & VXX), interactive member-analyst forum, and detailed library of Elliott Wave education.

-
I know Mike is a very solid investor and respect his opinions very much. So if he says pay attention to this or that - I will.
~ Dale G.
-
I've started managing my own investments so view Michael's site as a one-stop shop from which to get information and perspectives.
~ Dave E.
-
Michael offers easy reading, honest, common sense information that anyone can use in a practical manner.
~ der_al.
-
A sane voice in a scrambled investment world.
~ Ed R.
Inside Edge Pro Contributors

Greg Weldon

Josef Schachter

Tyler Bollhorn

Ryan Irvine

Paul Beattie

Martin Straith

Patrick Ceresna

Mark Leibovit

James Thorne

Victor Adair