Gold & Precious Metals

U.S. Banks Precious Metals Derivative Exposure Surged In The Beginning Of 2017

According to the most recent report on the U.S. Financial Institutions Derivatives trading activity, the U.S. banks held a record amount of precious metals contracts in the first quarter of 2017.  Not only did the U.S. banks report a record amount of precious metals contracts, they also held a record amount in notional value of commodity and equity derivative contracts.

There just seems to be a lot of paper floating around in our highly inflated stock, bond and Forex markets.  And… there needs to be.  Without an ever increasing amount of leverage via their derivative bets and hedging, these markets would be in serious trouble.  Furthermore, the practice of using contracts to hedge bets upon on other derivative bets has put the financial market in a highly fragile state.

The Office of the Comptroller of the Currency (OCC) put out their First Quarter 2017 Quarterly Report on Bank Trading and Derivative Activities.  In that report, they published the following chart on the U.S. Banks notional value in precious metals contracts:

US-Banks-Precious-Metals-Contracts-768x425

As we can see in the chart, the overall trend has continued higher since 2000.  What is interesting is that the notional value of precious metals contracts held by the U.S. banks is even higher in the first quarter of 2017 versus Q4 2012 when the prices of the precious metals were much higher.

In looking at previous data, there were some quarters that had a higher notional amount of precious metals contracts.  This was due to the banks adding short contracts as the price of precious metals increased.  However, Q1 2017 of $43.6 billion was up considerably versus the $28.3 billion in Q1 2016. 

For example, in Q3 2016, U.S. banks also held $43.6 billion in precious metals contracts.  Again, this was due to a lot of short contracts held by the U.S. banks when the gold price surged to a high of $1,366 in the third quarter of 2016.  As the gold price sold off over the next several months, the precious metals contracts declined in the fourth quarter of 2016:

We can see this in the last bar on the chart on the right.  But what is quite interesting is the big increase in U.S. banks precious metals exposure in the first quarter of 2017, shown in the first chart above, when the amount of short gold contracts the large U.S. banks held declined significantly in the chart below:

Now, this is only showing the U.S. banks gold contracts.  This does not include other precious metals, such as silver, platinum and palladium.  However, gold is by far the largest market.  If we include the FX contracts (forward exchange contracts), the total notional amount is enormous:

The total notional amount of U.S. banks FX & Gold Contracts was a stunning $34.5 trillion in the first quarter of 2017, up from $30.7 trillion at the end of 2016.  Here is the definition of a Forward Exchange Contract by Investopedia:

Forward Exchange Contract: A forward exchange contract is a special type of foreign currency transaction. Forward contracts are agreements between two parties.

Forward contracts are not traded on exchanges, and standard amounts of currency are not traded in these agreements. They cannot be canceled except by the mutual agreement of both parties involved. The parties involved in the contract are generally interested in hedging a foreign exchange position or taking a speculative position.

The nature of forward exchange contracts protects both parties from unexpected or adverse movements in the currencies’ future spot rates.

So, these FX Contracts are hedges on different fiat currencies spot price movements.  We don’t know what percentage is hedged in Gold or FX contracts.  However, I would imagine the majority being in the FX Contracts that are hedging the different fiat currencies.

Now, what is also quite interesting about the huge increase in the FX & Gold contracts notional values, is that global GDP hasn’t really increased that much since 2013.  According to the World Bank, here are the global GDP figures over the past four years:

Global GDP (current U.S. Dollars)

2013 = $76.9 trillion

2014 = $78.9 trillion

2015 = $74.5 trillion

2016 = $75.5 trillion

If we divide the notional amount of FX & Gold Contracts by the global GDP, we can see a very interesting trend:

FX & Gold Contracts Notional Amount Divided By Global GDP

2013 = 28%

2014 = 32%

2015 = 40%

2016 = 41%

What we have here is a great deal more FX & Gold paper amounts trading versus the global GDP.  In 2013, the FX & Gold notional amount by the U.S. banks accounted for only 28% of global GDP, however it jumped to 41% in 2016.  I would imagine in 2017, it will be even higher.

While the notional amount of FX & Gold contracts has hit a record high, take a look at the next chart:

These two charts display the amount of “Commodity” and “Equity” contracts in notional dollar figures held by U.S. banks.  While there was a temporary blip in 2005 (mostly longer dated contracts – in BLUE), there was a pronounced increase in 2015, 2016, and 2017 in both of these derivative asset classes.

According to the data by the OCC, the U.S. banks held $1 trillion in commodity contracts and $3 trillion in equity contracts in the first quarter of 2017.  While these figures are much less than the FX & Gold contracts, they have still increased substantially over the past three years.

For example, in 2014, the U.S. banks held $431 billion in commodity contracts and $745 billion in equity contracts.  In just three years, the U.S. banks exposure to commodity contracts has more than doubled to $1 trillion and their notional amount of equity derivatives has quadrupled to over $3 trillion.

Again…. the U.S. banks are holding onto a record amount of paper derivative contracts in these different asset classes.  Yes, it makes some sense that the U.S. banks equity contracts are increasing right along with the rising highly-inflated stock market, but to see the commodity exposure double when the prices of most commodities are much lower than what they were before 2014, is quite interesting:

As the commodity index above fell from over 300 in 2014, to 176 currently, the amount of U.S. banks exposure to the commodity market has more than doubled to $1 trillion. Unfortunately, I don’t know all the particulars as to why the U.S. banks have increased their exposure to such a large degree in these different asset classes.  However, to see a record amount of paper trading in a market that is already highly leveraged… points to big trouble ahead.

Check back for new articles and updates at the SRSrocco Report.

Aug 22, 2017

  1. After rallying almost $100 an ounce from the July lows of about $1210 (basis December futures), gold is consolidating its gains.
  2. Fundamentally, there isn’t much immediate time frame news from either the fear trade or the love trade. That’s the root cause of this sideways price action, and its healthy.
  3. To get some technical perspective on the consolidation, please  click here now. Double-click to enlarge this short term gold chart.
  4. A small head and shoulders top pattern has appeared, and it suggests more consolidation will occur before the upside action resumes. This scenario would see gold move down towards $1272, and then rally towards $1330.
  5. Please  click here now. Double-click to enlarge. On this chart, a slightly bigger head and shoulders pattern is apparent. It suggests a deeper correction to about $1250 may occur.
  6. I’ve outlined the $1300 – $1330 price zone as a good place to book some light profits on positions bought into my $1220 – $1200 buy zone. From here, investors should be viewing the $1275 – $1245 price zone as a fresh buy zone. 
  7. Please  click here now. Double-click to enlarge this important dollar versus yen chart. 
  8. The world’s biggest liquidity movers are major bank FOREX departments, and they tend to aggressively buy the dollar versus the yen when global risk is declining.
  9. When global risk rises, they will aggressively sell the dollar against the yen.
  10. Both gold and the yen are viewed by these liquidity flow monsters as the world’s most important safe havens. The 108 dollar versus yen price is a very similar “line in the sand” to the $1300 line in the sand for gold.
  11. The dollar is consolidating its recent decline in the 108 area as gold consolidates in the $1300 zone. Fundamentals make charts, and earth shaking news in September and October could see the dollar tumble under 108 and gold blast through $1300. 
  12. The debt ceiling (which I call a floor) debate is one event that could create a major panic in risk-on markets in this critical September-October time frame.
  13. That fear trade rubber is going to meet the road just as Indian dealers begin buying gold aggressively for Diwali. They appear to be in pause mode now, which is logical since they don’t tend to chase the price after it has rallied almost $100 an ounce.
  14. As I’ve mentioned, all gold bug eyes need to be focused on the $1275 – $1245 buy zone. Perhaps even more importantly, all gold bug hands need to be ready to press the buy button for their favourite gold stocks if gold moves into that key buy zone.
  15. On that note, please  click here now. Double-click to enlarge this GDX chart. The $26 area for GDX corresponds with $1300 for gold. Gold has traded at the $1300 area numerous times since February, but GDX rallies have not taken it to $26.
  16. I understand that most gold bugs are heavily invested in gold stocks. The inability of these stocks to consistently outperform bullion is frustrating, but there is light in that tunnel.
  17. To begin to view the light, please  click here now. Double-click to enlarge this long term gold chart. Bull markets have rising volume and bear markets have rising volume. Corrective action, up or down, is accompanied by falling volume.
  18. Gold has been in a bull cycle since 2002. Volume has risen on major price advances, and dwindled on declines.
  19. Please  click here now. Double-click to enlarge. Gold stocks were in a bear cycle against gold from 1995 – 2016. 
  20. That happened because the Fed lowered rates to make small inexperienced investors move their money out of bank accounts and into risky investments focused on capital gain.
  21. The 1995 – 2016 bear market in gold stocks against gold is over. Just as gold based against the dollar in the 1999 – 2001 period before blasting higher on big volume, gold stocks are doing the same thing against gold now. 
  22. Quantitative tightening in America, Japan, and Europe is coming. Higher rates are in play. This is going to (slowly at first) move money out of global stock markets and government bonds and into the fractional reserve banking system. That will reverse the money velocity bear cycle that corresponded with the gold stocks bear market. 
  23. It’s a steady process, but it requires investors to be realistic about the time required to create a money velocity bull market… and thus a gold stocks bull market against gold. The bottom line is this:
  24. Good gold stock times are not quite here, but they are near!

Thanks! 

Cheers
st

Aug 22, 2017
Stewart Thomson  
Graceland Updates
website: www.gracelandupdates.com

Summary

Recent price action.

Anecdotal and other sentiment indications.

Price pattern sentiment indications and upcoming expectations.

Recent price action

As I noted in my new service on Seeking Alpha, The Market Pinball Wizard, as long as silver remains below its resistance of 17.26-17.80 and GDX remains below its resistance of 23.60-23.96, I am looking for another pullback in the complex before the real break out occurs. This past week, silver spiked and reversed slightly over the bottom of our resistance, and GDX came within 12 cents of our resistance before it turns lower on Friday.

….continue reading HERE

July FOMC Minutes and Gold

Yesterday, the minutes of the Federal Reserve’s July meeting were released. What do they say about the Fed’s stance and what do they mean for the gold market?

How can we summarize the recent FOMC minutes? Well, the FOMC members agreed that “the labor market had continued to strengthen and that economic activity had been rising moderately so far this year”. But the most important discussion concerned three other issues.

First, several participants noted uncertainty about the future course of the fiscal policy. A few of them even suggested that “the fiscal stimulus likely would be smaller than they previously expected.” The declining odds of significant fiscal stimulus imply less need for a more hawkish Fed. Thus, this is a bad development for gold.

Second, the several FOMC members pointed out further increases in equity prices. They argued that the rising valuations, together with continued low longer-term interest rates, are equivalent to an easing of financial conditions. Hence, the Fed could be potentially more hawkish as its tightening of monetary policy has been largely offset by other factors influencing financial markets. This is good news for the yellow metal.

Last but definitely not least, the U.S. central bankers discussed the recent low readings of inflation. Although many of them saw the softness in inflation as caused by idiosyncratic factors and thus temporary, the FOMC members noted the downside risks to the inflation outlook. The key paragraph is as follows:

“Participants discussed the softness in inflation in recent months. Many participants noted that much of the recent decline in inflation had probably reflected idiosyncratic factors. Nonetheless, PCE price inflation on a 12 month basis would likely continue to be held down over the second half of the year by the effects of those factors, and the monthly readings might be depressed by possible residual seasonality in measured PCE inflation. Still, most participants indicated that they expected inflation to pick up over the next couple of years from its current low level and to stabilize around the Committee’s 2 percent objective over the medium term. Many participants, however, saw some likelihood that inflation might remain below 2 percent for longer than they currently expected, and several indicated that the risks to the inflation outlook could be tilted to the downside.”

Hence, the recent minutes showed rising worries about inflation. Therefore, the U.S. dollar fell after their release (however, it rebounded today against the euro), while the shiny metal rose, as one can see in the charts below.

Chart 1: EUR/USD exchange rate over the last three days.

1 3DDIwWP

Chart 2: Gold prices over the last three days.


Gold prices over the three last days

To sum up, the July FOMC minutes were released and they were generally a bullish event for the gold market. The reason is that they showed the increasing worries about the recent softness in inflation. Although most of the FOMC members still believe that inflation will stabilize around the Committee’s 2 percent objective over the medium term, the size of the cautionary group is expanding. It means that the odds of a December hike are lower, which is fundamentally positive for the yellow metal. However, there is plenty of time before the December meeting, so a lot may change. Now, all eyes are on the today’s minutes from the ECB meeting in July and on the Jackson Hole conference held next week. Stay tuned!

If you enjoyed the above analysis, we invite you to check out our other services. We focus on fundamental analysis in our monthly Market Overview reports and we provide daily Gold & Silver Trading Alerts with clear buy and sell signals. If you’re not ready to subscribe yet and are not on our mailing list yet, we urge you to join our gold newsletter today. It’s free and if you don’t like it, you can easily unsubscribe.

Disclaimer: Please note that the aim of the above analysis is to discuss the likely long-term impact of the featured phenomenon on the price of gold and this analysis does not indicate (nor does it aim to do so) whether gold is likely to move higher or lower in the short- or medium term. In order to determine the latter, many additional factors need to be considered (i.e. sentiment, chart patterns, cycles, indicators, ratios, self-similar patterns and more) and we are taking them into account (and discussing the short- and medium-term outlook) in our trading alerts.

Thank you.

Arkadiusz Sieron
Sunshine Profits‘ Gold News Monitor and Market Overview Editor

Precious Metals Nearing Breakout

The outlook for precious metals has changed quite a bit over the last month. In early July, Gold and gold stocks were weak and threatening severe breakdowns below key levels such as $1200 Gold and $21 GDX. Those moves reversed course and now Gold and gold stocks are threatening resistance. The prognosis has turned bullish and with the help of a correcting stock market precious metals could build on their recent rebound.

Below we plot the weekly bar chart of Gold which is testing critical resistance in the $1290-$1300 area. Gold could close the week at its highest weekly close in 2017, just weeks after breaking its 2017 uptrend. That early July breakdown proved to be a false break as Gold has been able to rally back up to resistance. Gold has broken the downtrend line since 2011 but the most important resistance is $1300. With a break above $1300, Gold could be on its way to a retest of the 2016 high at $1375.

Aug112017Gold

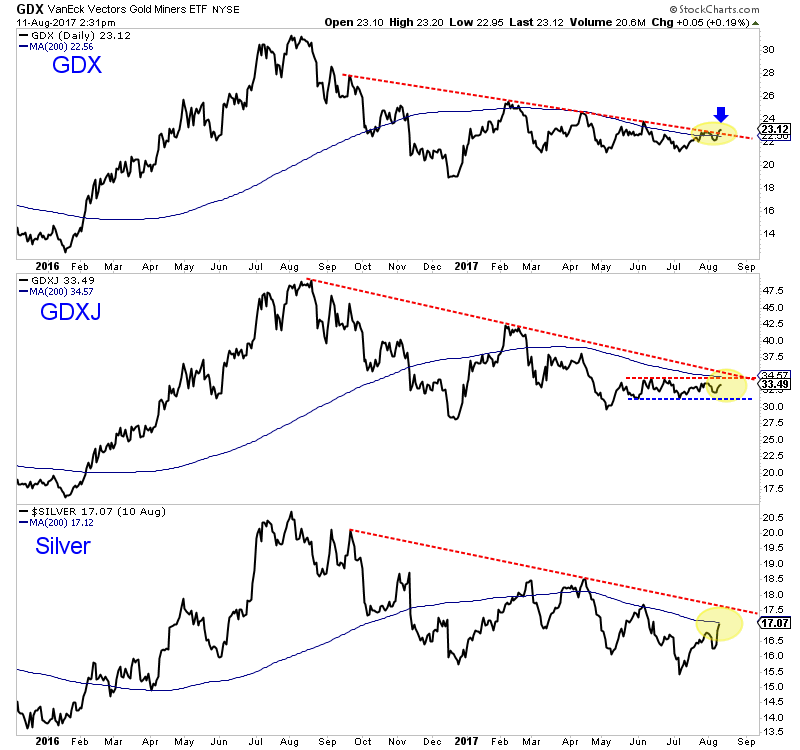
Turning to the miners, we find that GDX has already broken its downtrend and the 200-day moving average. GDXJ faces strong resistance at $34-$35. Silver has a little ways to go before it can break its downtrend line but its relative strength in recent days is quite encouraging. 


Aug112017minerssilver

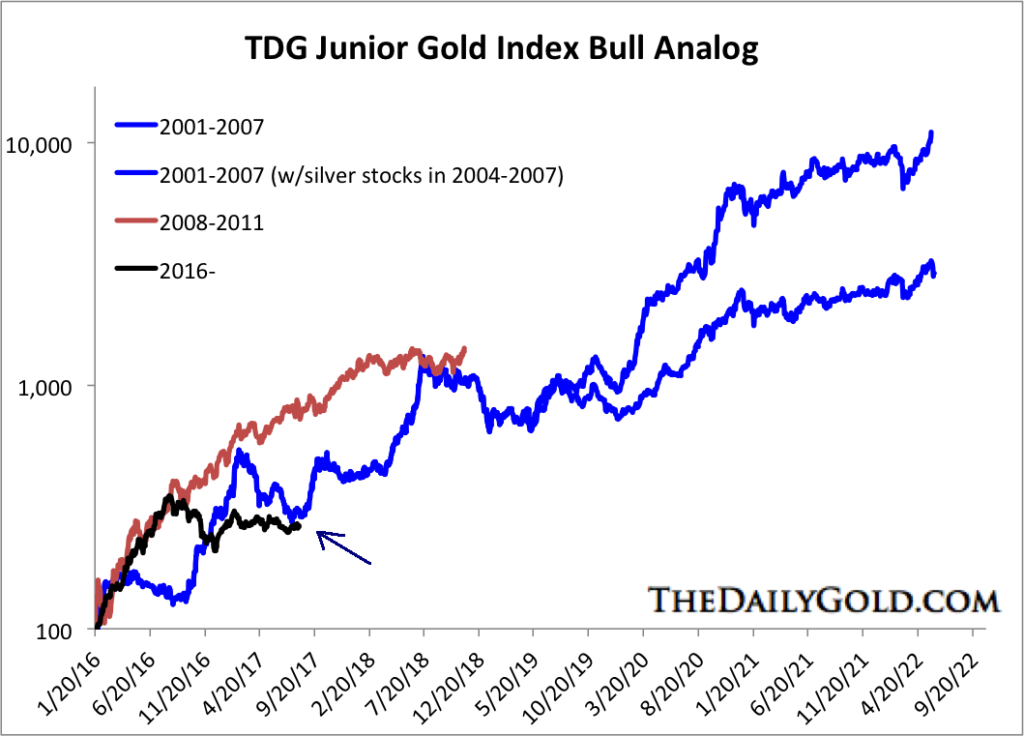
While there are only a few data points in the junior bull analog chart (which is based on our junior indices), it suggests the juniors could be close to starting a new leg higher. If Gold is going to rise to $1375 then the juniors would enjoy a good pop. The analog chart shows the significant upside potential in juniors if Gold were to clear $1375 and advance towards $1550-$1600. 


There are several reasons we have turned bullish. First, precious metals were breaking down in early July yet that reversed course entirely. Gold has rallied back to +$1290 and well above resistance at $1240-$1250. If Gold were going to break below $1200 then the rally would have rolled over again around $1240. Second, intermarket activity has turned quite favorable for Gold. The US$ index has not made a new low but Gold has perked up. Meanwhile, Gold is benefitting (as it should) from weakness in the equity market. We think the weakness could continue and drive Gold to $1375.


The bottom line is Gold is now showing strength on both a nominal and relative basis. If this continues then Gold will clear $1300 and the gold stocks (which have been lagging) could push higher in sudden and aggressive fashion. 


Jordan Roy-Byrne CMT, MFTA


Jordan@TheDailyGold.com

Consider learning more about our premium service including our favorite junior exploration companies.