
Gold & Precious Metals

Videos and charts (double click to enlarge) posted Jun 30, 2017
SFS Key Charts & Video Analysis
SF60 Key Charts & Video Analysis
SF Juniors Key Charts & Video Analysis
SF Trader Time Key Charts & Video Analysis
Morris

It’s no secret that the East (Asians and Indians) continue to acquire a lot of gold as Western demand has weakened this year. According to the most recent data released by the USGS – United States Geological Survey, U.S. gold exports surged during the first four months of the 2017 versus the same period last year.
How much? A great deal. In the first four months of 2017, the U.S. exported a stunning 173 metric tons of gold (5.5 million oz) compared to 119 metric tons (3.8 million oz) during the same period last year. Thus, U.S. gold exports Jan-Apr 2017 surged 45% versus last year:

This is quite a large increase. I would imagine part of the increase is due to the fact that U.S. precious metals retail demand is off considerably ever since Trump was elected President. U.S. Gold Eagle sales are down a whopping 62% 1H 2017 versus the same period last year.
For example, the U.S. Mint sold 501,000 oz of Gold Eagles during the first half of 2016, versus 192,000 oz for the first half of 2017. This is a drop of 309,000 oz.
That being said, the drop off in physical gold investment demand in the U.S. has been offset by elevated demand in the East. As I mentioned in a previous article, the U.S. exported 31.4 metric tons to Hong Kong alone in January. Thus, Hong Kong received more than half (57%) of all U.S. gold exports during January this year.
So, what were the top five countries that received the majority of the 173 metric tons of U.S. gold exports?
Top 5 U.S. Gold Exports JAN-APR 2017 (mt =metric tons)
Hong Kong = 66.7 mt (38%)
Switzerland = 48.3 mt (28%)
U.K. = 25.5 mt (15%)
India = 22.9 mt (13%)
U.A.E = 6.1 mt (4%)
Of the 173 mt of U.S. gold exports, these five countries received 169.5 mt, or 98% of the total. Hong Kong and India received 51%, while Switzerland and the U.K received 43% of the total. However, much of the gold that is exported to Switzerland and the U.K. make its way to China, India or other Asian countries. So, it is safe to assume that the majority of U.S. gold exports are eventually making their way to the East.
What is also quite interesting is that the U.S. continues to export more gold than it produces and imports. During Jan-Apr 2017, the U.S. produced 77 mt of gold, while it imported 88 mt, for a total of 165 mt. However, total U.S. gold exports for the first four months of the year equaled 173 mt, or 8 mt more than it produced and imported.
Thus, the U.S. continues to run a GOLD TRADE DEFICIT.
While precious metals investors in the West are frustrated by the low gold price (and the failure to break above $1,300), the East doesn’t seem to mind a bit. The Eastern philosophy for owning gold is to acquire it on price dips for the longer term, while the West tends to become frustrated over the shorter term.
So, I don’t look at the 62% decline in U.S. Gold Eagle sales Jan-Apr versus last year, as a bad thing. Rather, I just brush it off as the West ‘s FICKLE investment nature.
Lastly, I had the pleasure of chatting with Chris Martenson of PeakProsperity.com this week. It was way overdue because Chris is one of the few analysts whose work is quite similar to what we do here at the SRSrocco Report. I will be releasing our interview when it is posted on their site.
Check back for new articles and updates at the SRSrocco Report.
 The popularity of trading Bitcoin has now reached the point where none other than the New York Times sees fit to declare cryptocurrencies, or more specifically initial coin offerings, “The Easiest Path To Riches On The Web.” Not to be left out, CNBC this week published a brief tutorial on trading crypto with your smartphone and MarketWatch featured a teenage bitcoin millionaire who now forecasts a $1 million price target.
These are exactly the sort of headlines and stories that characterize a speculative mania otherwise known as a “bubble.” For anyone who was around during the dotcom mania this should quickly bring back memories of all the folks who flocked to day-trading tech stocks. But to really understand the mania you need to look no further than the primary argument in buying crypto in the first place. Investors here claim the value comes from the limited supply. The trouble is there is an unlimited number of types of coins that can be created!

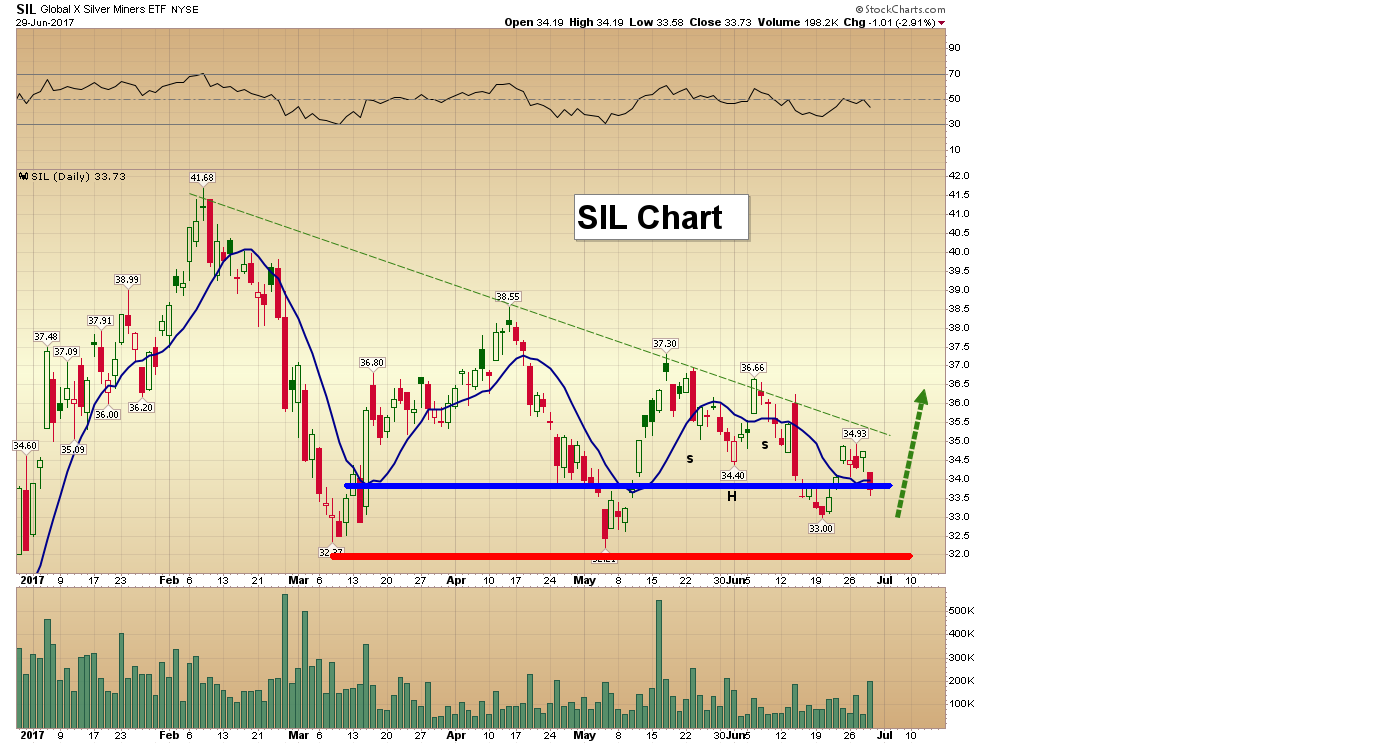
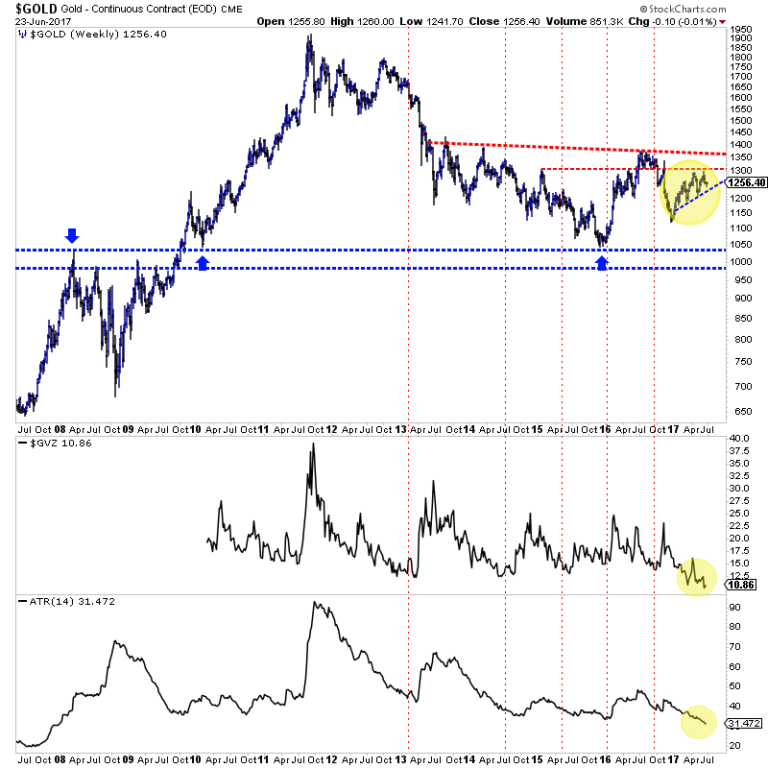
June 25th/2017 – Gold and especially gold mining stocks rebounded on Wednesday and trended higher into the weekend. This is giving some investors renewed hopes that the bull market that began roughly 18 months ago is about to reassert itself. We cannot know for sure yet but what we can say is precious metals are nearing a big move. Gold and gold stocks have traded in tight ranges which will compress further while volatility indicators approach multi-year lows. This is the setup for a break and then a powerful move with increasing momentum and volatility.
First let’s take a look at Gold. Its weekly bar chart is shown (going back 10 years) with two volatility indicators at the bottom. One is the GVZ contract and one is the average true range (ATR) indicator. The ATR indicator is at a 10-year low while GVZ is near an 8-year low. Gold has tested major resistance ($1300) twice and failed both times. If Gold loses its 2017 uptrend (support is around $1230) then it is susceptible to an accelerated decline with increasing volatility and momentum. On the other hand, if Gold could bust through $1300 and then consolidate around $1350, it could setup that anticipated breakout through $1350-$1375.
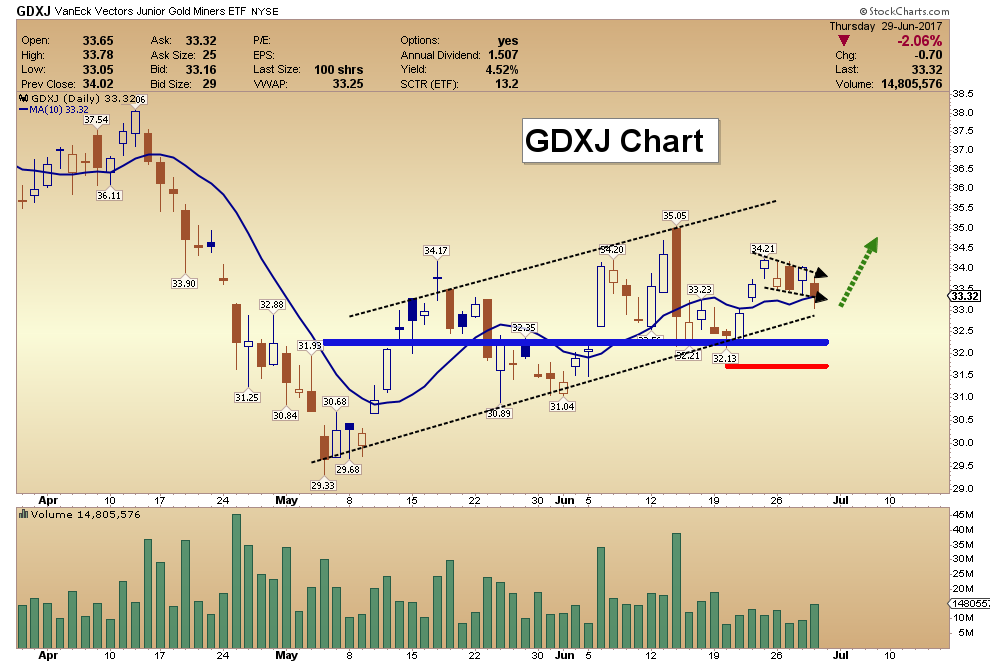
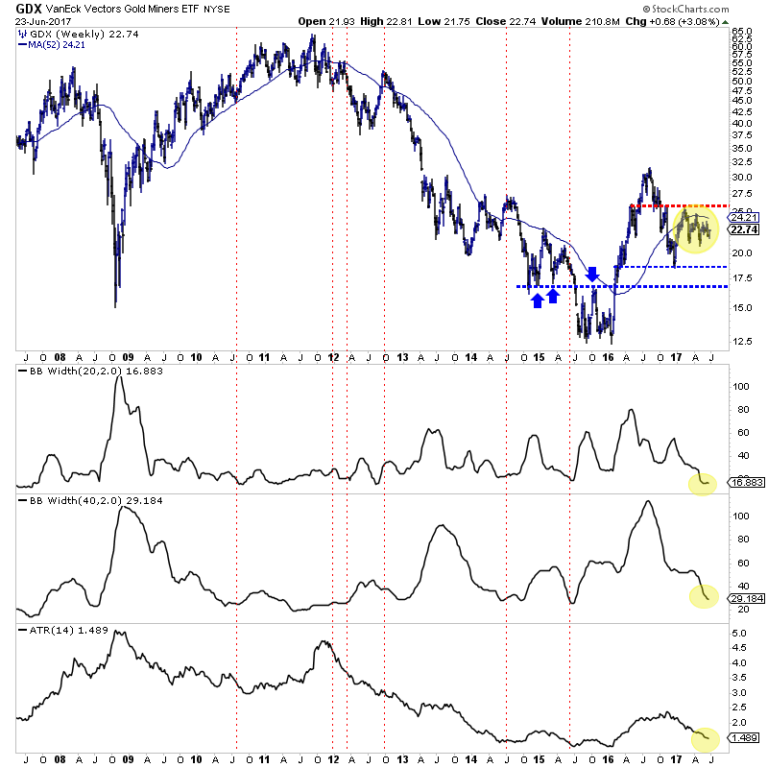
Turning to the gold stocks, we plot a 10-year bar chart of GDX along with the ATR indicator and the bollinger band width for two periods (20 and 40 weeks). These volatility indicators are trending down and approaching multi-year lows. This is not a surprise as GDX has traded in a tighter and tighter range since January 2017. Specifically, GDX has traded in a descending triangle pattern which, if GDX breaks $21 to the downside has a downside target of $17. The bullish outcome would entail GDX rallying to $25 and then breaking higher after a consolidation.
The bulls are cheering this latest rebound but they have a lot more work to do if the next big move is going to be higher. First things first, Gold needs to break $1300 and GDX needs to retest $25 again. The short-term trend could be higher now but until the Gold sector can attain those marks then the bias for the next big move (due to among other reasons the relative weakness in Silver and gold stocks) should remain to the downside. That is why we remain cautious.
Jordan Roy-Byrne CMT, MFTA
For professional guidance and our favorite junior exploration companies go HERE

-
I know Mike is a very solid investor and respect his opinions very much. So if he says pay attention to this or that - I will.
~ Dale G.
-
I've started managing my own investments so view Michael's site as a one-stop shop from which to get information and perspectives.
~ Dave E.
-
Michael offers easy reading, honest, common sense information that anyone can use in a practical manner.
~ der_al.
-
A sane voice in a scrambled investment world.
~ Ed R.
Inside Edge Pro Contributors

Greg Weldon

Josef Schachter

Tyler Bollhorn

Ryan Irvine

Paul Beattie

Martin Straith

Patrick Ceresna

Mark Leibovit

James Thorne

Victor Adair