
Gold & Precious Metals

Yesterday, there was a flash crash in the gold market. What happened and what does it mean?
Monday was a very interesting day for the gold market, as the price of gold plunged almost $20 after 1.8 million ounces of the yellow metal were sold in one minute. Gold futures fell as much as 1.6 percent to $1,236.50 an ounce on the Comex at the Asian close. The drop was unexpected as no new fundamentals justified it. On the contrary, orders for U.S. durable goods fell 1.1 percent in May, the second monthly decline in a row, while the Chicago Fed National Activity Index tumbled to -0.26. And the volume in New York spiked to 1.8 million ounces, an unprecedented level not reached even after the Brexit vote or Trump’s victory in the presidential election.
Hence, the plunge was a mystery. It could be a technical sell or central bank intervention. Or somebody just wanted to exit from the market. But why would he or she want to sell gold during limited participation? Hence, the fat finger order is taking the blame. But some analysts remained skeptical – this had to be a double fat finger, as silver also plunged. And why did the precious metals prices not rebound after an erroneous order hit the market (see the chart below)?
Chart 1: Price of gold over the last three days.
The truth is that no one has a clue what really happened. It could be a fat finger, but someone could take a shot or pull out to satisfy a margin call. Anyway, from the fundamental point of view, nothing changed, so one could reasonably expect a return to the pre-crash price, especially that gold showed resilience, given the volume of sales. However, the yellow metal has already been in a downward trend since the recent FOMC meeting, so a full rebound should not happen. Stay tuned!
If you enjoyed the above analysis, we invite you to check out our other services. We focus on fundamental analysis in our monthly Market Overview reports and we provide daily Gold & Silver Trading Alerts with clear buy and sell signals. If you’re not ready to subscribe yet and are not on our mailing list yet, we urge you to join our gold newsletter today. It’s free and if you don’t like it, you can easily unsubscribe.
Disclaimer: Please note that the aim of the above analysis is to discuss the likely long-term impact of the featured phenomenon on the price of gold and this analysis does not indicate (nor does it aim to do so) whether gold is likely to move higher or lower in the short- or medium term. In order to determine the latter, many additional factors need to be considered (i.e. sentiment, chart patterns, cycles, indicators, ratios, self-similar patterns and more) and we are taking them into account (and discussing the short- and medium-term outlook) in our trading alerts.
Thank you.
Arkadiusz Sieron
Sunshine Profits‘ Gold News Monitor and Market Overview Editor
Gold has spent most of June grinding lower on balance, damaging sentiment and vexing traders. Usual selling leading into the Fed’s latest rate hike contributed, but the summer doldrums are also in play. Gold has typically suffered a seasonal lull this time of year, on waning investment demand as vacations divert attention from markets. But these summer doldrums offer the best seasonal buying opportunities of the year.
This doldrums term is very apt for gold’s summer predicament. It describes a zone in the world’s oceans surrounding the equator. There hot air is constantly rising, creating long-lived low-pressure areas. They are often calm, with little or no prevailing winds. History is full of accounts of sailing ships getting trapped in this zone for days or even weeks, unable to make any headway. The doldrums were murder on ships’ morale.
Crews had no idea when the winds would pick up again, while they continued burning through their precious stores of food and drink. Without moving air, the stifling heat and humidity were suffocating on these ships long before air conditioning. Misery and boredom were extreme, leading to fights breaking out and occasional mutinies. Being trapped in the doldrums was viewed with dread, it was a very trying experience.
Gold investors can somewhat relate. Like clockwork nearly every summer, gold starts drifting listlessly sideways. It often can’t make significant progress no matter what the trends looked like heading into June, July, and August. As the days and weeks slowly pass, sentiment deteriorates markedly. Patience is gradually exhausted, supplanted with deep frustration. Plenty of traders capitulate, abandoning ship.
Thus after decades of trading gold, silver, and their miners’ stocks, I’ve come to call this time of year the summer doldrums. June and July in particular are usually desolate sentiment wastelands for precious metals, totally devoid of recurring seasonal demand surges. Unlike the rest of the year, these summer months simply lack any major income-cycle or cultural drivers of outsized gold investment demand.
The vast majority of the world’s investors and speculators live in the northern hemisphere, so markets take a back seat to the great joys of summer. Traders take advantage of the long sunny days and kids being out of school to go on extended vacations, hang out with friends, and enjoy life. And when they aren’t paying much attention to the markets, naturally they aren’t allocating much new capital to gold.
Given gold’s dull summer action historically, it’s never wise to expect too much from it this time of year. Summer rallies can happen, but they are rare. So expectations really need to be tempered, especially in June and July. That early-1990s Gin Blossoms song “Hey Jealousy” comes to mind, declaring “If you don’t expect too much from me, you might not be let down.” The markets are ultimately an expectations game.
Quantifying gold’s summer seasonal tendencies during bull markets requires all relevant years’ price action to be recast in perfectly-comparable percentage terms. That’s accomplished by individually indexing each calendar year’s gold price to its last close before market summers, which is May’s final trading day. That’s set at 100 and then all gold-price action that year is calculated off that common indexed baseline.
So gold trading at an indexed level of 105 simply means it has rallied 5% from May’s final close, while 95 shows it’s down 5%. This methodology renders all bull-market-year gold summers in like terms. That’s critical since gold’s price range has been so vast, from $257 in April 2001 to $1894 in August 2011. That span encompassed gold’s last secular bull, which enjoyed a colossal 638.2% gain over those 10.4 years!
So 2001 to 2011 were certainly bull years. 2012 was technically one too, despite gold suffering a major correction following that powerful bull run. At worst that year, gold fell 18.8% from its 2011 peak. That was not quite enough to enter formal bear territory at a 20% drop. But 2013 to 2015 were definitely brutal bear years, which need to be excluded since gold behaves very differently in bull and bear markets.
In early 2013 the Fed’s wildly-unprecedented open-ended QE3 campaign ramped to full speed, radically distorting the markets. Stock markets levitated on the Fed’s implied backstopping, slaughtering demand for alternative investments led by gold. In Q2’13 alone, gold plummeted by 22.8% which proved its worst quarter in an astounding 93 years! Gold’s bear continued until the Fed’s initial rate hike of this cycle in 2015.
The day after that first rate hike in 9.5 years in mid-December 2015, gold plunged to a major 6.1-year secular low. Then it started rallying sharply out of that irrational rate-hike scare, formally crossing the +20% new-bull threshold in early March 2016. Ever since, gold has remained in this young bull. At worst last December after gold was crushed on the post-election Trumphoria stock-market surge, it had merely corrected 17.3%.
So the bull-market years for gold in modern history ran from 2001 to 2012, skipped the intervening bear-market years of 2013 to 2015, and resumed in 2016 to 2017. Thus these are the years most relevant to understanding gold’s typical summer-doldrums performance, which is necessary for managing your own expectations this time of year. This spilled-spaghetti mess of a chart is actually simple and easy to understand.
The yellow lines show gold’s individual-year summer price action indexed from each May’s final close for all years from 2001 to 2012 and 2016. That collectively establishes gold’s summer trading range. All those bull-market years’ individual indexes are then averaged together in the red line, revealing gold’s central summer tendency. Finally the indexed current-year gold action for 2017 is superimposed in blue.
While there are outlier years, gold generally drifts listlessly in the summer doldrums much like a sailing ship trapped near the equator. The center-mass-drift trend is crystal-clear in this chart. The vast majority of the time in June, July, and August, gold simply meanders between +/-5% from May’s final close. This year that equates to a probable summer range between $1205 and $1332. Gold has stayed well within trend.
Gold surged as high as $1293 in early June on a couple key events. On June’s first Friday, the headline May read on US monthly jobs came in at just +138k actual versus +185k expected. On top of that major miss, the internals were even worse with another -66k in past-month revisions! So gold powered 0.9% higher that day on gold-futures speculators’ hope such weak data would dampen the Fed’s hiking enthusiasm.
Just a couple trading days later, gold surged another 1.0% on a serious geopolitical rift opening between Qatar and its Arab neighbors. That early-summer strength was actually atypical, on the high side of all the modern bull-market years. And indeed it soon faded on mounting Fed-rate-hike fears leading into last week’s fourth rate hike of this cycle. Pre-rate-hike gold-futures selling is typical, as I just explained last week.
By this Tuesday gold had dropped 3.9% in just a couple weeks, really demoralizing traders and feeding bearish sentiment. But despite this volatility, gold hasn’t veered materially from its average of past bull-market years’ June price action. As long as gold remains well within its usual +/-5% summer-drift trading range, there’s nothing to get excited about either way. Gold is trapped adrift in the summer doldrums like a tall ship.
Understanding gold’s typical behavior this time of year is very important for traders. Sentiment isn’t only determined by outcome, but by the interplay between outcome and expectations. If gold rallies 5% but you expected 10% gains, you will be disappointed and grow discouraged and bearish. But if gold rallies that same 5% and you expected no gains, you’ll be excited and get optimistic and bullish. Expectations are key.
History has proven it’s wise not to expect too much from gold in these lazy market summers, particularly June and July. Occasionally gold still manages to stage a big summer rally, which is a bonus. Last year was a great example. In June 2016 gold first soared on an utterly-huge US-monthly-jobs miss, and later on that surprise UK-Brexit-vote outcome. Those anomalies early in a new bull made for an exceptional gold summer.
In this chart I labeled some of the outlying years where gold burst out of its usual summer-drift trend, both to the upside and downside. But these exciting summers are unusual, and can’t be expected very often. Most of the time gold grinds sideways on balance not far from its May close. Traders not armed with this critical knowledge often wax bearish during gold’s summer doldrums and exit in frustration, a grave mistake.
Gold’s summer-doldrums lull marks the best time of the year seasonally to deploy capital, to buy low at a time when few others are willing. Gold enjoys powerful seasonal rallies that start in August and run until the following May! These are fueled by outsized investment demand driven by a series of major income-cycle and cultural factors from around the world. Summer is when investors should be most bullish, not bearish.
The red average indexed line above encompassing 2001 to 2012 and 2016 reveals that gold stealthily carves a major seasonal low in mid-June. After that gold soon starts gradually grinding higher through July and August, before surging in September as gold’s usual autumn rally accelerates. Although this coming climb within gold’s summer-drift trend is subtle, it illustrates why June is the best time to deploy capital.
Gold’s momentum actually builds throughout the summers within the context of that +/-5% trading range off May’s final close. Gold averaged a nearly-dead-flat 0.1% loss in Junes between 2001 to 2012 and 2016. In July that reversed to a 0.8% average gain. And then in August as Asian buying starts coming back online, gold powered an average of 2.1% higher which is considerable. June is the worst of the doldrums.
These gold summer doldrums driven by investors pulling back from the markets to enjoy their vacation season don’t exist in a vacuum. Gold’s fortunes drive the entire precious-metals complex, including both silver and the stocks of the gold and silver miners. These are effectively leveraged plays on gold, so the summer doldrums in them mirror and exaggerate gold’s own. Check out this same chart type applied to silver.

Since silver is much more volatile than gold, naturally its summer-doldrums-drift trading range is wider. The great majority of the time, silver meanders between +/-10% from its final May close. Like gold, silver remains firmly in trend this year with nothing atypical going on. Interestingly silver’s major seasonal low arrives a couple weeks after gold’s in late June. And not surprisingly it is considerably deeper than gold’s.
Again using these red average lines, silver tends to drop 4.3% from the end of May to late June. That’s much greater than the 1.0% average gold loss from May’s final trading day to its own seasonal low in mid-June. So silver sentiment this time of year is often worse than gold’s, which is plenty bearish. Being in the newsletter business, I’ve heard from countless discouraged investors over the decades during the summers.
While I can’t quantify it, anecdotally it feels like silver investors are disproportionately represented in this bearish summer-doldrums feedback. Silver usually amplifies whatever is happening in gold, both good and bad. But again the brunt of this is borne in June, where silver averaged 3.2% losses during these bull-market years. Month-to-date this June, silver is down 5.1% which is roughly in line with past precedent.
Weathering June without waxing too bearish is the key to surviving the silver summer doldrums. Those June losses reversed sharply in July, which enjoyed a big 4.3% average rally! And those gains largely held in August, with a mere 0.6% average loss. Since gold is silver’s primary driver, this white metal is stuck in the same drifting boat as gold in the market summers. Fully expecting this prevents being disheartened.
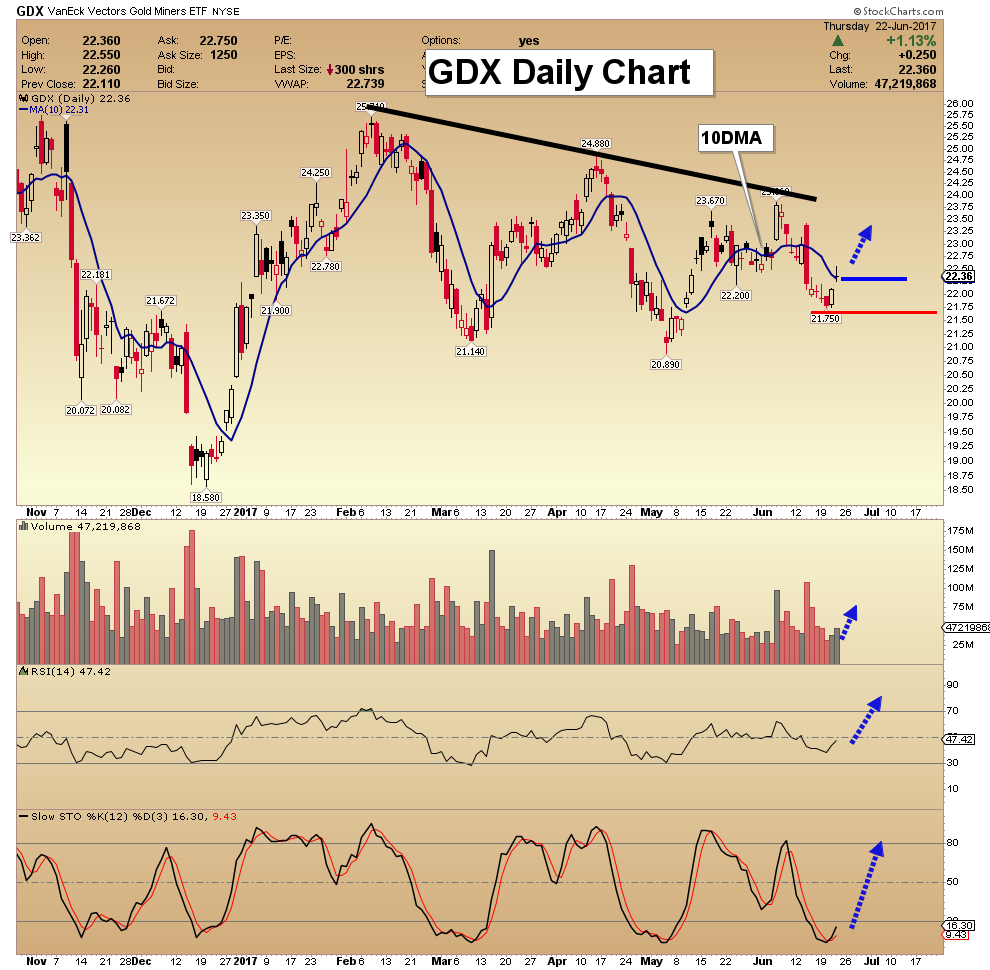
The gold miners’ stocks are also hostage to gold’s summer doldrums. This last chart applies this same analysis to the flagship HUI gold-stock index, which is closely mirrored by that leading GDX VanEck Vectors Gold Miners ETF. The major gold stocks tend to leverage gold’s gains and losses by 2x to 3x, so it’s not surprising that the HUI’s summer-doldrums-drift trading range is also twice as wide as gold’s own.

The gold stocks’ trading action this summer has closely mirrored and amplified gold’s, surging in early June before slumping hard in the past couple weeks. Yet the HUI still remains near the middle of its usual summer-doldrums-drift trading range of +/-10% from May’s final close. As you can see, the gold stocks indeed trade within this range the vast majority of the time during modern bull-market summer years.
The red average of these individually-indexed gold-stock summers behaves very similarly to gold’s. The HUI tends to bottom in mid-June on the very day gold does seasonally. The average loss by that point is 2.3% since the end of May. By this week the HUI was down 4.0% month-to-date, also roughly in line with that summer-doldrums precedent. This typical June weakness tends to damage prevailing gold-stock sentiment.
But just like in gold, this early summer-doldrums hit for the gold stocks marks their best seasonal buying opportunity of the year! These gold miners tend to rally strongly on balance between August and the following May. So it’s important to weather the June weakness without getting bearish enough to flee. And that’s a whole heck of a lot easier if you fully expect the summer doldrums and prepare psychologically.
On average in modern bull-market Junes, the HUI has actually climbed 1.2%. A similar performance this year would put it at 194.8 by month-end, up 3.7% from this week’s levels. Gold stocks then tend to drift in July, with modest 0.7% losses on average. But in August as gold starts powering higher again on big Asian buying, the gold stocks accelerate to considerable 3.9% average gains. Late summer gets much better.
Like everything in life, withstanding the precious-metals summer doldrums is much less challenging if you know they’re coming. While outlying years happen, they are fairly rare. So the only safe bet to make is expecting gold, silver, and the stocks of their miners to languish in June and July. Then when these drifts again come to pass, you won’t be surprised and won’t get too bearish. That will protect you from selling low.
Gold, and therefore silver and their miners’ stocks, are actually looking very bullish this year. Gold’s new bull market ignited by that first Fed rate hike of this cycle in December 2015 remains very much alive and well. Gold rallied strongly out of the first three Fed rate hikes of this cycle, and as I outlined last week it’s very likely to rally out of the recent fourth. Unfortunately the doldrums have delayed this post-hike surge.
But it’s still coming after this usual seasonal lull passes. Investors worldwide are radically underinvested in gold after the extreme Trumphoria stock-market surge since the election. Gold is a unique asset that tends to move counter to stock markets, making it the ultimate portfolio diversifier. Thus gold investment demand wanes when stock markets are near record highs, then surges when they inevitably roll over again.
With today’s massive Fed-goosed stock bull the second-longest and nearly-third-largest ever seen in US history, a day of reckoning is nearing. Sooner or later this extreme bull will yield to a major correction-grade selloff or more likely the long-overdue subsequent bear. As stock markets inevitably weaken, gold will catch a major bid as investment capital floods back in to attempt to diversify today’s stock-heavy portfolios.
Smart investors, including billionaire hedge-fund managers, have been accumulating gold positions in anticipation of this coming huge demand surge. As the summer doldrums pass in the coming weeks and gold starts grinding higher again, gold investment buying will pick up whether or not stock markets have started to weaken. The usual Asian harvest buying will start in late July regardless of what’s going on here.
Gold and especially its miners’ stocks remain deeply undervalued today, with powerful mean reversions higher ready to continue after their summer-doldrums pauses. The coming big seasonal gold rallies after this typically-weak spell can be played with major ETFs like GDX. But the individual stocks of elite gold miners with superior fundamentals will really outperform their sector, offering amazing upside potential.
At Zeal we never rely on prevailing herd sentiment, which often misleads traders into making the wrong decisions. Instead we study market history, as broader perspective is essential to thriving in markets. It helps short-circuit dangerous greed and fear, enabling prudent traders to fight the crowd to walk the walk of buying low and selling high. All investors greatly benefit from being armed with a studied contrarian worldview!
So we share our research and trades via acclaimed weekly and monthly newsletters. They draw on our vast experience, knowledge, wisdom, and ongoing research to explain what’s going on in the markets, why, and how to trade them with specific stocks. As of Q1, all 928 newsletter stock trades recommended since 2001 have averaged stellar annualized realized gains of +22.0%! For just $10 an issue, you too can learn to think and thrive like contrarians. Subscribe today!
The bottom line is gold, and therefore silver and their miners’ stocks, usually drift listlessly during market summers. As investors shift their focus from markets to vacations, capital flows wane. June and July in particular are simply devoid of the big recurring gold demand surges seen during much of the rest of the year, leaving them weak. Investors need to expect lackluster sideways action on balance this time of year.
So there’s no reason to be bearish on the precious-metals complex today despite the recent weakness. Gold, silver, and their miners’ stocks remain well within their usual summer-doldrums-drift trends this year. This June weakness is actually the best time of the year seasonally to buy low and get long, ahead of the major autumn, winter, and spring gold and gold-stock rallies. Don’t fear the summer doldrums, embrace them!
Adam Hamilton, CPA
June 23, 2017
Copyright 2000 – 2017 Zeal LLC (www.ZealLLC.com)
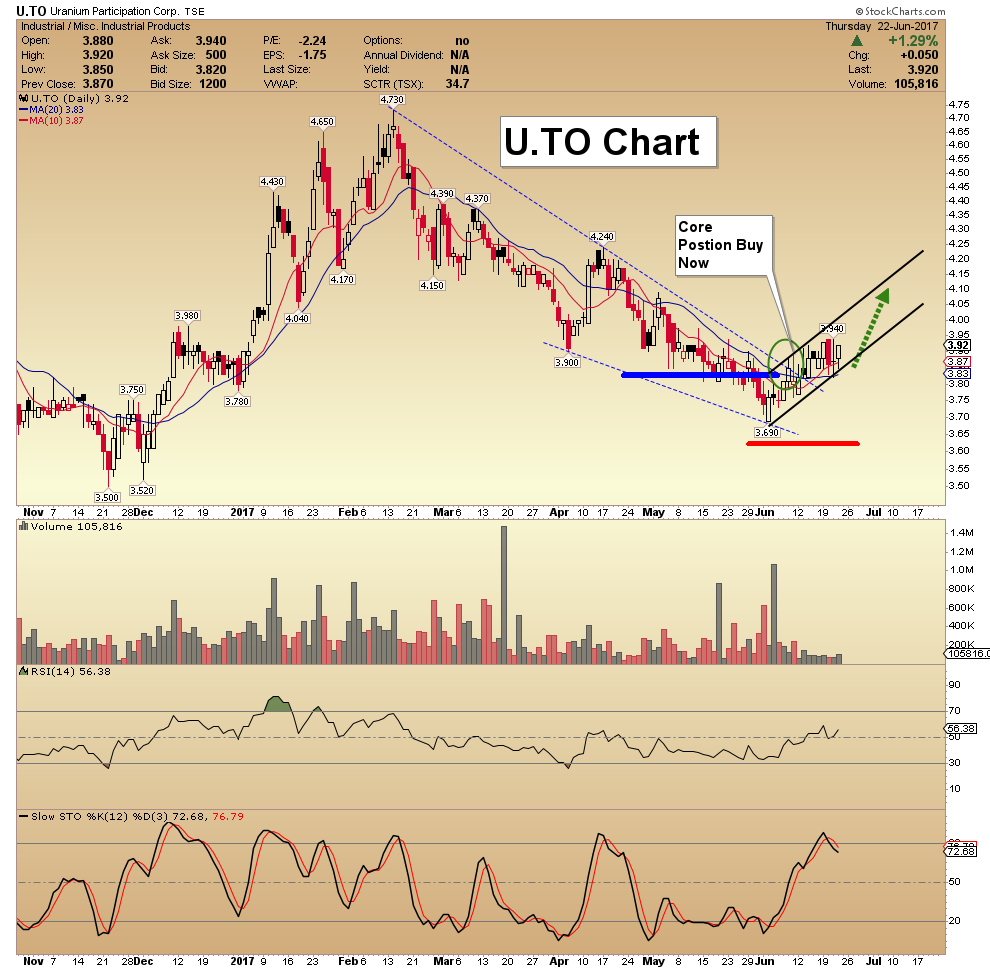
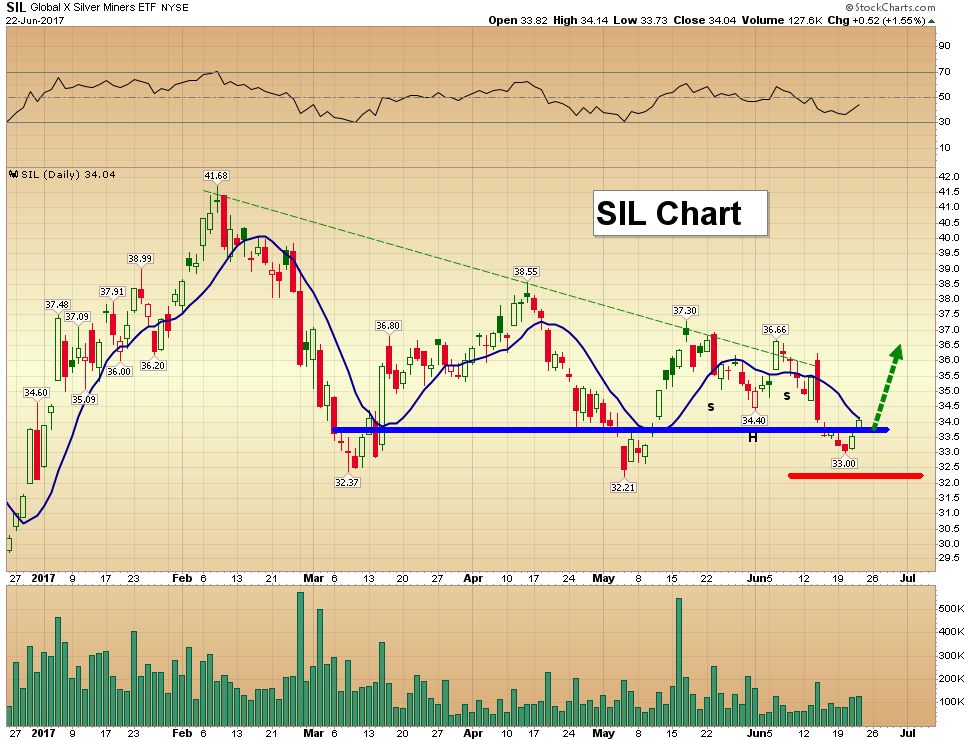
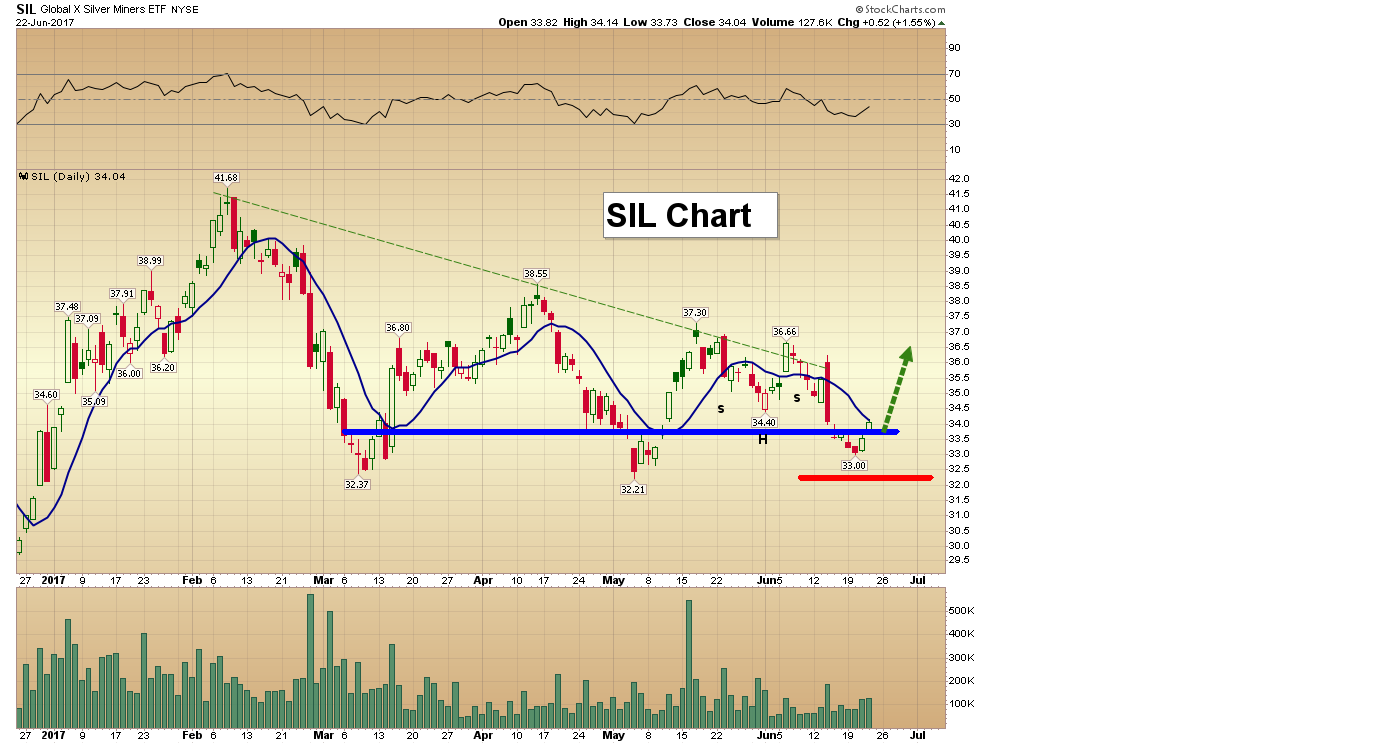
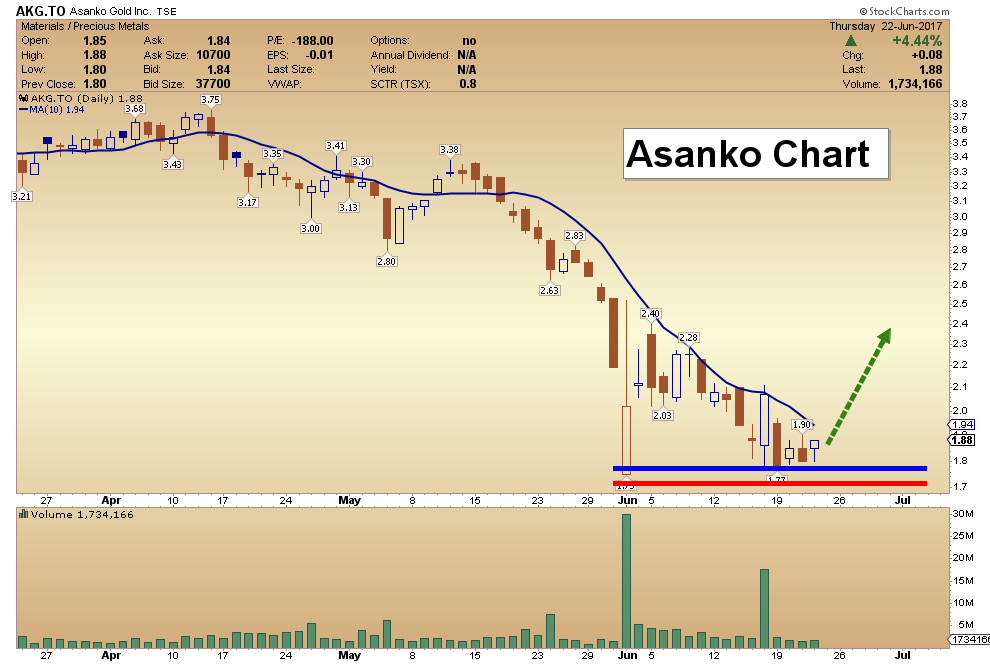
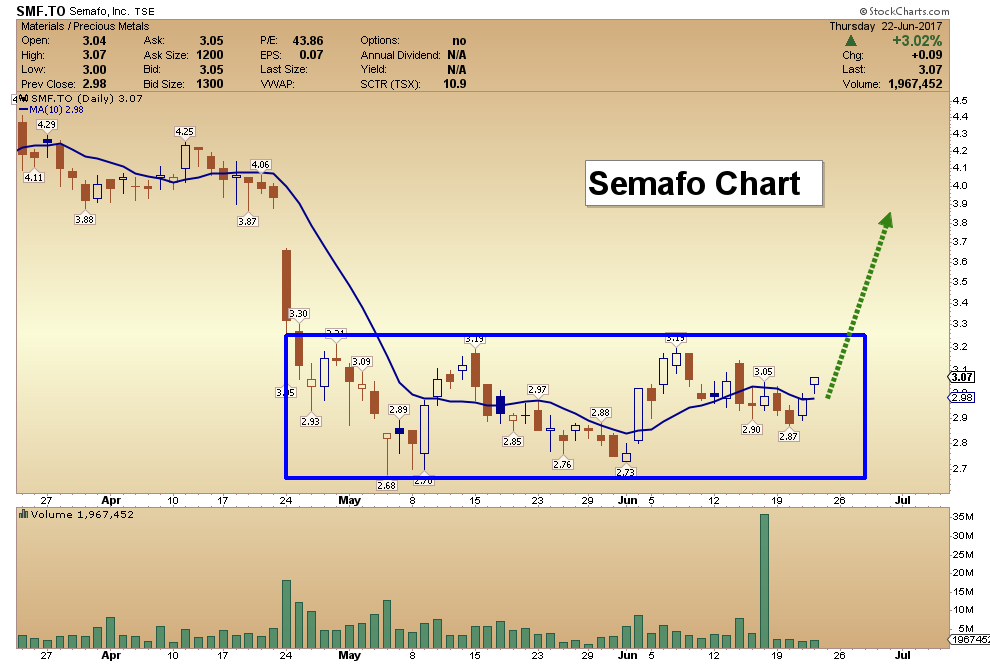
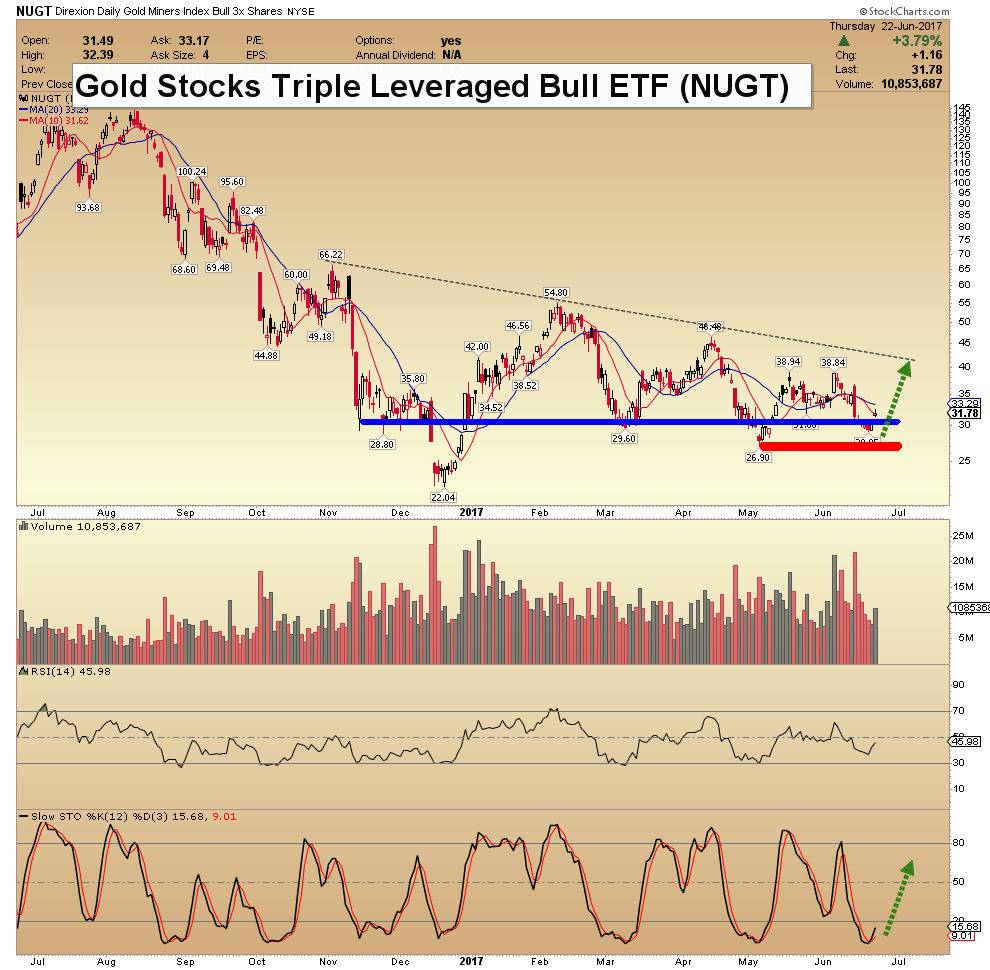
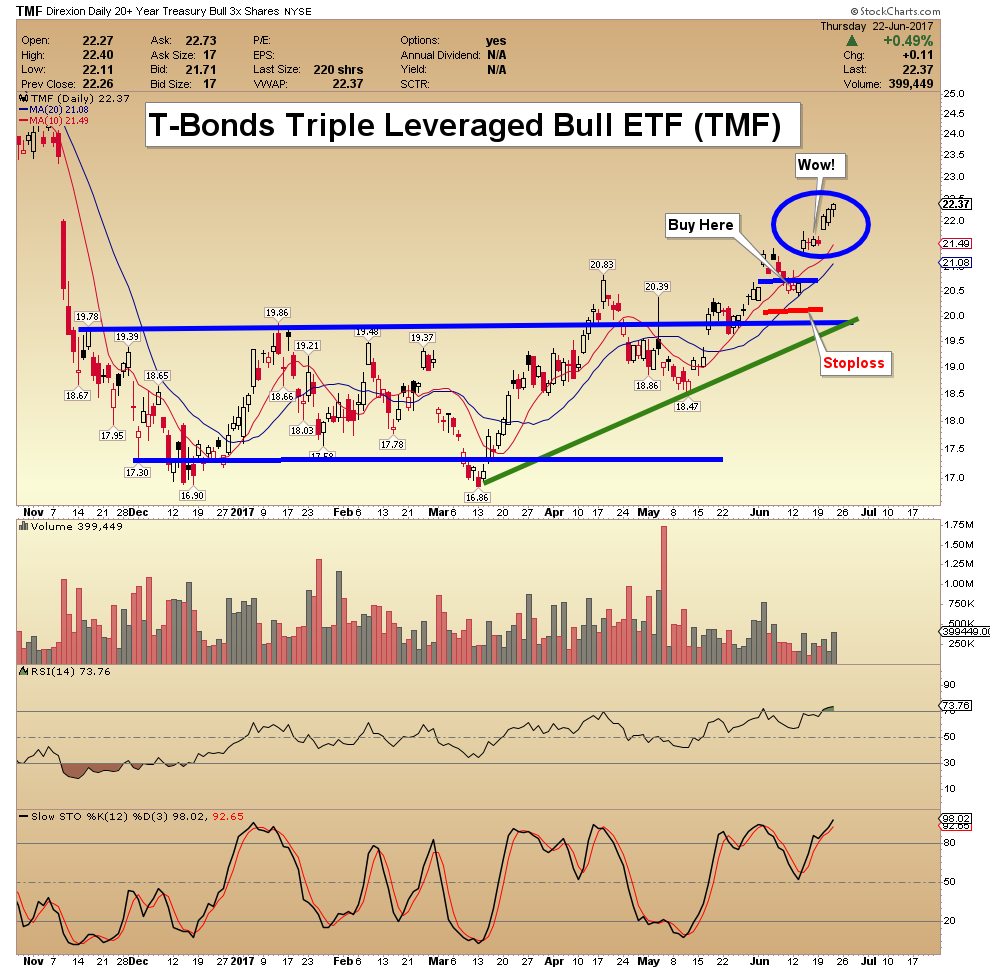
Today’s videos and charts (double click to enlarge):
SFS Key Tactics & Video Update

SF60 Key Tactics & Video Update

SF Juniors Key Tactics & Video Analysis


SF Trader Time Key Tactics & Video Analysis
Morris
website: www.superforcesignals.com
email: trading@superforcesignals.com
email: trading@superforce60.com
SFS Web Services
1170 Bay Street, Suite #143
Toronto, Ontario, M5S 2B4
Canada

People are just starting to grasp why deflation is also present in the USA. Despite all the screaming about Quantitative Easing, most remain confused why hyperinflation has not taken place. Most are Oblivious to the fact that there is a dynamic process involved that is a lot more complex than traditional economics teaches in school. Sorry, but the quantity of money theory does not work. It is way too simplistic and this has led to massive confusion. Even the central bankers are starting to call with questions. Economics is just not as it seems and it has ignored international capital flows confining all analysis to purely domestic situations.
 The latest news that Amazon was buying Whole Foods saw a plunge in retail and grocery stocks. Amazon put book stores on the list of bankruptcy victims and we see similar troubles for Sears, the company that made its name using the railroads to deliver goods by mail order – the internet of the 19th century.
The deflationary tone has been in place since 2015.75 and it is a combination of problems, one of which is the technology advancement. Many people see the advance of robots displacing jobs. However, the reason unemployment rose dramatically to 25% during the Great Depression was not from the collapse of industry. It was (1) the advancement of technology with the combustion engine that wiped out agricultural jobs (aside from the horse industry) and (2) the vast dust bowl which then wiped out farms entirely.

Waterloo Boy N improved, November 1920.
 In 1888, the first steam tractors appeared on American farms. John Froelich of Iowa built and sold the first two successful gasoline tractors in 1892. It was the Hart Parr Gasoline Engine Company of Charles City, Iowa, who first coined the term “Tractor” in 1903. More than 100 companies began to manufacture tractors between just 1916 to 1922. John Deere bought out the Waterloo Gasoline Engine Company in 1918 becoming dominant in the field and then by 1927.
The Amazon takeover of Whole Foods is highlighting this technology shift. The jobs of the future will be more in the technology programming area. All the office spaces I looked at for moving our office were, without exception, law firms closing down. Lawyers are now far too common and we are seeing their saturation reducing the once high paying jobs that enticed kids into law school. Both law and medicine are in their downward slopes of the business cycle.
Cyclically, everything evolves. Retail stores are declining and Amazon has been opening showrooms rather than stores. You get to go touch the product and it will be delivered to your home. They are also bringing in fully automated stores. You will have an app on your phone, walk into a store, take whatever you want, and your card will be billed as you walk out the door. There go the store clerks.
Things are changing rapidly. The high cost of labor because of Obamacare has been destroying a lot of jobs. The first thing your accountant tells you is not to hire employee number 26. Technology is helping to reduce the high cost of labor, which is being driven up because of taxes and healthcare which the employee never sees.

 Improving your skills for the future is absolutely paramount to survive. Look to technology in engineering and programming to be the top fields into the future. For now, as the cost of labor declines, this results in deflation the same as took place during the 1930s thanks domestically to the technology advances in agriculture since that accounted for 40% of the civil work force in 1900 and then it was hammered by the Dust Bowl.
…also from Martin: Market Talk- June 21st, 2017
&
The Most Hated Bull Market in History

-
I know Mike is a very solid investor and respect his opinions very much. So if he says pay attention to this or that - I will.
~ Dale G.
-
I've started managing my own investments so view Michael's site as a one-stop shop from which to get information and perspectives.
~ Dave E.
-
Michael offers easy reading, honest, common sense information that anyone can use in a practical manner.
~ der_al.
-
A sane voice in a scrambled investment world.
~ Ed R.
Inside Edge Pro Contributors

Greg Weldon

Josef Schachter

Tyler Bollhorn

Ryan Irvine

Paul Beattie

Martin Straith

Patrick Ceresna

Mark Leibovit

James Thorne

Victor Adair