
Gold & Precious Metals
- This indicator says gold is about to kick off a major buying opportunity
- Simple chart pattern that holds the key to making money in metals
- Plus: The next trade triggers Thursday…
If you’re thinking about buying gold, pay close attention…
A major buying opportunity is about to ignite in everyone’s favorite precious metal.
But you won’t uncover this buy signal by visiting mines, studying gold production, or watching CNBC. In fact, I couldn’t even see it with my naked eye. I needed a sophisticated computer program to alert you to this hidden opportunity.
It was our in-house “quant” Jonas Elmerraji who spotted it thanks to the proprietary indicator he has spent the last five years coding.
And the window is about to kick off this week.
The signal Jonas has pinpointed is highly reliable. It’s made investors money almost 80% of the time over the last 12 years. His system has nailed the price action in gold this year. And that’s not the result of some hypothetical back test, either. In fact, Jonas shared his research on gold with you back in March…
Have a look at an indicator called the Kinetic Composite for GLD, the popular SPDR Gold ETF (NYSE:GLD):
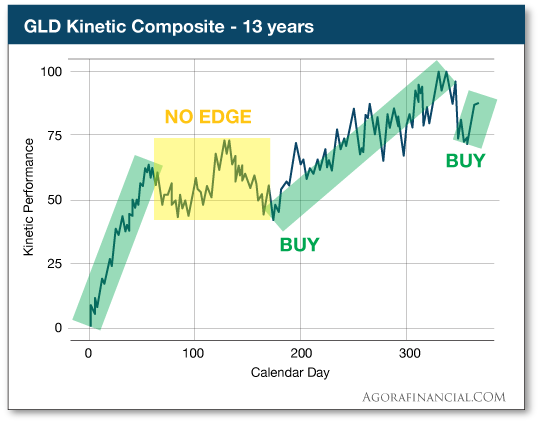
You can think of the Kinetic Composite chart above as a sort of “idealized” price chart for GLD. Jonas’ algorithm crunches decades of price data and mutates it into the chart above. It shows you when a stock is predisposed to rally… up to a year in advance.
You can see how the Kinetic Composite signaled a rally at the start of the year, followed by a volatile sideways period, and then another rally kicking off this summer.
Here’s how GLD’s price has played out in the months since:
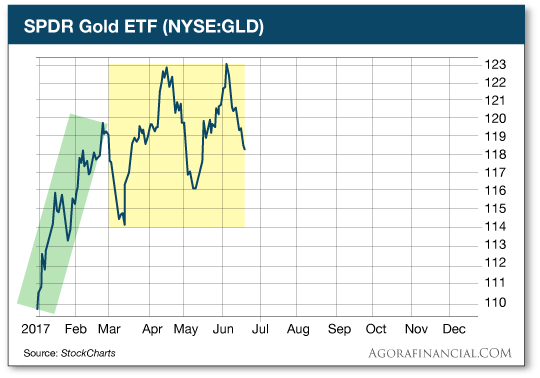
It’s been dead on, from the rally at the beginning of the year, followed by a volatile sideways stretch
Back in March, Jonas recommended staying away from gold during the unpredictable spring months when traders have no statistical edge on gold prices. That’s been a good bet. Gold has gone nowhere — and there have been a lot of opportunities to lose money during the wide swings.
Now, gold looks ready to kick off its next major K-Sign buy signal.
Here’s a quick refresher:
A K-Sign is the 100% proprietary pattern that’s formed by the simplified price line of a stock and its Kinetic Composite. It looks like this:
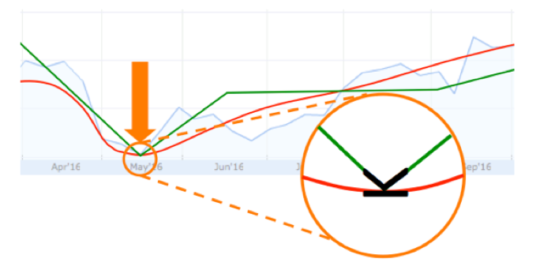
When you see that pattern, the one that looks like a “K” tipped on its back, it means you’re looking at an important buy signal.
Here’s where the next K-Sign triggers in gold:
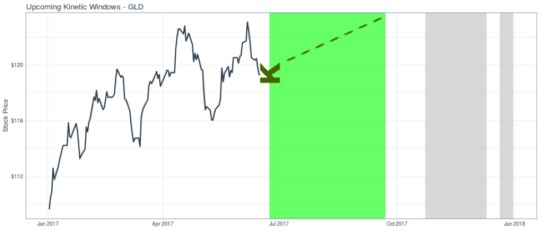
This dead-simple price chart is all you need to look at to make money in gold in 2017.
It shows the next Kinetic Window in gold and the K-Sign date that kicks it off. That date is June 23 – this Friday.
Of course, you might have already known that if you read Jonas’ last gold update in these pages back in March. He told you about the June 23 K-Sign way back then.
Greg Guenthner
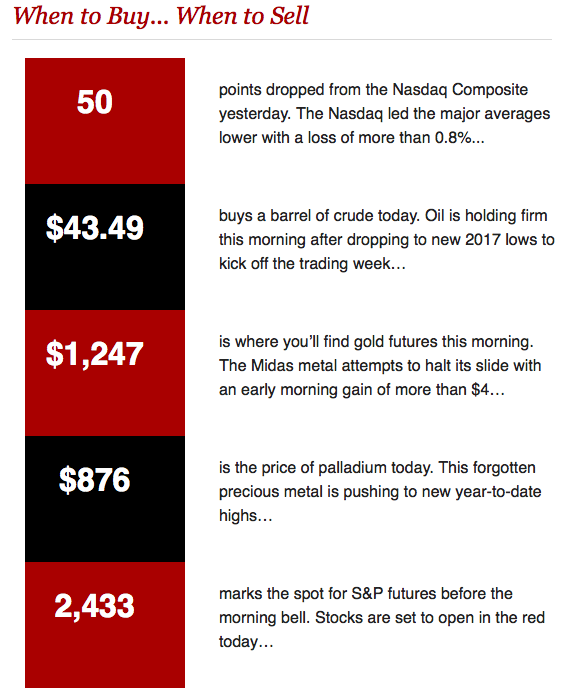
Rude Numbers

One of the most important economic debate today is whether the economy will experience reflation or deflation (or low inflation) in the upcoming months. Has the recent reflation been only a temporary jump? Or has it marked the beginning of a new trend? Is the global economy accelerating or are we heading into the next recession? It goes without saying that it is a key investment issue because of the implications for different asset classes, including the precious metals. Let’s try to outline the macroeconomic outlook.
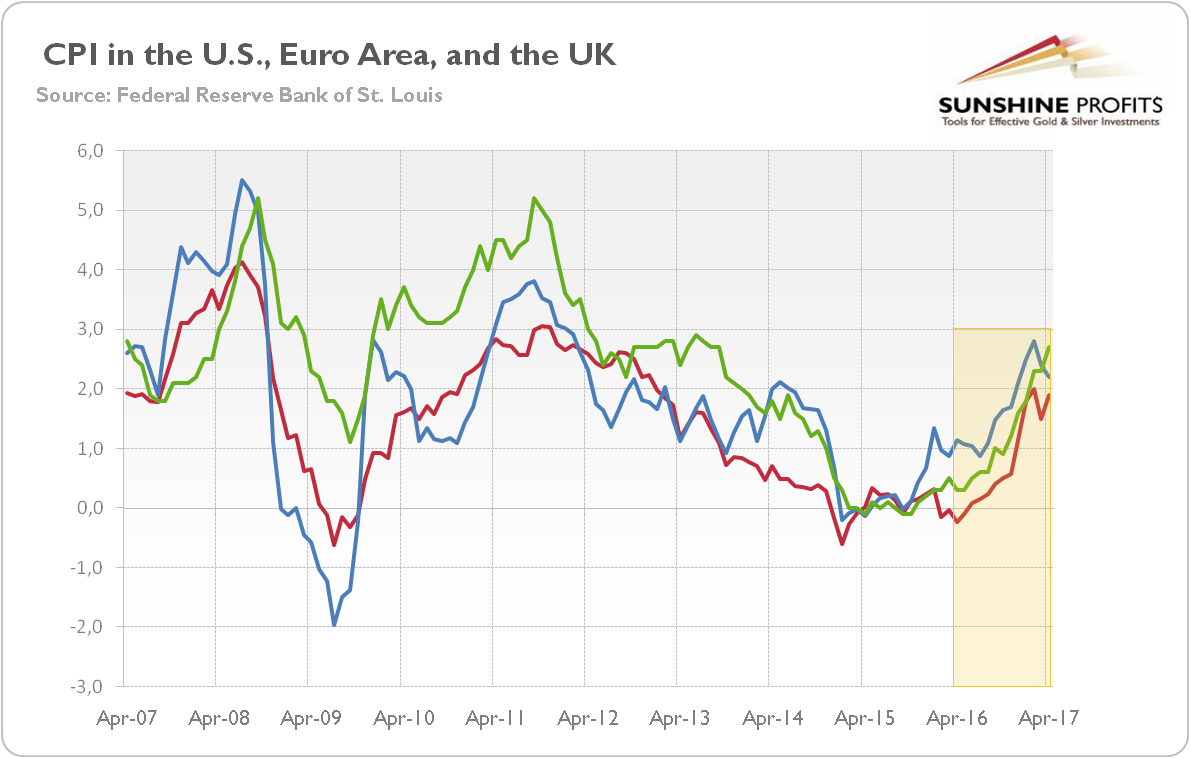
As one can see in the chart below, inflation has recently risen both in the U.S. and the euro area. And inflation in the UK has really accelerated recently. It’s true that there was a slowdown in the U.S. after a peak in February, but the level of inflation rates remains much higher than in 2014-2015.
Chart 1: The CPI rate year-over-year for the U.S. (blue line), the Eurozone (red line), and the UK (green line) over the last ten years.
(Click to enlarge)
The same applies to inflationary expectations in the U.S. As the chart below shows, there was some pullback in expected inflation rate by the markets, but we do not anticipate a return to the lows of early 2016.
Chart 2: The monthly averages of U.S. spot inflation expectations derived from 10-year Treasuries (red line) and the forward inflation expectations derived from 5-year and 10-year Treasuries (blue line) over the last ten years.

(Click to enlarge)
Why do we believe that? Well, indicators of global growth have picked up since 2016. And worries about deflation in Japan and the Eurozone have practically vanished. Actually, Germany, which is Europe’s largest economy, grew 0.6 percent in the first quarter of 2017, accelerating from the previous year and outstripping other developed countries, including the U.S.
Admittedly, the American economy slowed in the beginning of the 2017, but there is the well-known seasonal adjustment bias in the U.S. GDP data. The growth rate remains solid and the official data should be much better in the upcoming quarters. Moreover, the rest of the world economy has been accelerating. The IMF upgraded its forecast for global growth in April. The world economy is expected to increase 3.5 percent this year, up from 3.1 percent last year.
Surely, there are risks to reflation. For example, Trump’s ability to deliver his proposed tax cuts is still under question – especially after latest political turmoil associated with Comey’s firing which can derail implementation of highly expected fiscal stimulus.
However, reflation is something bigger than expansionary fiscal policy (and the new administration may deliver something finally). Actually, last year, reflation started in China. We agree that China’s economic transition from export-led growth to a model based more on consumption and services may be turbulent and lead to an economic slowdown, fueling deflationary forces. There are some legitimate reasons to worry about the credit cycle in China, but the recent slowdown in momentum (the producer price inflation peaked in February 2017) may be only temporary pullback. In November, there is China’s National People’s Congress, and it is unlikely that the country will not meet its official GDP growth target set at 6.5 percent for 2017.
And one more thing: corporate profits. They have been accelerating since the end of 2015, when nobody even thought that Trump could become the POTUS and cut taxes. It shows that the reflation trade – although hit by vanishing optimism about quick implementation of Trump’s pro-growth agenda – is something more than blind faith in the new administration. Stock prices have rallied because corporate profits have also risen, as one can see in the chart below.
Chart 3: U.S. corporate profits after tax without inventory valuation adjustment and capital consumption adjustment (blue line, left axis, in billions of $), U.S. corporate profits after tax with inventory valuation adjustment and capital consumption adjustment (green line, left axis, in billions of $), and S&P 500 index (red line, right axis, index) between 2007 and 2016.

(Click to enlarge)
Summing up, after the burst of the 2008 global financial crisis, some investors started to worry about high inflation, while others feared of deflation. Neither extreme scenario has come to fruition – instead, the world entered a period of low inflation. In 2016, reflation has emerged, which got an additional boost after Trump’s victory in the presidential election. Recently, the faith in Trump’s ability to deliver pro-growth actions in a smooth manner has faded. However, it’s premature to abandon the reflation theme. Unfortunately, it’s bad news for the gold market. The acceleration in economic growth, but with inflation kept under control, would increase the real interest rates, putting downward pressure on the yellow metal.
By Arkadiusz Sieron


It was exactly one month ago we discussed our posture as a “bearish Gold bull.”
The gold mining sector hit a historic low nearly 18 months ago but this new cycle has struggled to gain traction as metals prices have stagnated while the stock market and the US Dollar have trended higher. Unfortunately recent technical and fundamental developments argue that precious metals could come under serious pressure in the weeks and months ahead.
First let me start with Gold’s fundamentals, which turned bearish a few months ago and could remain so through the fall. As we have argued, Gold is inversely correlated to real interest rates. Gold rises when real rates fall and Gold falls when real rates rise.
Real interest rates bottomed in February and have trended higher ever since. As we know, the rate of inflation has peaked and is declining. Meanwhile, the fed funds rate has increased while bond yields have remained stable. The real fed funds rate and the real 5-year yield have increased by 1% in recent months. If inflation falls by another 0.5% and the fed funds rate is increased by another quarter point, then the real fed funds rate would be positive by the end of the year. That would mark a 2% increase inside of 10 months.

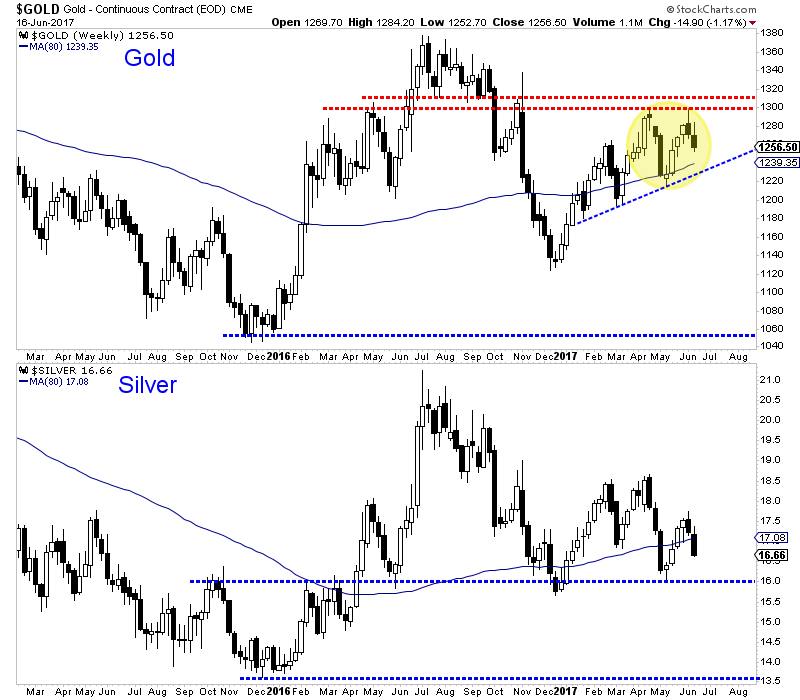
Turning to the technicals, we see that Gold is starting to follow Silver’s lead. Silver is very weak and headed for a test of $16/oz. Last week Gold formed a bearish reversal at major resistance ($1300/oz) and closed the week in the red and even below its April high. If Gold breaks its 2017 uptrend then it is likely to retest the $1125/oz level. There will be rebounds along the way but both metals are at serious risk of retesting their bear market lows.
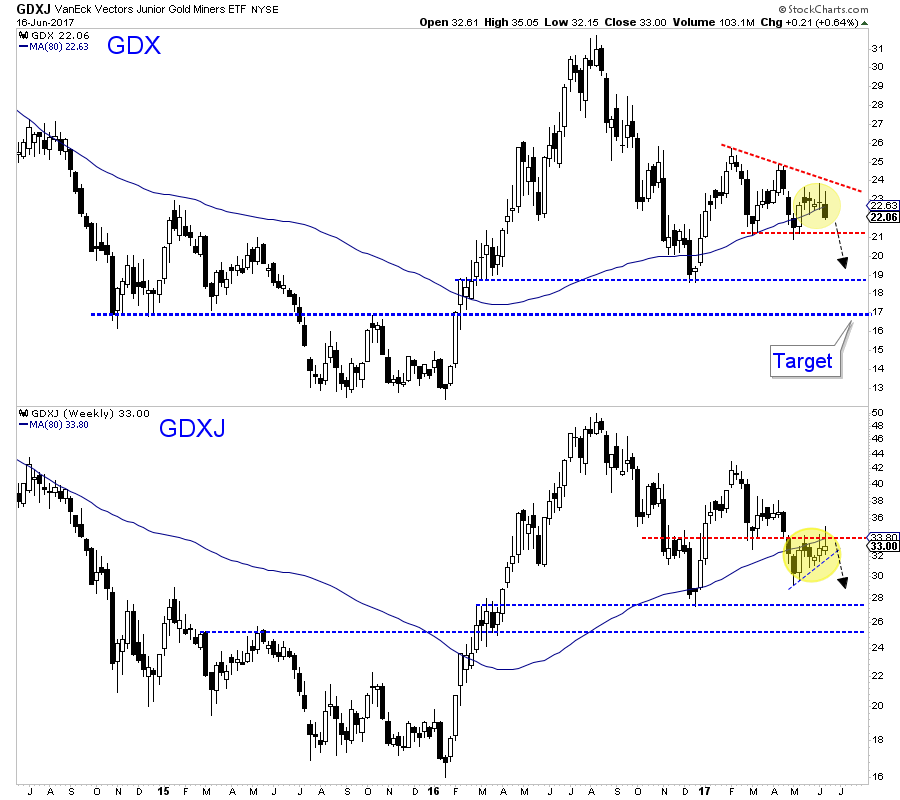
The miners, which have lagged the metals since February could be close to a technical breakdown. Since February GDX has consolidated within a descending triangle. The candlestick action of the past several weeks is favoring a break of support at $21. The measured downside target would be $17. Meanwhile, GDXJ has outperformed in recent weeks as the rebalancing has come and gone. It may continue to outperform but if the sector breaks lower it will not be spared.
Both the technicals and fundamentals argue there is increasing downside risk in the precious metals sector. Real interest rates are rising and as the rate of inflation continues to fall, Gold will come under pressure even if nominal rates don’t rise. From a bird’s eye view, the price action in Gold and Silver so far this year is corrective, meaning it is a correction of the sharp downtrend seen in the second half of 2016. There is a strong risk of that downtrend reasserting itself and metals ultimately retesting their bear market lows before the end of this year. With respect to the gold stocks, the initial downside target is the December 2016 lows which could be reached in the next month.
Jordan Roy-Byrne CMT, MFTA
Despite hitting new all-time highs on the Dow this week, the major index has now seen 6 Titanic or Hindenburg Omen  warnings in the past 30 days! An illustration showing the warnings is included in this piece.
Another Nasdaq Warning
June 16 (King World News) – From Jason Goepfert at SentimenTrader: On Thursday, there were more stocks that slid to a 52-week low on the Nasdaq than rallied to a 52-week high. Coming so soon after a new high in the Nasdaq Composite, this triggered a Titanic Syndrome signal. There have now been 6 Titanic or Hindenburg Omen warning signs in the past 30 days, one of the larger clusters during this bull market…
…also from KingWorldNews:
Celente – This Trigger For A Global Stock Market Crash Will Devastate The World

-
I know Mike is a very solid investor and respect his opinions very much. So if he says pay attention to this or that - I will.
~ Dale G.
-
I've started managing my own investments so view Michael's site as a one-stop shop from which to get information and perspectives.
~ Dave E.
-
Michael offers easy reading, honest, common sense information that anyone can use in a practical manner.
~ der_al.
-
A sane voice in a scrambled investment world.
~ Ed R.
Inside Edge Pro Contributors

Greg Weldon

Josef Schachter

Tyler Bollhorn

Ryan Irvine

Paul Beattie

Martin Straith

Patrick Ceresna

Mark Leibovit

James Thorne

Victor Adair