
Gold & Precious Metals
We “went walkabout” over the past several years, largely deserting the Precious Metals sector for other greener pastures, because it has been performing so poorly, apart from a dramatic flurry during the 1st half of last year. However, the latest charts suggest that a major bullmarket is incubating in the sector and that it won’t be much longer before it starts. This being so it is time for us to return to take positions ahead of its commencement.
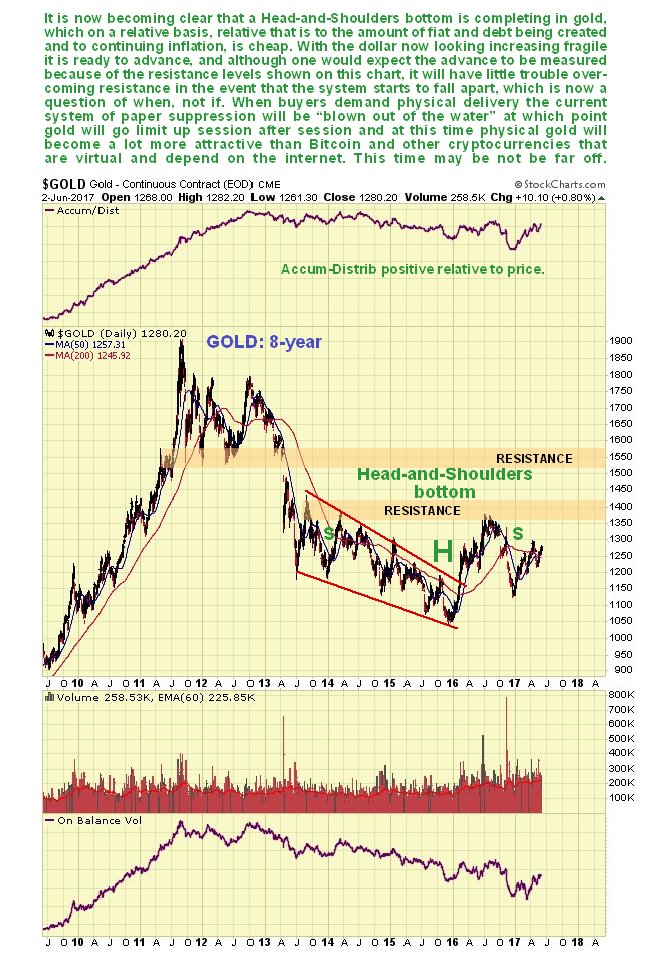
We will now proceed to look at the latest long-term charts for gold, silver, Precious Metals stocks and also the dollar to identify the signs of the impending major bullmarket in gold and silver. On the 8-year chart for gold it is now becoming apparent that a large Head-and-Shoulders bottom is completing, that started to form way back in 2013, so this is a big base pattern that should lead to a major bullmarket, and given what is set to go down in the debt and derivatives markets it should easily exceed earlier highs. With the benefit of this long-term chart we can also put the sizeable runup during the 1st half of last year into context – it was the advance to complete the “Head” of the Head-and-Shoulders bottom. This being so we can also readily understand why it then gave back about half of these gains – it dropped back to mark out the Right Shoulder of the pattern, and the good news is that with this late stage of the pattern now approaching completion, we can look forward to more serious gains soon. The new bullmarket will be inaugurated by the price rising above the 1st zone of resistance shown, although it will then have to contend with another major zone of resistance in the $1550 area. However, if the credit markets are coming apart at this time, this shouldn’t prove to be much of an obstacle.
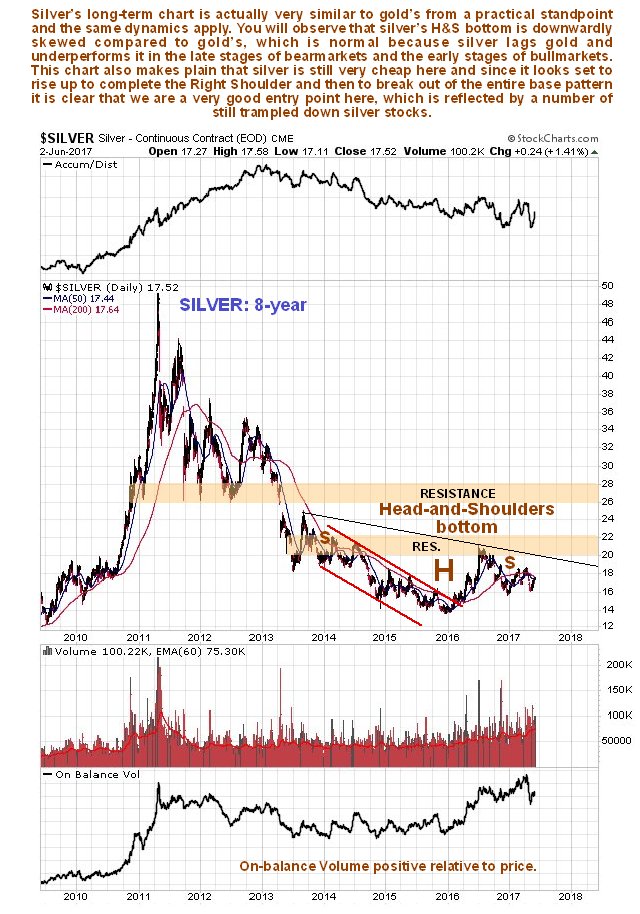
The 8-year chart for silver is quite similar to that for gold, as one would expect, except that it is skewed downwards because silver tends to underperform gold during the late stages of sector bearmarkets and the early stages of bullmarkets, but it certainly looks like a good entry point for silver and silver related investments here, with it still only $4 off its lows.
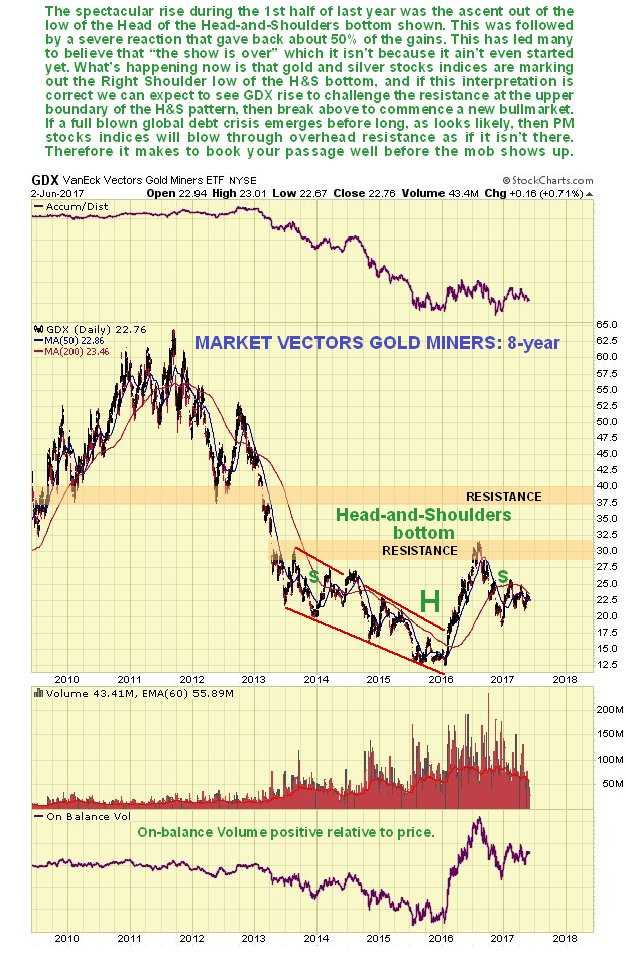
The 8-year chart for the PM stocks index proxy, GDX, also looks very similar to that for gold, except that it is somewhat upwardly skewed, which reflects the wild excitement of speculators in this sector once they sense a turn. There was a really big percentage gain during the 1st half of last year as it came off a really low level, but as with gold what was happening was that GDX was rising up to complete the Head of the Head-and-Shoulders bottom pattern. Once it had done so a reaction set in which saw stocks lose about 50% of their gains before stabilizing, with this reaction serving to mark out the Right Shoulder of the pattern. Now it looks ready to advance up to the neckline of the pattern to complete it and set the stage for the nascent bullmarket to come, and just this part of the advance will result in big gains in many trampled down stocks, some of which we will be looking at in a separate article.
Despite the downsloping moving averages, there is evidence of coiling on the 6-month GDX chart, and this combined with the suspected bull Flag of the past couple of weeks could lead to a surprise strong rally soon…
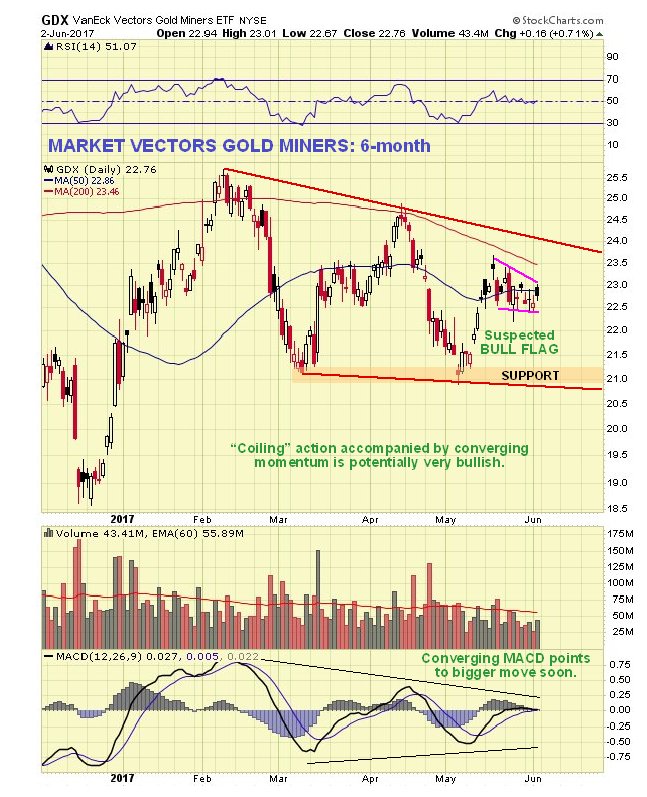
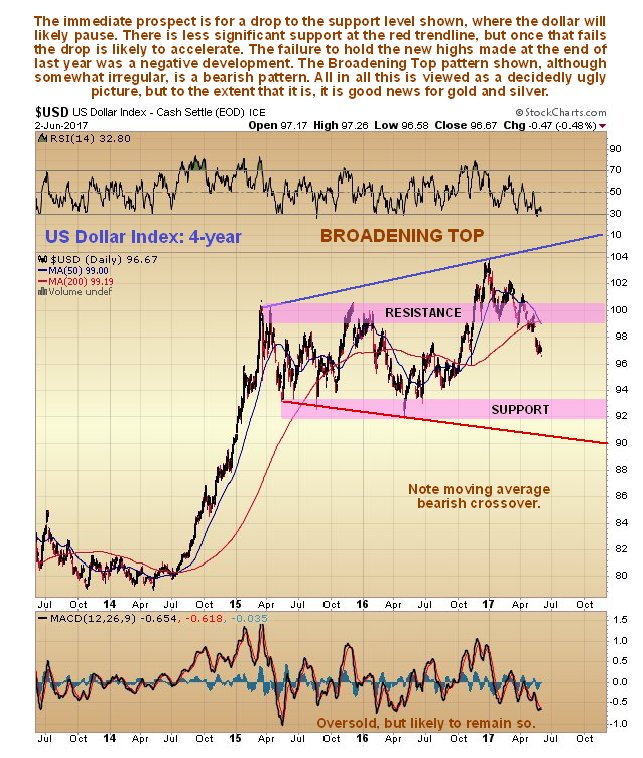
Many are expecting the sector to weaken again, citing the falling 200-day moving average on the indices, poor seasonals until the end of June, and an expectation that the dollar will rally from oversold. With respect to these factors it is worth pointing out firstly as regards the falling 200-day moving average, that the high values at the peak around last August will soon drop out, causing it to flatten, especially if we see a rally. Secondly, the poor seasonals are a background influence, and didn’t stop the sector from advancing during June of last year. Thirdly, as we will now see, the dollar looks like it is tipping into a severe decline, oversold or not. On the 8-year chart for the dollar, we can see how the it broke out above resistance to new highs on euphoria over Donald Trump’s election victory, but it was subsequently unable to hold on to these gains, and has slumped back into the large trading range, a bearish development, particularly as the entire pattern from early 2015 now looks like a giant bearish Broadening Top. Having broken down back into the pattern and below its 200-day moving average, which is rolling over, it now looks like it will continue lower to the key support level at the bottom of the pattern, as a 1st stop, despite its already being significantly oversold. If it breaches this support there is some support lower down at the red trendline, which marks the lower boundary of the Broadening Top, but if it breaks below that things could quickly get a lot more serious.
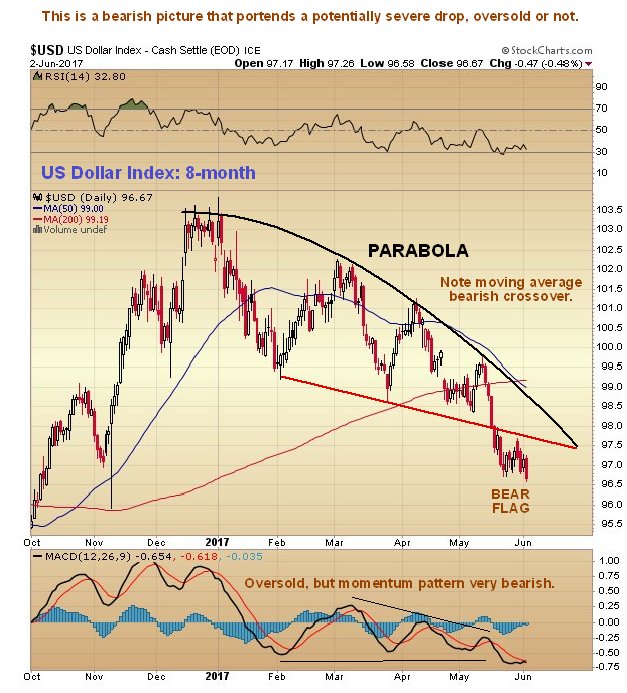
On the 8-month chart for the dollar index we can see recent action in much more detail. This is an interesting chart for it shows that the dollar has been weakening beneath a parabolic trendline that is forcing it lower at an accelerating pace. There has been some talk about it forming a minor base here over the past week or two, and rallying from oversold, but it doesn’t look like that is going to happen. Instead the small tight pattern of the past week to 10 days looks like a bear Flag that will lead to another steep drop, and it started to fall quite hard again on Friday. Such a move can of course be expected to lead to gains in the Precious Metals sector.
Should we see the usual seasonal dip in the Precious Metals sector during this month and possibly into July, it won’t alter the Big Picture set out here and it should be seized upon as a buying opportunity, although what we are seeing in the dollar now suggests that the seasonal dip may not happen this year.

Today’s videos and charts (double click to enlarge):
SF Signals Key Tactics & Video Analysis
SF Juniors Key Tactics & Video Analysis
SF60 Key Tactics & Video Analysis
SF Trader Time Key Tactics & Video Analysis
Thanks,
Morris
About Super Force Signals:
Our Surge Index Signals are created thru our proprietary blend of the highest quality technical analysis and many years of successful business building. We are two business owners with excellent synergy. We understand risk and reward. Our subscribers are generally successfully business owners, people like yourself with speculative funds, looking for serious management of your risk and reward in the market.
Frank Johnson: Executive Editor, Macro Risk Manager.
Morris Hubbartt: Chief Market Analyst, Trading Risk Specialist.
website: www.superforcesignals.com
email: trading@superforcesignals.com
email: trading@superforce60.com
SFS Web Services
1170 Bay Street, Suite #143
Toronto, Ontario, M5S 2B4
Canada

If we look at gold from the long-term perspective, it’s clear that it hasn’t really done much in the recent months – it’s trading in the $1,200 – $1,250 range, which is where it was in the first half of 2016, first half of 2015, for most of 2014 and in the second half of 2013. Overall, despite short-term and medium-term price swings, not much has happened in the past few years.
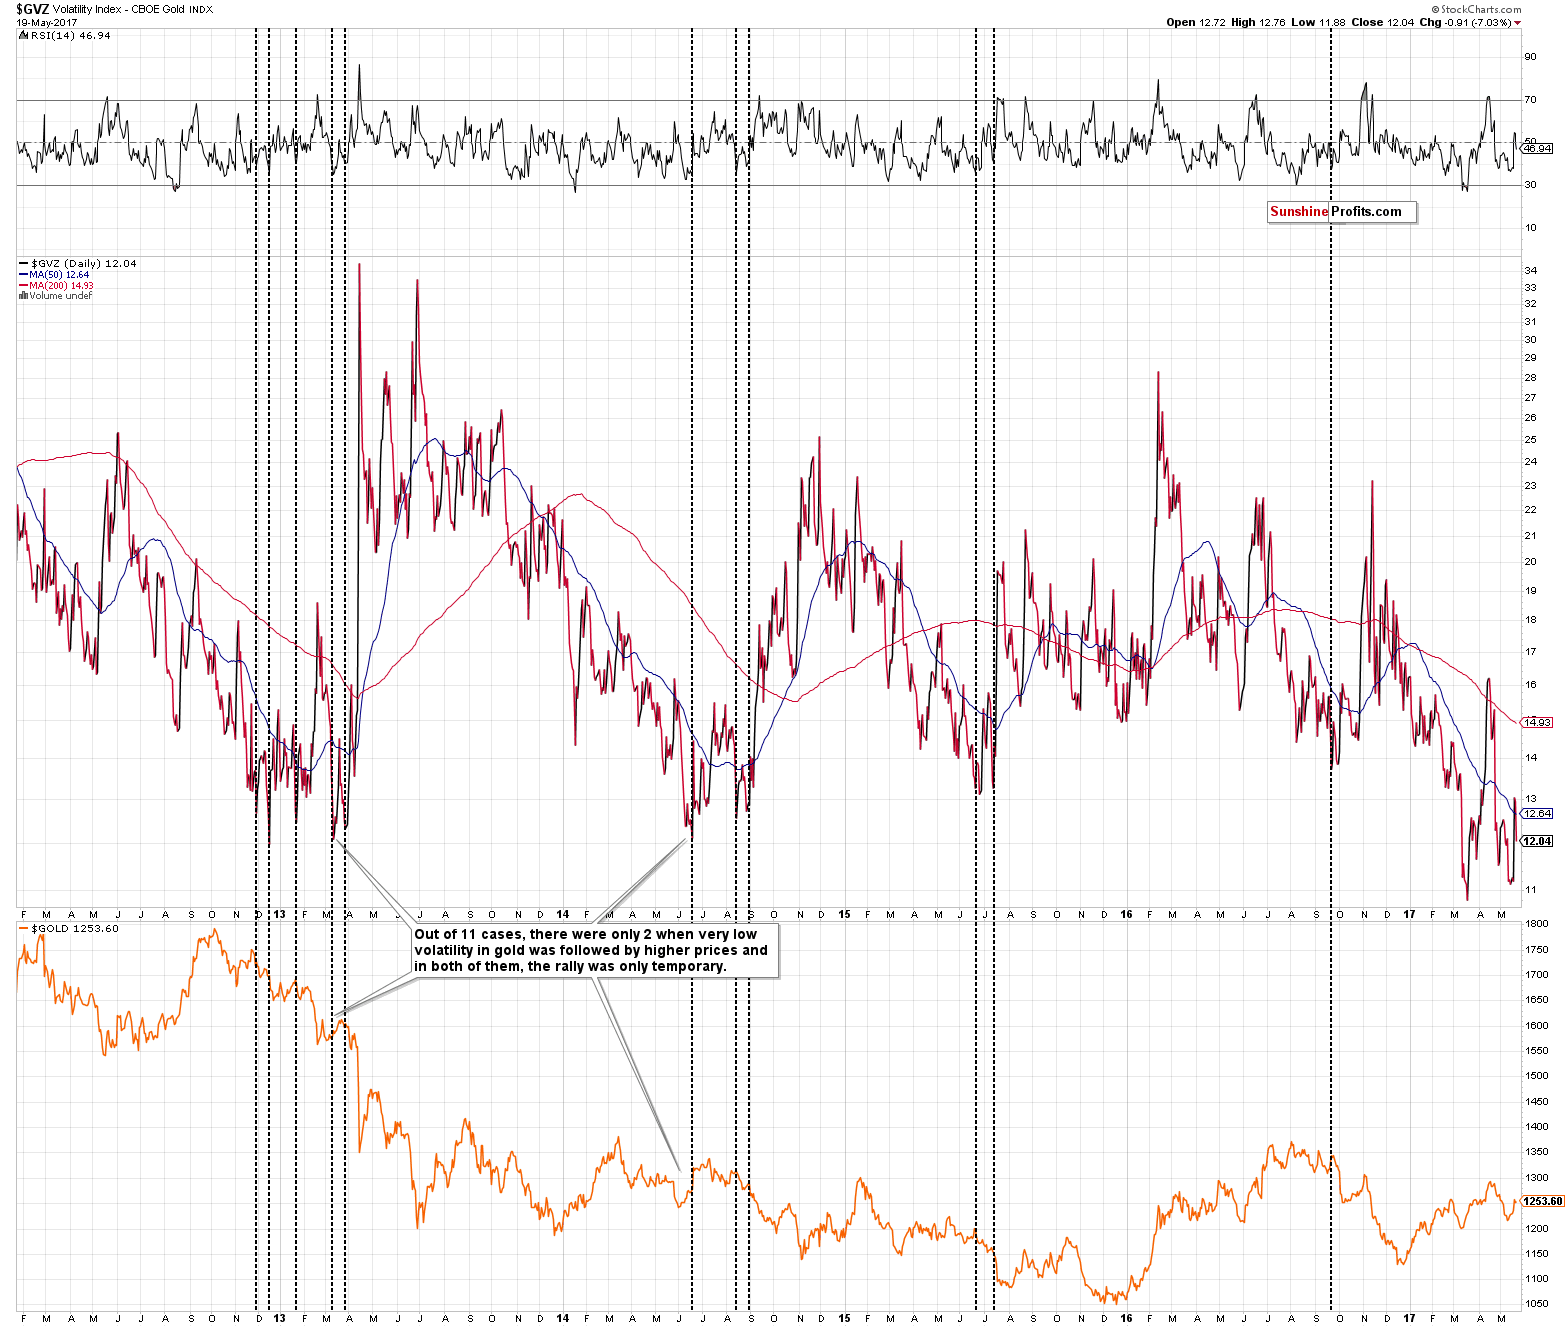
Since the bull market in gold started over 15 years ago, we haven’t seen such a long consolidation pattern – ever. Even the big 2008 plunge was followed by a rally almost immediately (from the long-term point of view, that is). The gold volatility index confirms the above having recently moved to new all-time lows (it’s been published for only several years, but still, that’s an important observation). Please take a look below for details (chart courtesy of http://stockcharts.com).
Click Chart for Larger Image
Now, what does the above (lack of) volatility mean? That the gold market is less and less appealing to traders and investors – at least to those, who don’t believe in the gold market’s strong long-term fundamentals. It’s less exciting and some might even describe it as boring.
But, is this really the time when one should take it easy, stop checking what’s going on in the gold market and wait for gold’s rally? If one wants to miss the event that will likely be called the mother of all buying opportunities, then this is the way to go. Something tells us that you don’t really want to miss something like that.
The biggest mistake that people make in a street fight is that they don’t realize that they are in a fight. Paraphrasing the above and applying it to investments: the biggest mistake that investors make is that they don’t realize that the best time to buy is when nobody wants to and when a given asset is widely hated. It’s ironic that the same reason for which people don’t want to buy a given asset is the same reason that creates the great buying opportunity, but still, this is the case.
By the way, this phrase has its own trading indicator – the Bollinger Bands – when the bands narrow, it suggests that a big move is just around the corner. The space between the bands depends on the volatility. So, low volatility (the calm) suggest a looming big move (the storm).
We don’t want to discuss why the final bottom in the precious metals sector is still ahead of us or to make a specific gold price prediction, as that’s not the point of this article and because that’s something that we discussed many times in our previous articles (however, the fact that gold was not widely hated when it moved below $1,100 in 2015 is one of the things that point to the above conclusion).
Gold’s Not Doing Much – Why Bother?
The purpose of this essay (the first one in the “Preparing for the Bottom” series) is to emphasize the need to stay alert when times are not turbulent, but boring. The calm before the storm is exactly how we can view the current “boring stage” of the long-term bull market in precious metals. This is precisely what happens before extremely profitable buying opportunities and it seems that now is exactly the wrong time to give up on this market. Instead, it’s the time to prepare for the punch that the precious metals market is likely to give all investors in the coming months and make sure that one has a plan to use it profitably instead of being hurt by it. Naturally, it all comes down to preparing NOW, before the volatility kicks in as it will be difficult to keep one’s head cool in that environment without being prepared in advance.
In the following articles, we will discuss the planning process and preparations in greater detail, but for now, the bottom line is this: be sure to stay alert and focused on the precious metals market even though it may not appear all that interesting at this time and prepare for the big moves that are likely to be seen later this year. This time investment should prove extremely worth your while.
Thank you.
Przemyslaw Radomski, CFA
Founder, Editor-in-chief, Gold & Silver Fund Manager
* * * * *
All essays, research and information found above represent analyses and opinions of Przemyslaw Radomski, CFA and Sunshine Profits’ associates only. As such, it may prove wrong and be a subject to change without notice. Opinions and analyses were based on data available to authors of respective essays at the time of writing. Although the information provided above is based on careful research and sources that are believed to be accurate, Przemyslaw Radomski, CFA and his associates do not guarantee the accuracy or thoroughness of the data or information reported. The opinions published above are neither an offer nor a recommendation to purchase or sell any securities. Mr. Radomski is not a Registered Securities Advisor. By reading Przemyslaw Radomski’s, CFA reports you fully agree that he will not be held responsible or liable for any decisions you make regarding any information provided in these reports. Investing, trading and speculation in any financial markets may involve high risk of loss. Przemyslaw Radomski, CFA, Sunshine Profits’ employees and affiliates as well as members of their families may have a short or long position in any securities, including those mentioned in any of the reports or essays, and may make additional purchases and/or sales of those securities without notice.
 On the heels of a wild week of trading in Bitcoin, what is happening in gold and the mining shares is going largely unnoticed but it is an all-time record and truly stunning.
From Jason Goepfert at SentimenTrader: Money keeps leaving the gold miners. Structural trouble in gold mining ETFs got a lot of media attention a couple of weeks ago, and investors have taken notice. The main gold mining ETFs have lost $5 billion in assets in less than 30 days…
…related:
Something Changed in the Silver Market in May: Here Are 3 Reasons Why

-
I know Mike is a very solid investor and respect his opinions very much. So if he says pay attention to this or that - I will.
~ Dale G.
-
I've started managing my own investments so view Michael's site as a one-stop shop from which to get information and perspectives.
~ Dave E.
-
Michael offers easy reading, honest, common sense information that anyone can use in a practical manner.
~ der_al.
-
A sane voice in a scrambled investment world.
~ Ed R.
Inside Edge Pro Contributors

Greg Weldon

Josef Schachter

Tyler Bollhorn

Ryan Irvine

Paul Beattie

Martin Straith

Patrick Ceresna

Mark Leibovit

James Thorne

Victor Adair