
Gold & Precious Metals
Something changed in the silver market in May as U.S. Silver Eagle sales have surged compared to the previous month. This is quite interesting as precious metals sales and sentiment have declined in the West, especially in the United States, ever since Donald Trump was elected President.
Many precious metals investors thought that if Trump was elected, it would have been very positive for the gold and silver market. Unfortunately, it seems as if the opposite was (is) the case. Not only has demand for precious metals declined considerably in 2017 versus last year, so has sales of guns, ammo and survival food-supplies. I gather many of those who follow the alternative media believe Trump is actually going to make America Great Again. So, why protect oneself from a collapse?
This is a very bad assumption… as nothing has changed with Trump in the White House. Furthermore, many analysts are saying that what Trump is doing could actually speed up the collapse of the U.S. economy and financial system.
Regardless, the fundamentals in the U.S. economy continue to disintegrate. We are seeing economic bubble indicators reach or surpass what took place in 2007, before the bloodbath hit the U.S. Housing and Financial Markets. However, there is one additional negative factor that wasn’t a problem in 2007 that is now a BLINKING RED LIGHT.
What is this new lousy fundamental? It’s the U.S. and Global Oil Industry. Back in 2007, most of the oil and gas companies were making decent cash flow and profits. Unfortunately, the situation in the Oil Sector is orders of magnitude much worse than what is was in 2007. Not only are the majority of oil and gas companies losing money, they have been also cutting their oil reserves.
This is extremely bad news for which very few Americans are aware. Thus, we are now facing an extremely negative DOUBLE-EDGE SWORD of bubble economic indicators on top of a disintegrating oil industry. Which means… the situation today is much worse than what took place back during the 2008 Global meltdown.
U.S. Silver Eagle Sales Surge In May Due To 3 Reasons
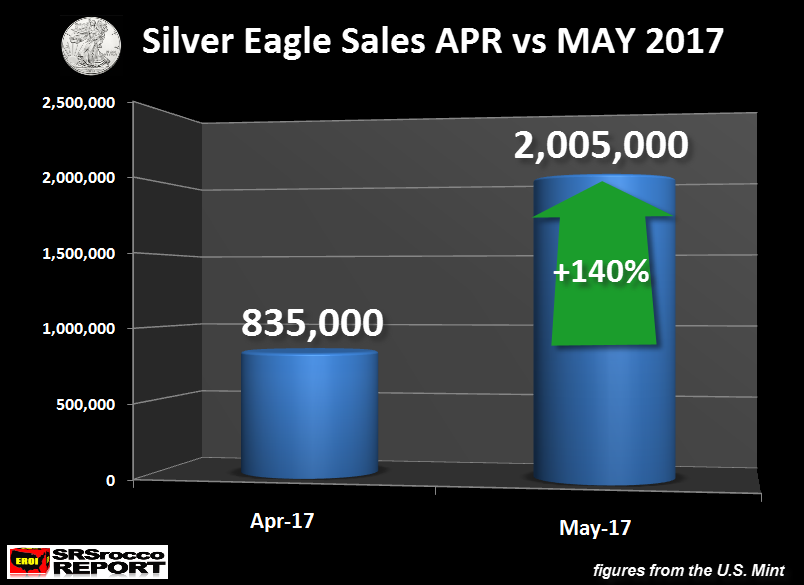
U.S. Silver Eagle sales surged 140% in May versus April… and we still have another week remaining in the month. According to the recent update by the U.S. Mint, Silver Eagle sales reached 2,005,000 so far in May compared to 835,000 in April:
After seeing this spike in Silver Eagle demand, I called up a few of my contacts in the industry and asked if they could shed some light as to why sales jumped in May. According to several sources, they stated that the huge increase in Silver Eagle sales were due to three reasons:
- There was an extremely large purchase by a single wholesaler in the Northeast.
- The small retail buyer came in a big way as premiums were lowered the most in seven years
- A group of respected technical analysts gave a buy signal for the Silver Market when silver was trading between $16-$16.25
These three reasons stated by my contacts, are what has likely driven demand for Silver Eagles to the highest level seen so far this year… if we exclude sales in January, which are always elevated as wholesalers are stocking up on the debut of the new coin release.
It seems as if a large buyer in the Northeast believes silver is a good deal at this price. Furthermore, when the wholesalers lowered the premiums (lowest in seven years), there was an immediate surge in Silver Eagle buying via small retail investors which caused the premium to increase once again. Also, the silver market underestimates the reaction when certain Technical Analysts put out a BUY SIGNAL. Many individuals who follow or subscribe to these analysts, are big investors. So, when they see a buy signal… they do so in a BIG WAY.
That being said, I would like to remind those reading this article (that might be new to the precious metals industry) please make sure you understand the difference between “PREMIUM” and “COMMISSION” when you decide to purchase precious metals. There are a group of very widely advertised precious metals dealers that may have lowered their premium along with the other dealers, but still charge very high commissions for their products or services.
IMPORTANT NOTE: The PREMIUM is what the dealer pays the wholesaler for the coin or bar. The COMMISSION is what the dealer charges his client above the premium. You need to ask what the commission you are being charged as many new investors are being taken advantage of… but don’t realize it until later, when it is too late.
While two million Silver Eagle sales so far in May are less than they were last year (4,498,500), this surge in demand suggests that the hype surrounding a Trump Presidency may be fading… and quickly. If we take a look at Silver Eagle sales from FEB to MAY, we can clearly see that something has changed recently:

If the strong demand trend continues for the remainder of May, we could see Silver Eagle Sales reach 2.5-2.8 million. Again, this is lower than what it was last year, but it is a sign that market is starting to SMELL A RAT. And that RAT is a totally inflated STOCK, BOND & REAL ESTATE MARKET.
In addition, Silver Eagle sales are now out-performing Gold Eagle sales. For example, in March when U.S. Silver Eagle sales were 1,615,000, Gold Eagle sales were 56,000 oz. However, Gold Eagle sales in May are only 42,000 oz, while Silver Eagle sales are over 2 million. Thus, the market is purchasing 48 times more Silver Eagles than Gold Eagles currently.
Lastly, for those precious metals investors who are frustrated by the disappointing paper Gold and Silver price performance since 2012, the STOCK, BOND and REAL ESTATE markets have never been in such BUBBLE TERRITORY. For some odd reason, many precious metals investors tend to overlook the $7 trillion in Central Bank assets purchases (that were made public… could be much higher) from 2011-2016, and the whopping $1 trillion purchased in just the first four months of 2017.
It seems as if many Americans are suffering from BRAIN DAMAGE as the MainStream Media continues to put out the most misinformation and propaganda in history. This causes individuals to lose the ability to think CRITICALLY. And with that will come a great deal of pain and misfortune when we finally see the collapse value of most STOCK, BOND and REAL ESTATE prices.
Check back for new articles and updates at the SRSrocco Report.


Last Friday’s CoT for the Comex Metals was rather interesting from a historical perspective. Because of this…and because we know that not everyone listened to Friday’s podcast…it seemed appropriate to type up this written summary today.
Before we begin, it is VERY important to note the restrictions that have been deliberately placed on this info by the CFTC. Even though the Commitment of Traders reports are surveyed at the Comex close each Tuesday, the CFTC purposefully waits 74 hours before releasing the data to the general public. As you consider the degree to which the “regulators” at the CFTC are complicit in the ongoing price management and manipulation, ask yourself why it takes a handful of dedicated public servants 3 days to crank out these spreadsheets: http://www.cftc.gov/dea/futures/other_lf.htm
Also, we are going to assume that this data is accurate. There have been occasions in the past where the CFTC has put out some numbers that seemed odd and inconsistent to those of us who follow the reports weekly….only to have the CFTC come back the following week and correct their “mistakes”.
And lastly, never assume that this data is sacrosanct and honestly reported by The Banks. Over just the past three years, JPMorgan has been fined on several occasions for knowingly submitting false data:
- https://www.bloomberg.com/news/articles/2016-03-23/jpmorgan-fined-by-cftc-for-failure-to-submit-accurate-reports
- http://www.cftc.gov/PressRoom/PressReleases/pr6968-14
OK, now that we have that behind us, let’s take a look at last Friday’s report and point out a few of the important points.
Let’s start with Comex Digital Gold (or as we call it here, “CDG”). As you assess where price may go from here, please consider the following:
- Over the past three reporting weeks, price has fallen by $35 or nearly 3%.
- During this time period, the Large Speculators in CDG have reduced their NET long position by over 71,000 contracts or about 37%.
- As of last Tuesday, when this latest CoT was surveyed, the Large Spec NET long position was just 126,724 contracts and the Commercial NET short position was just 142,859 contracts. These are the lowest NET positions since the CoT survey of February 21, 2017.
- At 142,859 contracts NET short, the Commercial NET short position has been trimmed by more than 1/3 in just the past three weeks.
- Perhaps most importantly from a historical perspective, at the recent price highs of July 5, 2016, the NET long position of the Large Specs was 316,037 contracts and the NET short position of the Commercials was 340,207. Ask yourself how high might price rise if these 200,000 Spec longs return to the Comex over the next few months?
Finally, for CDG, consider this chart:

Now let’s turn our attention to Comex Digital Silver or “CDS” for it’s here that the changes are rather eye-opening. Let’s lay some of them out as we did above for CDG:
- Over the past five weeks, price has fallen by $1.58 or about 8.6%.
- During this same time period, the Large Specs have reduced their NET long position by over 62,000 contracts or about 59%.
- As of last Tuesday, the Large Spec NET long position was just 43,004 contracts and the Commercial NET short position was just 57,337 contracts. These are the lowest NET positions since February 2, 2016.
- At 57,337 contracts, the NET short position of the Commercials has been cut almost exactly in half over the past five weeks from an alltime high total of 114,4141 contracts on April 11.
As you can see, just as in Comex Digital Gold, the recent CoT changes in Comex Digital Silver are significant. But, there are a few more remarkable datapoints you need to know. Again, these are from the report surveyed last Tuesday and released late last Friday:
- Here at TFMR, we like to look at what we call “The Large Spec Net Long Ratio” when we consider the “bullishness” or “bearishness” of the survey. All we do is take the summary positions from the silver report and divide Spec longs by Spec shorts. The lowest ratio we’ve ever recorded came from the CoT surveyed July 21, 2015. On that report, the Large Specs in silver were long 66,576 contracts and short 62,331. This produced a ratio of just 1.07:1.
- On February 28, 2017, we observed the highest ratio we’ve ever seen at 6.04:1. This ratio was still 4.99:1 five weeks ago with the CoT surveyed April 11. As of last Tuesday, the ratio is all the way down to just 1.75:1 and this is the lowest Large Spec Net Long Ratio we’ve seen since January 19, 2016.
- At 112,949 contracts, the GROSS short position of the silver Commercials is the smallest since the CoT of April 5, 2016.
- The GROSS short position of the Large Specs stood last week at 57,138 contracts, up from 26,454 contracts five weeks ago. But that’s not the interesting part. Consider this: At 57,138 contracts, this is the largest Large Spec GROSS short position in silver since the CoT Survey of August 4, 2015.
As in CDG, let’s put this data onto charts. See below:


In the end, what does all this mean?
Well, I suppose you could make the case that these most recent selloffs have washed out any “excess Speculator bullishness” that might have been present a few weeks ago. The CoT could also imply that upside potential now outweighs downside risk. However, for the reasons listed back at the beginning of this post, no one should ever make a trading or physical purchase decision based upon CoT info alone.
That said, given the similarities the current CoT structure has to the CoTs of late 2015 and early 2016, it seems safe to conclude that the prices of CDG and CDS are very close to…or have made…new bottoms. History suggests that the turnaround may not be immediate but the next price move from these lows could once again be substantial.
TF
The precious metals complex rebounded as expected after becoming very oversold just a few weeks ago. The rebound has been aided by weakness in the US Dollar, which plunged roughly 2% over several days. However, upon further inspection Gold’s rebound has been entirely dollar-centric. Gold has remained weak in real terms and strength in the gold stocks and Silver has been rather muted. In short, the lack of much stronger performance in the face of US Dollar weakness bodes for increasing downside risk over the near term.
Gold’s recent strength has been driven entirely by Euro strength and not due to falling real interest rates, its primary fundamental driver. Macron’s win in France coupled with recent strength in European markets has supported what was an oversold and depressed Euro. This has supported Gold in US Dollar terms but only in those terms. As the chart below shows, Gold has been weak when measured against foreign currencies and equities.
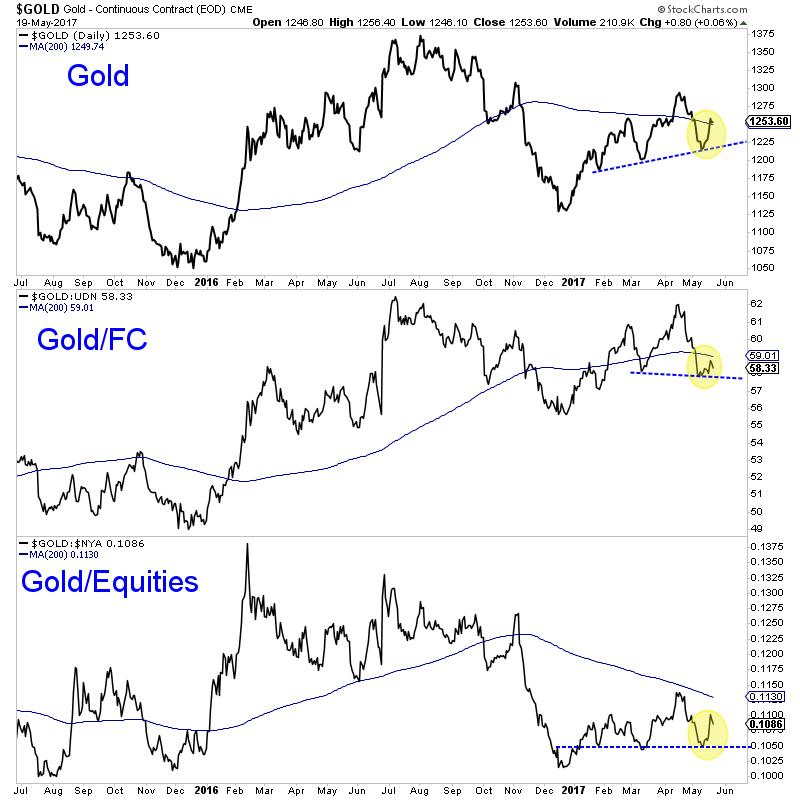
The above chart shows that Gold remains well below its spring high near $1300 despite the US Dollar breaking its spring lows to the downside. In addition, Gold remains rather weak relative to foreign currencies and equities. The one hope for Gold would be a falling stock market and sustained strength in the Gold/equities ratio. While I expect that eventually, I do not think it is in the cards yet.
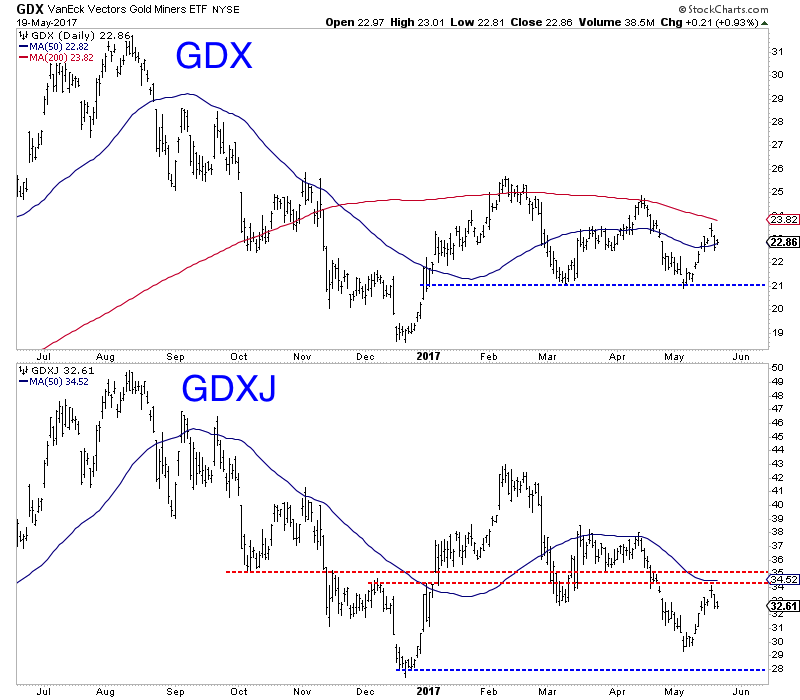
Turning to the gold mining stocks, we see immediate downside risk as the miners appear to have completed their oversold bounce.
Over the past few weeks GDX and GDXJ rallied 13% and 17% respectively and retraced a good chunk of their April decline. However, they now appear ready to decline into June and the upcoming Fed meeting. For the first time in months, GDX was unable to touch its 200-day moving average, which is already sloping down. Support for GDX is at $21 and $18-$19. Meanwhile, GDXJ peaked at its 50-day moving average and strong resistance at $34-$35. Its next strong support level is the December 2016 low.
If precious metals were about to blast off due to US Dollar weakness it would have already happened or precious metals would at least be showing much more strength. The greenback fell to a 6-month low yet the entire complex (ex Gold) is nowhere close to 6-month highs and remains well below 200-day moving averages. (Gold is trading right around its 200-dma). This is a warning sign as the sector could be quite vulnerable to a rebound in the US Dollar. We continue to wait as we expect lower prices and a good buying opportunity in select juniors at somepoint this summer.
Jordan Roy-Byrne CMT, MFTA
Learn more about our premium service including our current favorite junior exploration companies.

-
I know Mike is a very solid investor and respect his opinions very much. So if he says pay attention to this or that - I will.
~ Dale G.
-
I've started managing my own investments so view Michael's site as a one-stop shop from which to get information and perspectives.
~ Dave E.
-
Michael offers easy reading, honest, common sense information that anyone can use in a practical manner.
~ der_al.
-
A sane voice in a scrambled investment world.
~ Ed R.
Inside Edge Pro Contributors

Greg Weldon

Josef Schachter

Tyler Bollhorn

Ryan Irvine

Paul Beattie

Martin Straith

Patrick Ceresna

Mark Leibovit

James Thorne

Victor Adair