
Gold & Precious Metals
There is a pattern forming on gold which wasn’t there yesterday. With yesterday’s big move up and no follow through to the upside today there is a potential H&S top building out. Many times I will use a neckline symmetry line which is taken from the neckline and moved up to the top of the left shoulder to show the possible high for the right shoulder. There is another technique I use where I will use a horizontal line from the top of the left shoulder that can sometimes show the height for the right shoulder. Today’s high at 1265 matches the high for the left shoulder. I’ve been showing the possible neckline as a S&R line, but now after yesterday’s move it’s looking more like a possible neckline. The breakout will come into play around the 1220 area which will confirm the H&S top.
Click twice on chart for largest version
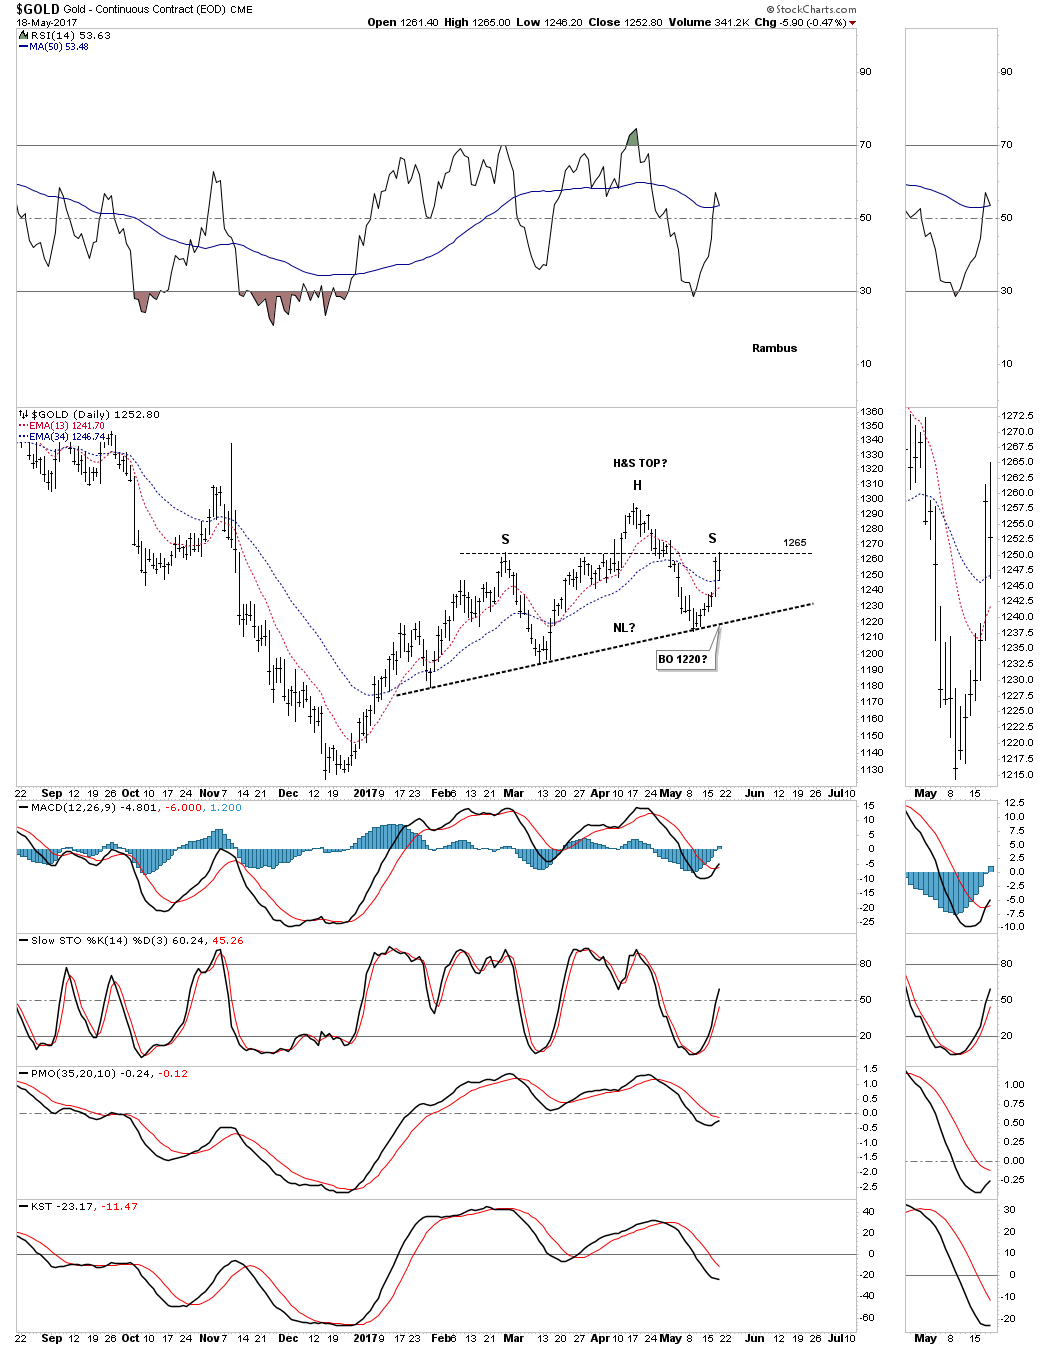
There is another technique I’ve shown you in the past that has to do with a wedge pattern. I’ve been showing you that gold has broken out of a bearish rising wedge with a breakout gap and a backtest today to the underside of the bottom rail. This technique I use shows how the left shoulder and head form inside the wedge and the backtest to the underside of the rising wedge forms the right shoulder. It ‘s still very early yet, but these two techniques show a strong possibility that gold may well be forming a H&S top.

Below is the PM combo chart which is showing yesterdays move may have been a strong backtest to the bottom rail of the triangle consolidation patterns as today’s price action closed below the bottom trendline. There were also several apex backtests which held resistance. Click twice on chart for largest version
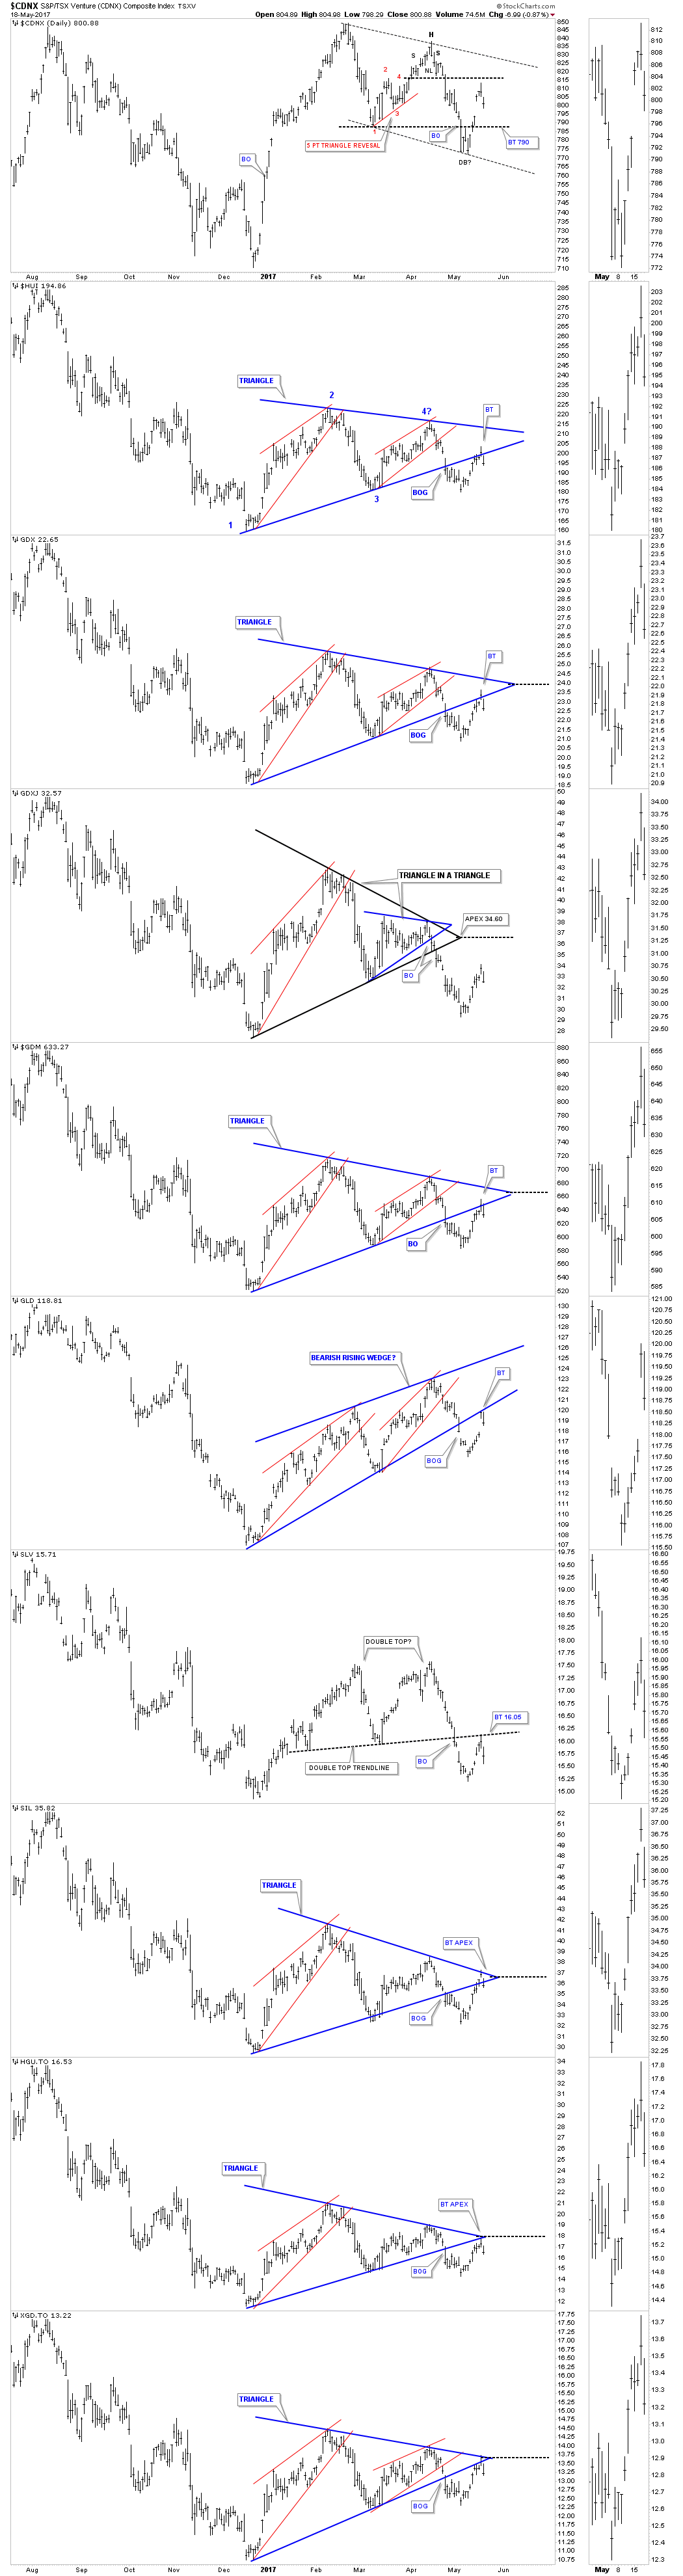
Yesterday I speculated on whether the gap opening was an exhaustion gap or a breakaway gap. With the price action trading back below the bottom rail of the triangle consolidation patterns it looks like we may have seen an exhaustion gap.
Based on that the possible exhaustion gap in play I’m going to jump back in and take an initial small position in the Kamikaze stocks. For most investors that’s almost an impossible thing to do, sell out one day and buy back in the next. Yesterday was called, shaking the bush day, to get the shorts to cover with what now looks like a strong backtest in place. Again this trade is not for everyone as the volatility is extreme in both directions. Only risk capital is used trading the Kamikaze stocks JNUG JDST DSLV and DGLD.
….also from Rambus:

Silver prices are rising along the bottom of a 20 year log scale trend channel (shown later). There are no guarantees in a manipulated paper market, such as COMEX silver, but it is possible that silver prices will collapse further, or more likely, move substantially higher, sooner rather than later.Silver prices COULDfall from their current level of $16 – $17 to under $10. Other events that COULD occur include:
You could win the Powerball Lottery.
The U.S. congress could balance the budget and reduce debt.
The Federal Reserve could apologize for destroying the dollar.
President Putin and Hillary could sing “Kumbaya” together.
The Middle-East could ascend into a century of peace.
And it is possible that silver prices could drop under $10.
But realistically, we know:
- The Federal Reserve has devalued the dollar for over a century and is openly advocating for at least 2% inflation – more devaluation. Expect continuing declines in the purchasing power of the dollar.
- The U.S. congress, the President, the military, thousands of military contractors, the medical/health/sick care system, and millions of people collecting Social Security do NOT want spending decreased. Expect more spending, deficits, ever-increasing debt, and of course, more consumer price inflation. Silver prices will rise.
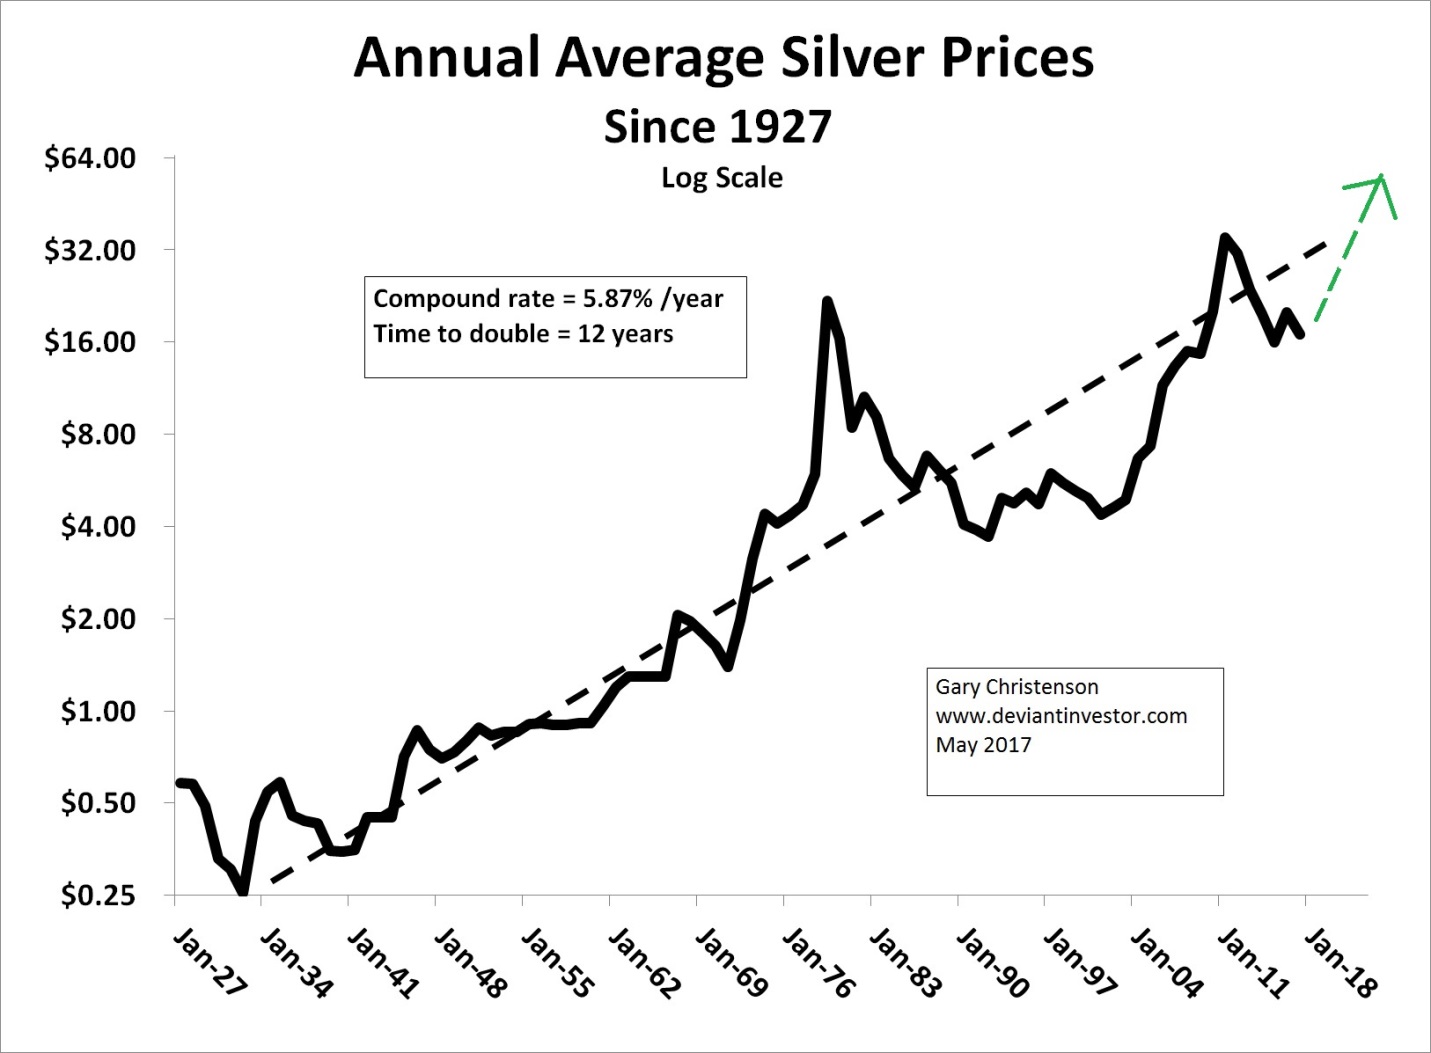
- Silver prices have risen exponentially for the past 90 years as the dollar has been consistently devalued. Expect continued silver price rises. See log scale graph below.
SILVER TO GOLD RATIO:
Examine the silver to gold ratio for the past 27 years. Low silver to gold ratios indicate long-term buy zones for silver. Silver prices are there now.

How High Will Silver Prices Rise?
The answer depends upon many variables. A partial list includes:
- COMEX silver prices are “managed” by large players, including JPM, which previously have wanted silver prices to remain low. That may be changing. Read Ted Butler.
- How rapidly will the Fed and commercial banking increase the supply of dollars and how much will they devalue the dollar?
- How extreme will our political circus become? Distractions will be necessary. The usual response is war after a suitable scapegoat has been identified.
- “False Flag” operations may direct blame and attention away from policy failures and toward some “common enemy.” Wars increase silver prices.
- When will U.S. citizens lose confidence in the dollar?
- How rapidly will foreign countries including China, Russia and Saudi Arabia redirect commerce away from the dollar?
- Hyper-inflation or 1970s style inflation?
- Rise of the IMF and Special Drawing Rights as a global currency?
SUMMARY:
Silver prices for the next decade are dependent upon many unknowns. However, a conservative chart interpretation is shown below.

The log trend channel has contained most silver prices for the past 20 years. A “more of the same” financial world suggests silver prices will rise toward $100 in the next 5 – 7 years.
A more aggressive chart interpretation shows prices for silver peaks rising rapidly during the past 17 years.

A blow-off rally in silver – quite possible – suggests silver prices rallying toward $200 – $300 per ounce. For comparison, Bitcoin was $3 a few years ago and recently exceeded $1,700. Amazon stock sold for about a buck 20 years ago. Today it is near $1,000. Silver near $200 is not impossible in a few years.
CONCLUSIONS:
- Silver prices have risen exponentially for 90 years as the dollar has been devalued. Expect further devaluation and higher silver prices.
- There are many financial and political catalysts that could propel silver prices well over $100.
- A conservative graphical interpretation shows $100 silver within a few years.
- A “blow-off” graphical interpretation shows $200 – $300 silver is possible in a few years.
- If the powers-that-be create or can’t stop hyper-inflation of the dollar, $500 silver will look inexpensive by the end of next decade.
- It is difficult to look beyond our “normalcy bias” and consider the possibility that the DOW could drop more than 50%, like it did in the 2008 crisis, or silver could increase in price by over a factor of 30, like it did from 1971 – 1980.
Read Steve St. Angelo: Amazing Leverage in Silver Market.
Read “Silver and Gold Find Support.”
The “silver train” has not left the station … yet.
Gary Christenson
The Deviant Investor
Here at the outset, I want to share with you an interesting observation we made last week of gold’s seasonal trading pattern. As you can see in the chart below, based on data provided by Moore Research Center, the five-year pattern, represented by the orange line, is diverging from the longer-term trends. Note that the index on the left measures the greatest tendency for the asset to make a seasonal high (100) or low (0) at a given time.
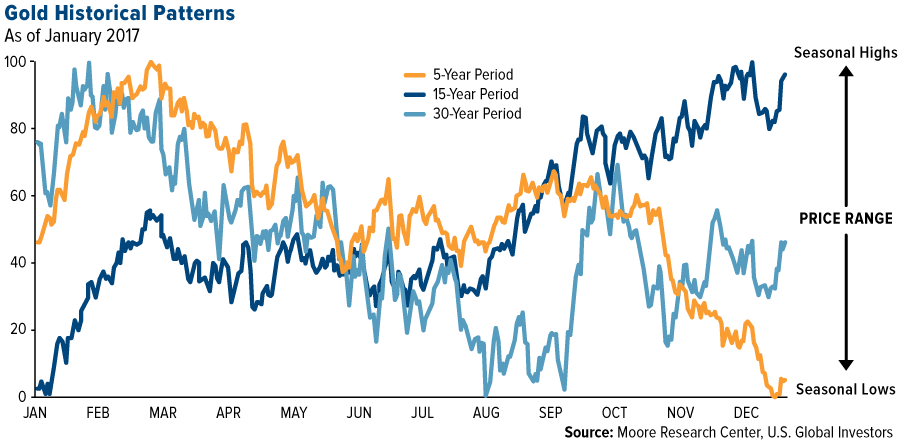
The data show that lows are now reached late in the year, not in January (according to the 15-year period, represented by the dark blue line) or August (according to the 30-year pattern, represented by the light blue line). Historically, September has seen the highest returns on gold as Indians make huge purchases in preparation for Diwali and the fourth-quarter wedding season, but lately we’ve seen changes. When we calculate the average monthly returns of the past five years, from January 2012 to December 2016, we find that January is the strongest month, returning 5.3 percent, following by August with 2.3 percent. September actually returns negative 1.3 percent.
There could be a number of reasons why this is, but it’s important to recognize that the five-year period captures the bear market that dragged gold from its high of $1,900 an ounce in August 2011 to a recent low of $1,050 in December 2015. The years 2013, 2014 and 2015 all saw negative returns, so it’s little wonder why the orange line trends down from February-March to December.
Inflation Props Up Gold
Consumer and producer prices rose in April compared to the same time last year, favoring gold prices going forward. Consumer goods climbed 2.2 percent, down slightly from March’s 2.4 percent. Wholesale goods, meanwhile, flew up 5.3 percent, higher than economists’ expectations and the strongest year-over-year increase in nearly six years.
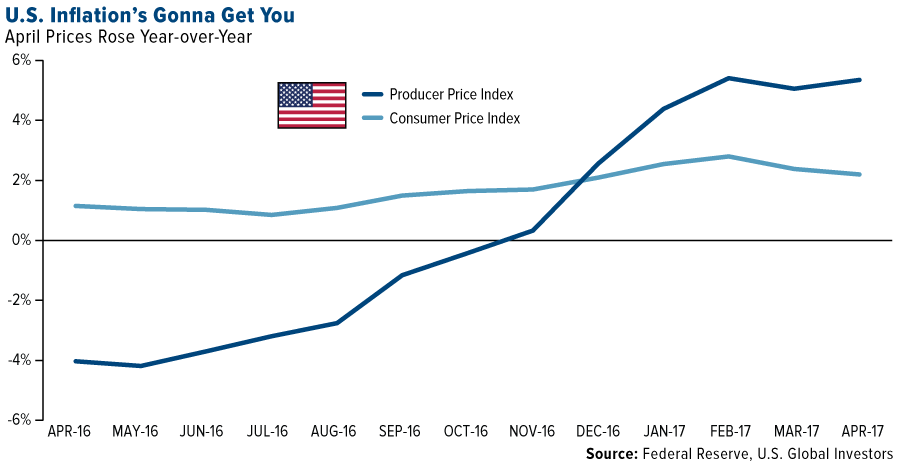
On numerous occasions I’ve shown that higher inflation supports demand for gold, which has often been seen as a safe haven investment. The money you have sitting in the bank right now is guaranteed to lose value over time. The five-year Treasury bond is currently yielding a negative return. Diversiying a part of your portfolio into gold and gold stocks could help mitigate the effects of inflation on your household wealth. I’ve always recommended a 10 percent weighting with annual rebalances.
Chindia Demand Was Strong in the First Quarter
In India, no one questions this. Aside from property, gold is seen as the most reliable store of value, which is why it’s routinely given as a gift during weddings, graduations, births and other important life events.
Indians’ demand for gold jewelry jumped 16 percent year-over-year in the first quarter, according to the World Gold Council (WGC), as the country slowly recovers from the economic shock of Prime Minister Narendra Modi’s demonetization scheme in November.
Demand in China for gold bars and coins had an unusually strong start to the year, fueled by concerns over a weakening renminbi and uncertainty over the country’s real estate market. The first quarter has historically been a good time for Chinese demand, as that’s when the Lunar New Year falls. This year, though, demand was up an amazing 30 percent, with 105.9 metric tons (tonnes) purchased during the three-month period. According to the WGC, this was the fourth-strongest quarter on record.

Looking ahead, gold prices could be supported by steadily declining mine production. Over the next five to 10 years, output from currently-operational mines is expected to drop off steeply as a consequence of deep spending cuts for project development as well as a lack of significant new deposit discoveries.
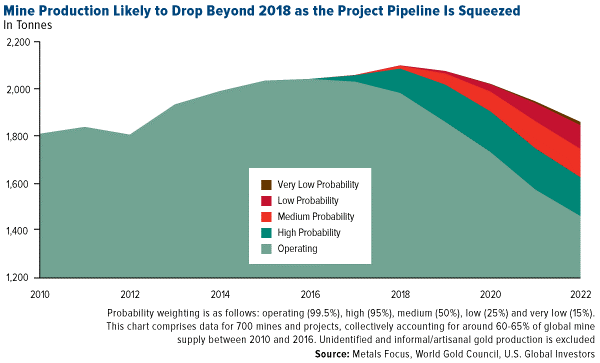
Between 2012 and 2016, capital expenditure for companies in the NYSE Arca Gold BUGS Index contracted 65 percent, the WGC reports. This will inevitably squeeze the supply chain and help prices firm up.
Stock Investors Have No Fear
In the near term, gold faces a number of headwinds, including a strong U.S. dollar, rising nominal interest rates and a still-robust stock market. Despite recent geopolitical shockwaves such as President Donald Trump’s surprise firing of FBI director James Comey, investors still see stocks as a good place to be, with the CBOE Volatility Index, or VIX, trading at lows last seen in 1993.

Popularly known as the “fear gauge,” the VIX measures expected volatility in the S&P 500 Index over the next month. That it’s trading so low suggests that geopolitical uncertainty doesn’t always translate into investor uncertainty. Evidently Wall Street doesn’t share the same sense of impending doom as some voters and media figures appear to have right now concerning Comey’s termination and the ongoing investigation into possible collusion between the Trump campaign and the Russian government.
This matters because gold has historically benefited in times of crisis and uncertainty, whether real or perceived. But with the VIX signaling near-record-low fear in the marketplace, some investors might see this as weakening the case for gold.
Where We See the Gold Opportunities
In this environment, we seek high-quality producers that are profitable and show improvements in revenue and cash flow. This yields junior companies such as Klondex and Wesdome, both of which have demonstrated strong fundamentals, low SG&A (selling, general and administrative expenses), cost-conscientious management and higher-grade ore.
The recent bubble in gold stocks unwound, which was harmful to some quality gold names that were affected by the issues involving the VanEck Vectors Junior Gold Miners ETF (GDXJ), which I wrote about last week. Since the GDXJ methodology update was announced, the ETF has recorded large redemptions, with assets plunging as much as 25 percent.
The GDXJ doesn’t have any smart beta attributes—instead, it relies on market cap. As portfolio manager Ralph Aldis put it, this means “we find a lot of high-quality companies being indiscriminately sold down.” We see this as an opportunity to nibble at some attractive small-cap growth names.

All opinions expressed and data provided are subject to change without notice. Some of these opinions may not be appropriate to every investor. By clicking the link(s) above, you will be directed to a third-party website(s). U.S. Global Investors does not endorse all information supplied by this/these website(s) and is not responsible for its/their content.
The Consumer Price Index (CPI) is one of the most widely recognized price measures for tracking the price of a market basket of goods and services purchased by individuals. The weights of components are based on consumer spending patterns. The Producer Price Index (PPI) measures prices received by producers at the first commercial sale. The index measures goods at three stages of production: finished, intermediate and crude.
The NYSE Arca Gold BUGS (Basket of Unhedged Gold Stocks) Index (HUI) is a modified equal dollar weighted index of companies involved in gold mining. The HUI Index was designed to provide significant exposure to near term movements in gold prices by including companies that do not hedge their gold production beyond 1.5 years.
Chicago Board Options Exchange (CBOE) Volatility Index (VIX) shows the market’s expectation of 30-day volatility.
The S&P 500 Stock Index is a widely recognized capitalization-weighted index of 500 common stock prices in U.S. companies.
Beta is a measure of the volatility, or systematic risk, of a security or a portfolio in comparison to the market as a whole.
Holdings may change daily. Holdings are reported as of the most recent quarter-end. The following securities mentioned in the article were held by one or more accounts managed by U.S. Global Investors as of 3/31/2017: Klondex Mines Ltd., Wesdome Gold Mines Ltd., VanEck Vectors Junior Gold Miners ETF.
U.S. Global Investors, Inc. is an investment adviser registered with the Securities and Exchange Commission (“SEC”). This does not mean that we are sponsored, recommended, or approved by the SEC, or that our abilities or qualifications in any respect have been passed upon by the SEC or any officer of the SEC.
This commentary should not be considered a solicitation or offering of any investment product.
Certain materials in this commentary may contain dated information. The information provided was current at the time of publication.

According to the most recently released data from Chile’s Ministry of Mining, the country’s silver production declined a stunning 26% in the first quarter of 2017. This is a big deal as Chile is the fourth largest silver producing country in the world. The majority of Chile’s silver production comes as a by-product of copper production.
Chile is the largest copper producer in the world, by a long shot. Last year, Chile produced 5.5 million tons of copper compared to Peru, who took a distant second place at 2.3 million tons.
Regardless, Chile’s silver production declined to 283.4 metric tons (mt) Q1 2017 versus 383.8 mt during the same quarter last year. Again, this is a huge 26% decline in the first three months of the year:
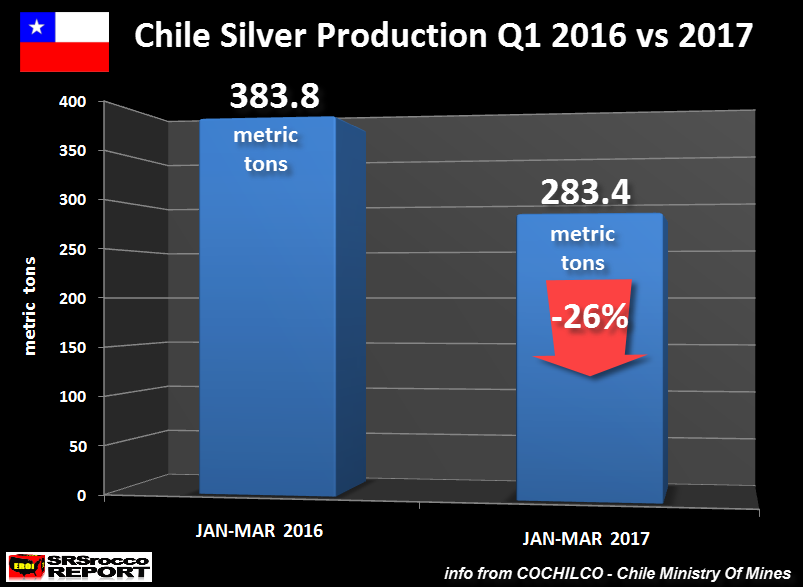
Chile’s silver production declined 101 mt (3.2 million oz) Q1 2017, due to a strike at the country’s largest copper mine, Escondida, as well as a drop off in copper production from many other producers.
For example, of the 20 copper producing mines (& companies) listed on the Chile’s Ministry of Mining Report, 12 of them stated lower copper production Q1 2017 compared to the same period last year. Thus, the strike at Escondida only accounted for a portion of the overall decrease in by-product silver production experienced across the entire industry.
The majority of the Chile’s silver production decline took place in March:

According to the COCHILCO’s data, silver production fell 16% in January, 29% in February, and 34% in March. In just the month of March, Chile’s silver production declined 45 mt. That is a huge drop off in just one month.
Even though Chile’s Ministry Of Mining forecasts that copper (and by-product silver) production will recover by the second half of the year, the world economy continues to stagnate under a massive amount of debt and derivatives. I believe we will see falling copper prices as overall demand for the king base metal continues to weaken during the latter part of 2017, and into 2018.
This will put a great deal of stress on many of Chile’s copper mining companies ability to make profits. So, we may soon experience PEAK GLOBAL COPPER PRODUCTION… once and for all.
For those individuals who want to make sure that I am not pulling these figures off the top of my head, here is the actual table of gold and silver production from Chile’s Ministry of Mining website:

Not only is Chilean silver production (plata) down 26% in the first three months of the year, gold mine supply (oro) is also down 22%. While a 22% decline in Chile’s gold production is substantial, the country only produced 43.3 mt (1.4 million oz) in 2016, compared to 1,496 mt (48.1 million oz) of silver.
Chile isn’t the only country suffering from falling silver production this year. As I stated in a previous article, Huge Decline In Peru’s Silver Production Suggests Future Production At Risk, Peru’s silver production declined 12% FEB 2017 versus the same month last year:

So, what were are witnessing here is that world’s top two copper producers are suffering large declines in their by-product silver production. This to me is a WARNING SIGN that the situation for by-product silver production will likely continue to deteriorate in the future as base metal prices trend lower as economic activity slows.
Clarification On Silver Supply & Demand Forces
There seems to be many precious metals investors (on my site and on other blogs) who believe that all these supply and demand figures are meaningless because the price of silver hasn’t really performed all that well since 2012. I agree. However, my focus on silver supply and demand forces is not to determine a SHORT TERM SILVER PRICE, rather I look at what is taking place over an ongoing trend.
For example, I have published articles on the huge increase in physical silver investment demand since the 2008 U.S. Housing and Banking Crisis. My focus was not to state that the silver price was going to be determined upon a single year’s worth of rising silver investment demand, rather it was to show that the world is waking up the SILVER STORY.
Furthermore, putting out articles on what it taking place as it pertains to world silver supply isn’t to forecast what the change will do to the price of silver in 2017, but rather how the declining trend will impact the price going forward.
So, for those who precious metals investors who continue to BELLY-ACHE that all these supply and demand figures don’t really change the silver current price that much, I KNOW THAT fer pete sakes… LOL. I am more concerned about the ongoing trend and what it going to happen over the mid to longer term.
Lastly the Silver Institute just released their 2017 World Silver Survey, and I have been looking over it. I will be publishing a few interesting articles on some of the data from the report as I believe they are a tell-tale sign that owning physical silver will benefit those immensely in the future.
Check back for new articles and updates at the SRSrocco Report.

-
I know Mike is a very solid investor and respect his opinions very much. So if he says pay attention to this or that - I will.
~ Dale G.
-
I've started managing my own investments so view Michael's site as a one-stop shop from which to get information and perspectives.
~ Dave E.
-
Michael offers easy reading, honest, common sense information that anyone can use in a practical manner.
~ der_al.
-
A sane voice in a scrambled investment world.
~ Ed R.
Inside Edge Pro Contributors

Greg Weldon

Josef Schachter

Tyler Bollhorn

Ryan Irvine

Paul Beattie

Martin Straith

Patrick Ceresna

Mark Leibovit

James Thorne

Victor Adair