
Gold & Precious Metals
“How to make a million? Start with $2 million – and invest in gold stocks!” – The Maxims of Wall Street (revised for gold bugs).
What is by far the most dangerous and high-risk sector of the market? Gold stocks!
Recently, I spoke at a gold bug convention, and after my talk, I was surrounded by several doctors, lawyers and other professionals who confessed that they had lost 70% of their portfolios.
“How is that possible?” I asked. “The stock market is at an all-time high!”
“We listened to the doom-and-gloom talks from speakers at this conference five years ago,” they admitted. “We sold out of the stock market and bought mining companies promoted here at this conference.”
It was a double whammy. As the Dow hit new highs, the penny mining stocks collapsed. It reminded me of an old financial book I have on my shelf, Wiped Out. How I Lost a Fortune in the Stock Market While the Averages Were Making New Highs. How? By investing in the wrong stocks!
I asked them why they were still at the same conference.
They answered, “We are doubling down.”
After that conversation, I decided to look into the mining sector. It turns out that penny mining stocks are a disaster over the long term. As investment banker Jeff Phillips once said, “Most penny stocks are like burning matches. If you hold them long enough, you get burned.”
But that’s not all. I also learned that major mining companies are big-time losers too. Since the year 2000, the price of gold itself has risen fourfold, but the miners themselves are extremely volatile and have gone nowhere over the past 17 years. Look at the long-term chart for Barrick Gold (NYSE: ABX), Newmont Mining (NYSE: NEM) and Goldcorp (NYSE: GG). They look terrible.
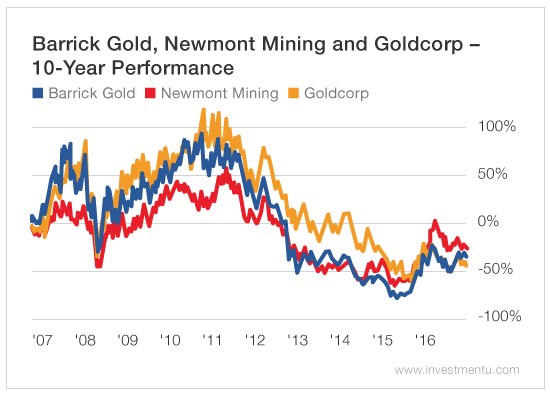
Sometimes they offer excellent short-term speculations, but if you keep them too long, you are bound to lose – just like playing craps or blackjack in Las Vegas.
I was the moderator of a financial panel at this conference and asked the experts, “Can you name a single large mining company that has made money for investors over the past 15 to 20 years?”
They couldn’t think of one. Moreover, none of them pay a sizable dividend like other more traditional, publicly traded companies like IBM, Microsoft, AT&T or Pfizer.
Adrian Day, an expert in mining companies, finally mentioned Franco-Nevada Corp.(NYSE: FNV). But, as he himself pointed out, Franco-Nevada Corp. is an investment firm that finances mining companies and is not a mining company per se. It has only 29 employees! Moreover, CEO David Harquail recently told an audience at the BMO Capital Markets mining conference that there’s no growth left in gold mining investment projects, and the company is gradually shifting to energy plays.
Gold vs. Stocks: No Contest!
Look at the Philadelphia Gold and Silver Index on the chart below. It’s been a disaster. Since January 1, 2001, the index has returned a total of 63.3%, while the SPDR S&P 500 ETF Trust has returned 104.5%. We should also count dividends – the S&P 500 pays more than 2% a year, while the Philadelphia Gold and Silver Index’s annual dividend is miniscule. In sum, over the past 16 years, the S&P 500 more than doubled the return of the Philadelphia Gold and Silver Index with considerably less volatility.
In the past 10 years, the Philadelphia Gold and Silver Index has lost 28.6%, while the S&P 500 has climbed 440%, not counting dividends

Why do gold stocks, both large and small, underperform? According to Dan Oliver, an expert with Myrmikan Capital in New York, almost all miners are excessively leveraged and overcapitalized with too much in debt and call options. They do very well during the boom phase, but during the inevitable crash, the debt financing becomes unpayable, and the gold equities collapse.
For these reasons, gold stocks, as a sector, are terrible investments and definitely not a good long-term way to build wealth. They are useful only as a short-term speculation.
The lesson is important: Investors beware! Most investors should avoid gold stocks like the plague. Gold and silver coins can be good investments over the long haul, but don’t be talked into buying gold stocks for the long term.
And think twice about attending a gold bug or “natural resource” investment conference loaded with doomsayers. Go ONLY if you are a high-risk speculator who can withstand a barrage of Armageddon scenarios. If you are an easily scared investor, it may be the most expensive conference you ever attend.
Good investing, AEIOU,
Mark Skousen
“Should You Invest in Gold Stocks?” The conference will run July 19-22 in Las Vegas. For more information, click here.

Today’s videos and charts (double click to enlarge):
SFS Key Charts & Video Analysis
![]()

SF Juniors Key Charts & Video Analysis

SF60 Key Charts & Tactics Video Analysis
SF Trader Time Key Charts Video Analysis

Morris
After the U.S. economy disintegrated in 2008, due to the Banking and Housing crisis, Americans pawned off a record amount of gold. How much gold? Nearly, 32 million oz (1,000 metric tons). That’s one heck of a lot of gold. Matter-a-fact, U.S. gold scrap supply at its peak of 160 metric tons (mt) in 2011, was more than any other country in the world, even India and China.
It is quite unfortunate that Americans have pawned off their best asset only to go further into debt. Thus, enabling them to buy more garbage and trinkets they really don’t need. This is quite the opposite of Americans who become being extremely frugal and financially responsible after the 1930’s Great Depression. Today, banks have made it easy for Americans to BUY NOW and PAY LATER.
The consequences of this “Buy now, pay later” economic model is explained in this recent zerohedge article, 45% Of Americans Spend Up To Half Their Income Repaying Credit Card Debts:
First, roughly 50% of Americans have debt balances, excluding mortgages mind you, of over $25,000, with the average person owing over $37,000, versus a median personal income of just over $30,000.
Therefore, it’s not difficult to believe, as Northwestern Mutual points out, that 45% of Americans spend up to half of their monthly take home pay on debt service alone….which, again, excludes mortgage debt.
Because 45% of Americans are paying up to half of their monthly income to pay down credit cards and debt, they can’t use this income to purchase new goods and services. Thus, a staggering amount of the U.S. Gross Domestic Product (GDP) has been brought forward… thanks to easy credit and credit cards.
And, This is what Americans spent the most money on in the first quarter:

But that doesn’t mean that Americans stopped spending completely, quite the contrary. According to the BEA’s “goalseeked” models, even as retail sales tumbled, as Obamacare continued to drain disposable income away from other discretionary purchases, Americans – who spent far less on cars, clothing and housing in the first quarter than in Q4 – were scrambling to buy… recreational vehicles!?
When I travel up and down on the interstate where I live, I see a lot of these Recreational Vehicles (RVs), especially on the weekends. What is even more hilarious, is to see a huge 4X4 truck pulling a large RV, which is also pulling a smaller trailer behind it with two ATV’s on it. All of these vehicles consume one hell of a lot of fuel.
This sudden motivation for Americans to get into a RV and leave the RAT RACE (for a weekend), makes perfect sense to me. This is an extremely important indicator showing how Americans would rather go further into debt up to their eyeballs…. just to GET AWAY from it all. Americans spending a record percentage of their funds on RV’s to escape the insanity, suggests that the economy is getting ready to roll over and fall off a cliff.
Of course, Americans always want to do everything BIG. So, if you have the money (or credit) and a very large truck, you can pull one of these babies down the highway:

Most of the RV’s I see, have two axles. However, this one has four axles and more square feet than some small homes in older areas surrounding big cities. Unfortunately, RV’s will be one of the first items that will go extinct in the United States when the domestic oil industry disintegrates.
Regardless, let’s get back to the drying up of the U.S. secondary gold supply market.
According to the data put out in the GFMS 2017 World Gold Survey, U.S. gold scrap supply fell to a low of 58.7 metric tons (1.9 million oz) in 2016 versus a record 160 metric tons (5.1 million oz) in 2011:

What is interesting to see in this chart is that U.S. gold scrap supply in 2016 (58.7 metric tons) is nearly two and a half times less than it was in 2010 (143 metric tons) while the gold price was even higher. Thus, Americans pawned off a great deal more gold in 2010 when the price was lower at $1,225 compared to $1,267 in 2016. Which means, the U.S. gold scrap supply market is drying up.
This can be more clearly seen in the following chart below:

Not only has the U.S. gold scrap supply fallen 2.5 times from its peak in 2011, it is also less than it was in 2003 when the gold price was 3.5 times less. Americans pawned 67.6 metric tons (mt) of gold in 2003 when the price was $363 on ounce. However, with the gold price at a much higher level of $1,267 last year, U.S. gold scrap supply fell to a low of 58.7 mt.
Again, the data implies that the U.S. secondary gold scrap supply market is likely drying up.
As was stated in the beginning of the article, total U.S. gold scrap supply equaled nearly 1,000 mt from 2008 to 2016 (actual figure was 982 mt). What is even more interesting, is if we compare U.S. jewelry demand versus gold scrap versus China & India.
When the gold price reached a peak of $1,900 in 2011, U.S. jewelry demand was 60.3 mt. Again, this is the year U.S. gold scrap supply reached a record 160 mt. We must remember, most of gold scrap comes from recycled gold jewelry. Which means, Americans pawned 266% more gold than their gold jewelry demand in 2011.
Here are the 2011 Gold figures for the U.S., China & India:
2011 U.S. Gold Scrap 160 mt / 60.3 mt Gold Jewelry Demand = 266%
2011 Chinese Gold Scrap 144 mt / 547 mt Gold Jewelry Demand = 26%
2011 Indian Gold Scrap 58 mt / 667 mt Gold Jewelry Demand = 9%
As we can see, Americans pawned off 266% more gold than their annual gold jewelry demand in 2011, versus 26% for the Chinese and only 9% for Indians. While some Chinese and Indians were selling their gold jewelry as scrap in 2011, the majority were holding on to it, especially in India. Of course, this is no secret as India tradition is to build their wealth by acquiring gold jewelry.
Americans are in serous trouble as they have sold off the family’s gold jewels to go further into debt, while the Asians and Indians continue to acquire the yellow precious metal. When the markets finally crack, very few Americans will be holding gold. Unfortunately, the majority of Americans will see their highly inflated investments of STOCKS, BONDS and REAL ESTATE collapse while the value-price of gold skyrockets.
Check back for new articles and updates at the SRSrocco Report.
May 2, 2017
- Gold and silver currently have a bit of a fundamentally and technically oriented “hangover”.
- Please Double-click to enlarge image below. From a technical perspective, gold is recoiling from the weekly chart downtrend line and a daily chart overbought condition.
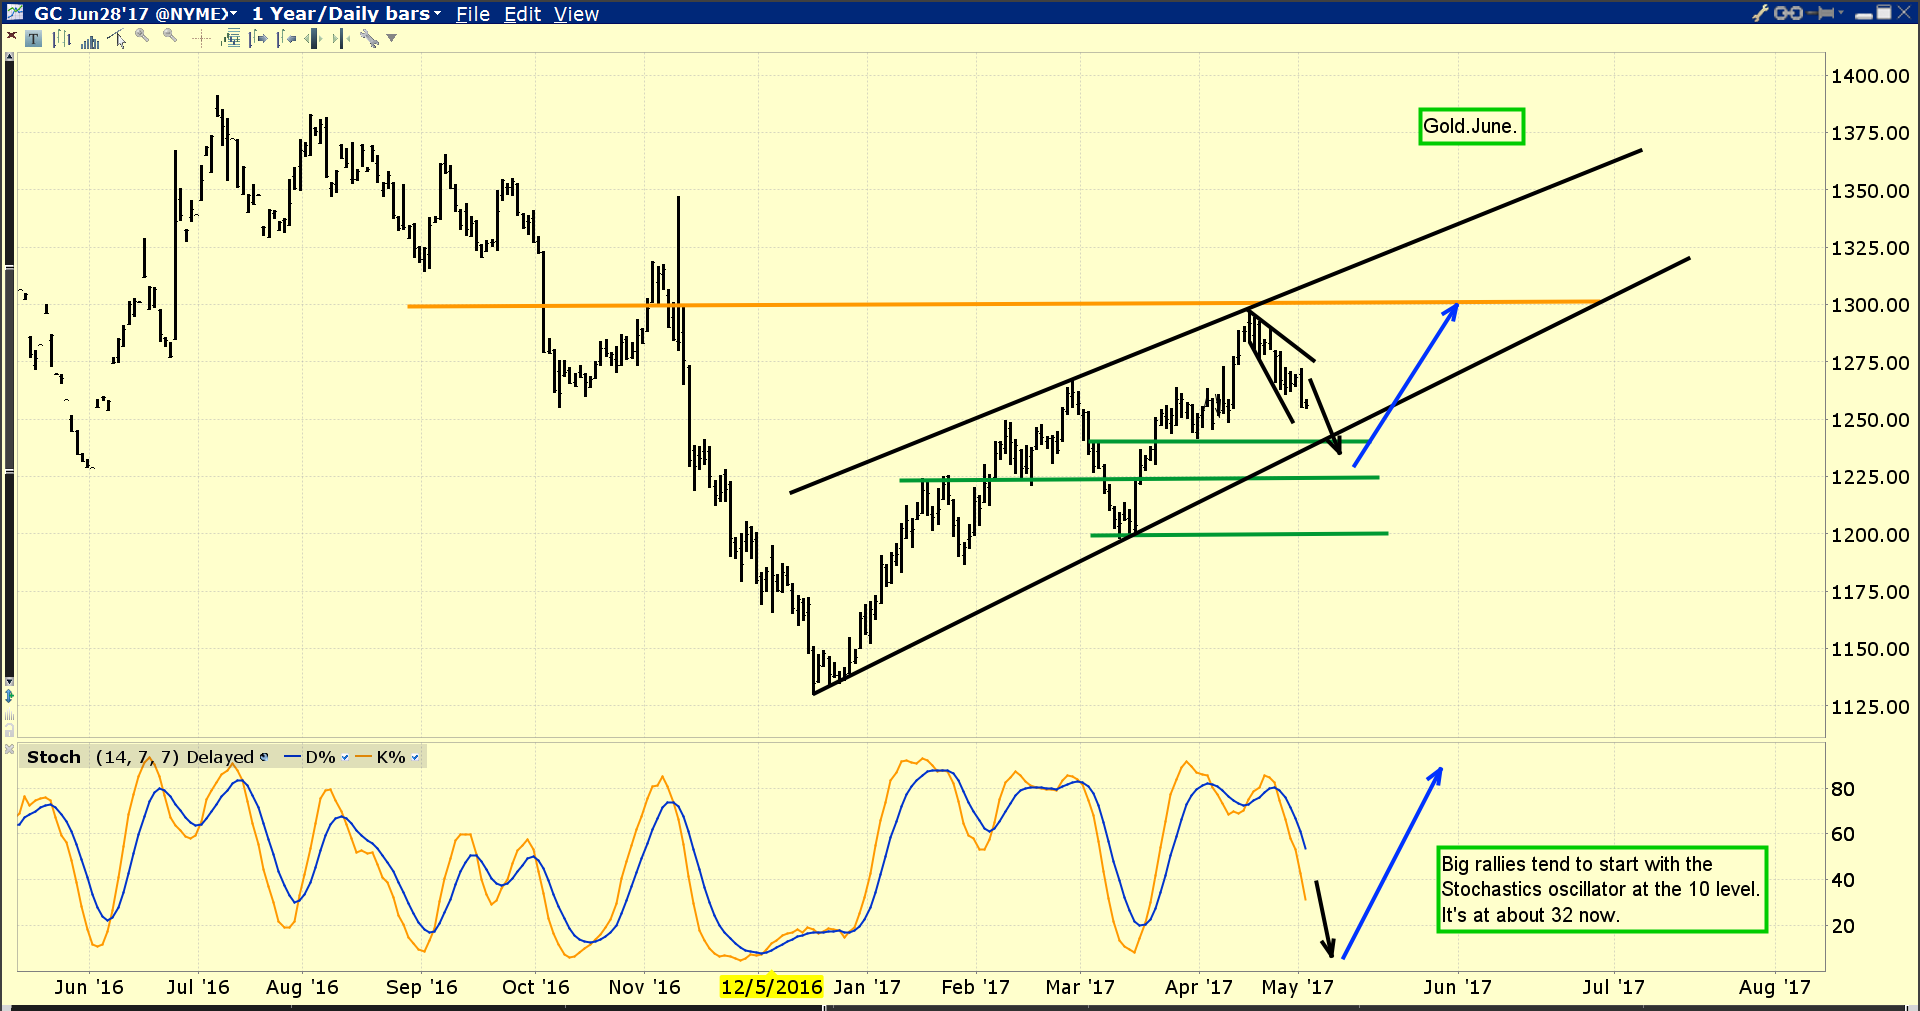
- The Stochastics oscillator I use for the daily gold chart is the 14,7,7 series. It’s now at about 32, and decent rallies tend to begin after it’s declined to about 10.
- From a fundamental perspective, gold is in between rate hikes in America. It tends to rally after a rate hike, and be soft before the hike. That’s the case right now.
- The next FOMC meeting is on Wednesday. I expect Janet Yellen will hint that the June rate hike is not a sure thing, and that will do nothing to alleviate the current price softness.
- Also, the next jobs report is due to be released on Friday. Gold has a rough general tendency to decline ahead of the jobs report, and then rally after it is released.
- So far, gold is reacting with “textbook” price softness ahead of this jobs report. All members of the world gold community should cheer that it rallies with textbook strength once this report is released!
- The end of Indian dealer stocking for the Akha Teej festival is probably the biggest reason for the current “wet noodle” gold price action.
- Dealer stocking in preparation for the festival was incredibly strong and created the gold price rally to the $1300 area.
- Unfortunately, while Indian citizens bought decent amounts of gold for the festival, it doesn’t appear to be as much as the dealers bought.That’s created a lull in the market.
- Please click here now. Double-click to enlarge. That’s a shorter term look at the gold chart.
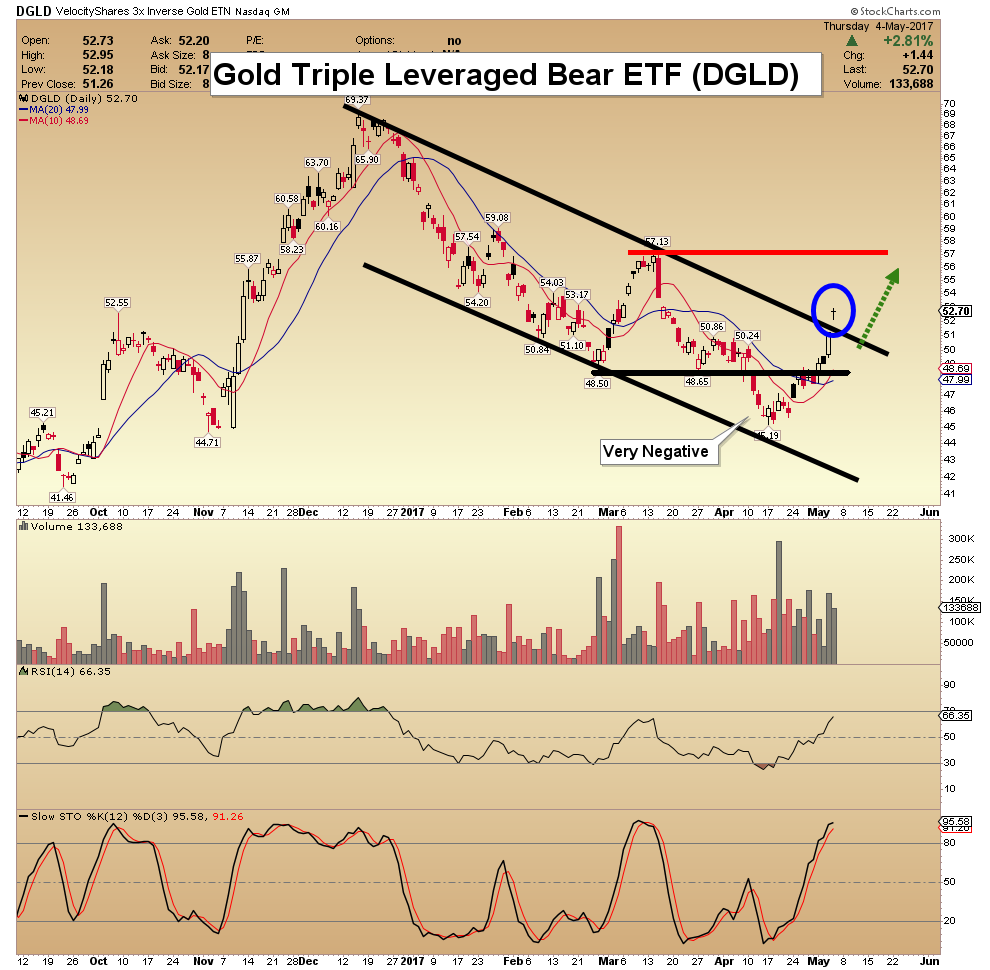
- Note the broadening pattern that has been in play since gold recoiled from the $1300 area high. These types of patterns tend to be resolved in quite a violent fashion.
- I carry short positions in gold that will only be covered if gold trades under $1000 an ounce. I hope I never cover these positions, but no analyst “knows” where gold is going for 100% sure, including myself.
- The wise investor carries some market positions that are essentially bets against their own outlook, and that’s what my short positions are!
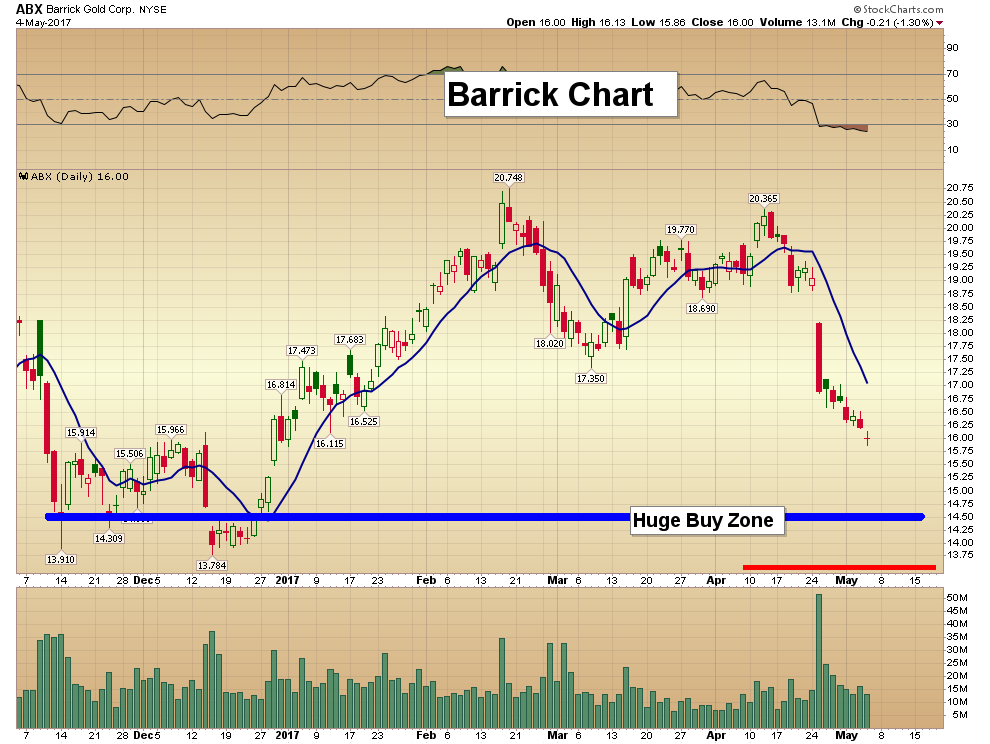
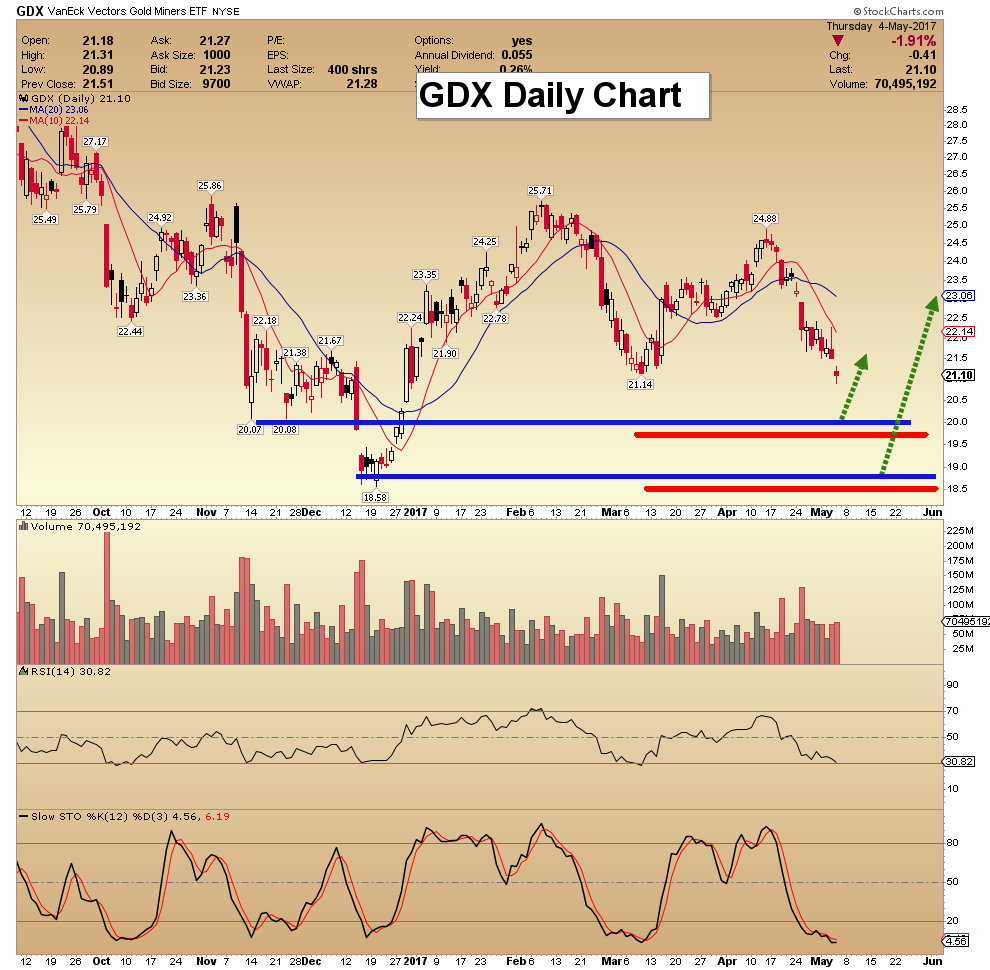
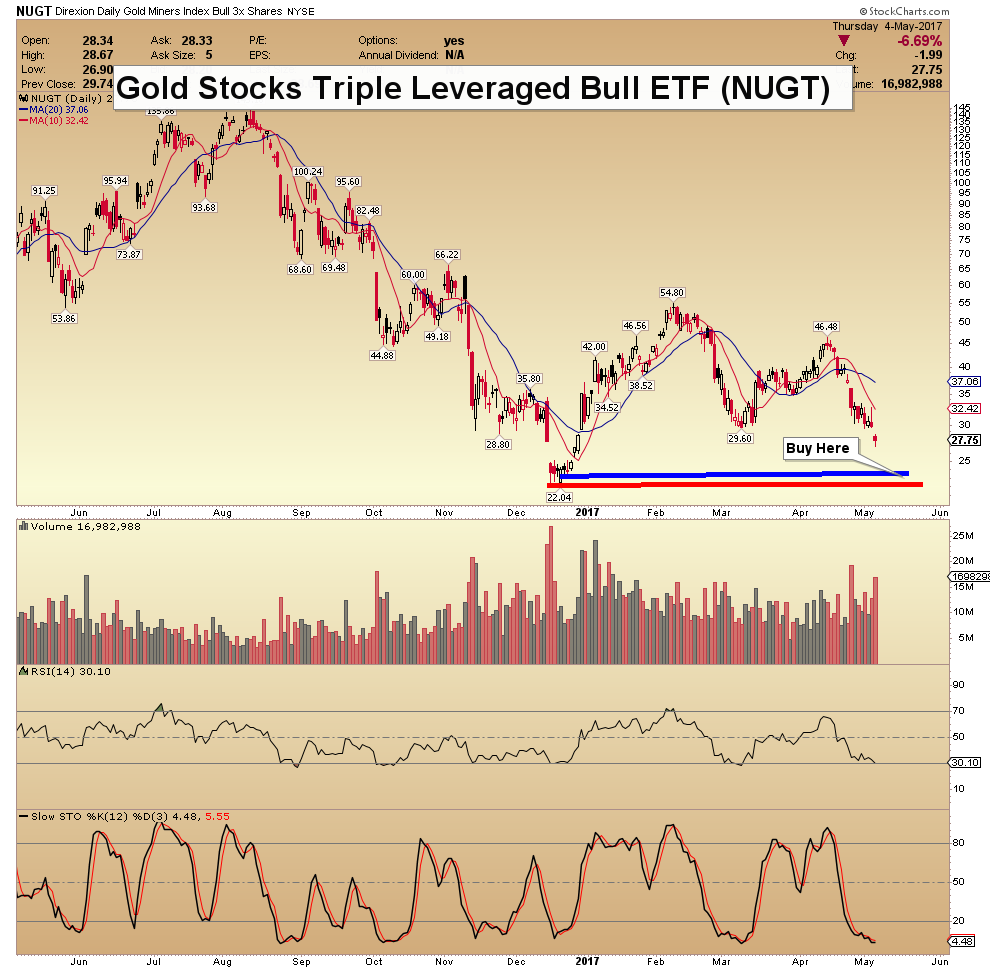
- Regardless, the current price weakness is a great buying opportunity for gold stock investors. Please click here now. Double-click to enlarge this GDX chart. I’m an accumulator of GDX in the $23 to $18 area, buying every ten cents decline in that price zone.
- The big banks buy in the same manner, and that’s because it’s impossible to consistently buy at points where the price is bottoming or breaking out to the upside.
- The entire world gold community should be keen gold stock accumulators at the current time. Put options can be used to manage downside risk during the accumulation process.
- Please click here now. The US central bank uses the PCE index as their main measure of inflation.
- It’s been rallying nicely, but has stalled at the same time as gold has stalled. More rate hikes are required to push the PCE index higher. The rally began around the time that Janet did her first rate hike in late 2015.
- In my professional opinion, American GDP growth will surprise on the upside in the coming months, and Janet will commit to a June hike. That will provide further incentive to banks to make more loans, and it will increase the profit margin for those loans.
- That’s inflationary, and the PCE index should turn higher once the next rate hike has occurred. GDX and most gold stocks should turn higher in advance of the PCE upturn.
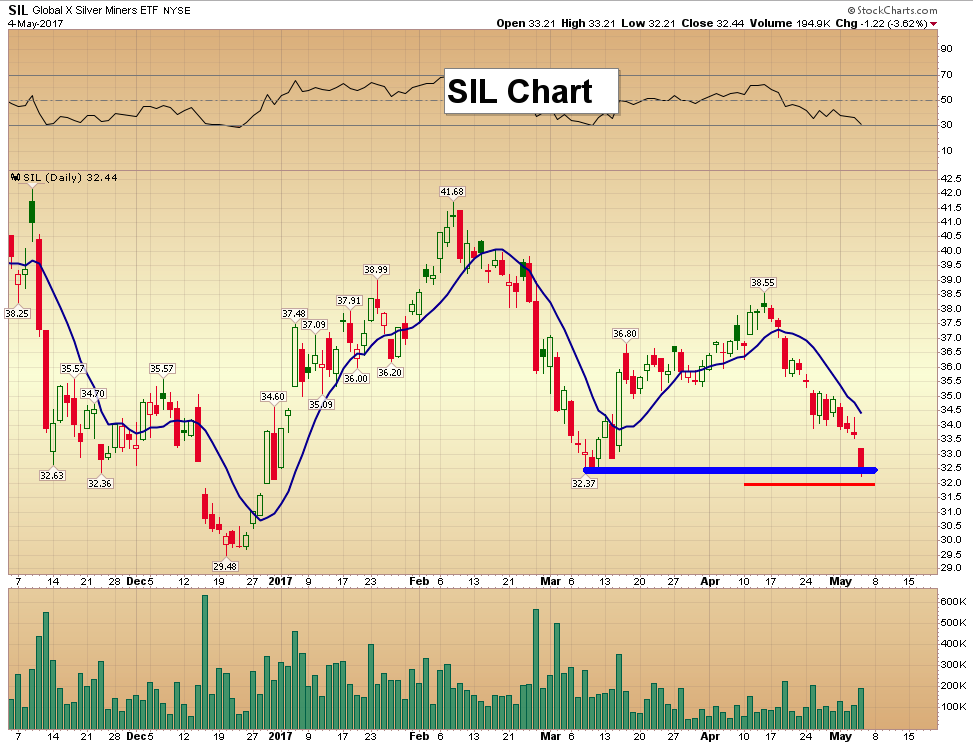
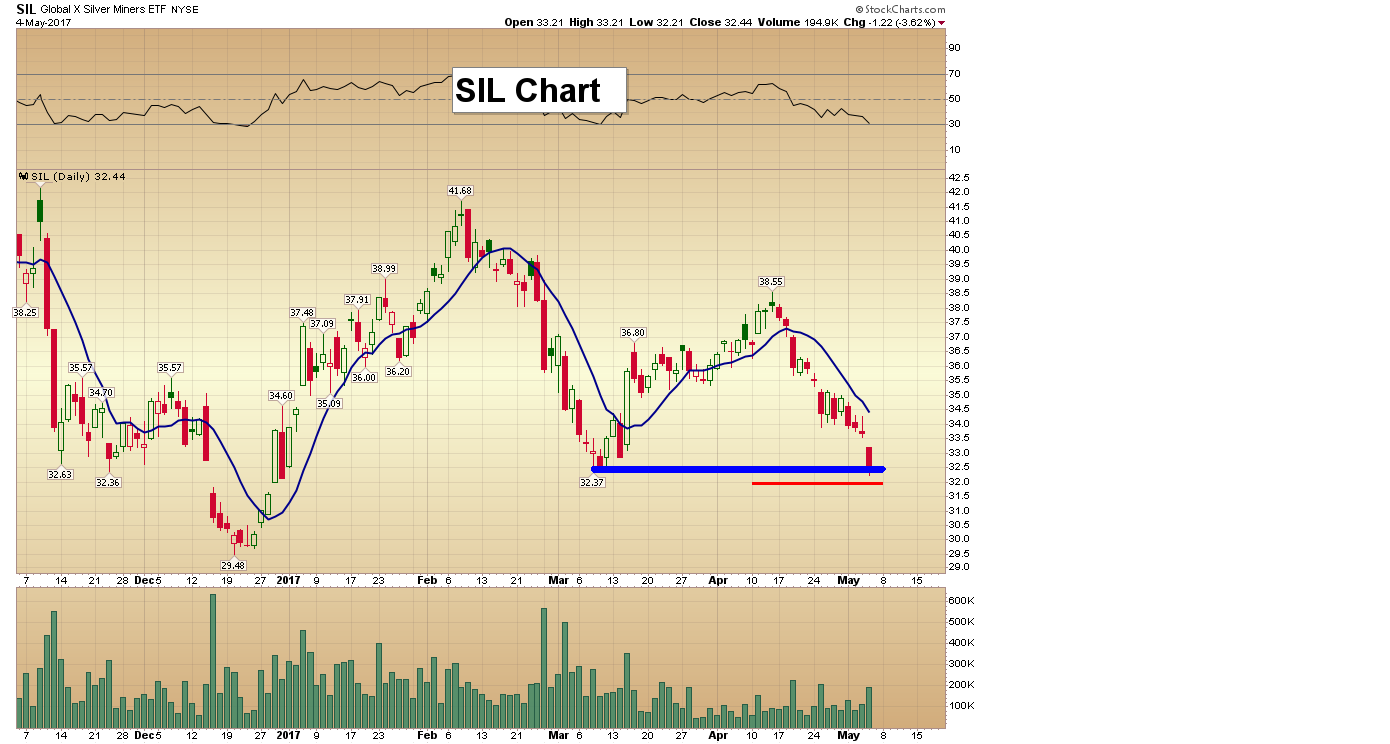
- Please click here now. Double-click to enlarge. Silver is now trading in a rectangular formation. The bottom of the rectangle is a great buying area for accumulators, and that’s exactly where the price is now.
- Please click here now. International FCStone has essentially the same gold market outlook that I have for the month of May, which is that the current price softness is not quite over.
- When the softness ends (with an ending point that is likely this Friday) a very violent upside rally will occur, perhaps pushing gold up towards the $1300 area highs! All precious metal investors should be in accumulation mode now, so they can enjoy the imminent upside action!

Thanks!
Cheers
st
May 2, 2017
Stewart Thomson
Graceland Updates
website: www.gracelandupdates.com
email for questions: stewart@gracelandupdates.com
email to request the free reports: freereports@gracelandupdates.com

On Wednesday, the White House unveiled Trump’s tax reform plan. What does it mean for the gold market?
Finally, the new administration has presented the long-awaited tax plan. The key elements are as follows:
- The corporate tax rate cut from 35 percent to 15 percent.
- The number of personal income tax brackets reduced from seven to three, with a top rate of 35 percent and lower rates of 25 percent and 10 percent.
- The standard deduction doubled.
- Most of tax breaks eliminated.
- The introduction of a “one-time tax” on the trillions of dollars held by corporations overseas.
The whole plan is only about 100 words long and it is very similar to the Trump’s tax proposal from the campaign. The plan is said to provide a “massive tax cut”, or even the “biggest tax cut” in the U.S. history. So it should be good for the stock market and bad for gold, right? Well, it should, but there is one problem with that plan: it lacks any details. In particular, nobody knows how the tax cuts would be financed. As a reminder, an almost identical plan from the campaign would reduce federal revenues by $6.2 trillion, according to the Tax Policy Center. Hence, the proposal would boost the U.S. federal debt by $7.2 trillion (the sum includes interest costs) over the decade. It goes without saying that such a reform would be unacceptable for fiscally conservative Republicans. And because the plan is tilted toward the rich, Democrats would not accept it either.
This is why the plan disappointed the markets and raised justified skepticism, which sent the stock market lower and made gold rebound from two-week lows, as one can see in the charts below.
Chart 1: The S&P 500 Index over the last three days.
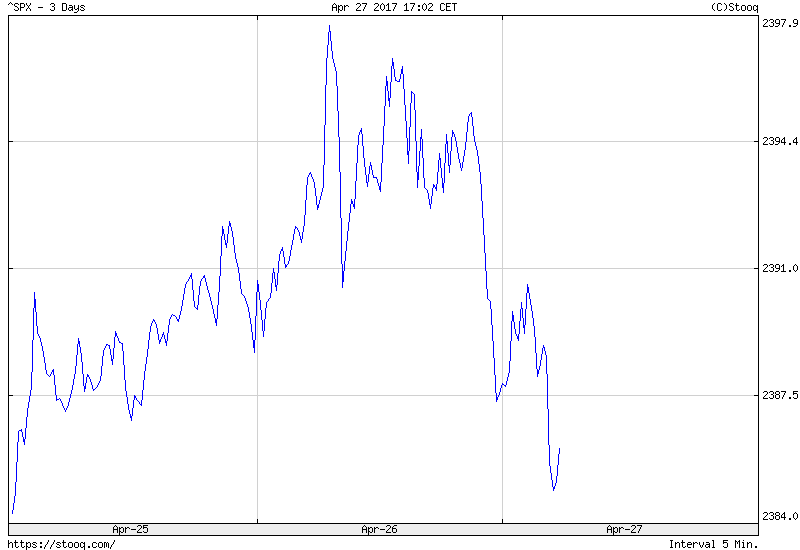
Chart 2: The price of gold over the last three days.
Summing up, Trump has finally presented his long-awaited tax plan. The proposal lacks any details and there are serious doubts how it might actually get passed in Congress. It signifies the final blow to the Trump rally, which is good news for the gold market.
If you enjoyed the above analysis, we invite you to check out our other services. We focus on fundamental analysis in our monthly Market Overview reports and we provide daily Gold & Silver Trading Alerts with clear buy and sell signals. If you’re not ready to subscribe yet and are not on our mailing list yet, we urge you to join our gold newsletter today. It’s free and if you don’t like it, you can easily unsubscribe.
Disclaimer: Please note that the aim of the above analysis is to discuss the likely long-term impact of the featured phenomenon on the price of gold and this analysis does not indicate (nor does it aim to do so) whether gold is likely to move higher or lower in the short- or medium term. In order to determine the latter, many additional factors need to be considered (i.e. sentiment, chart patterns, cycles, indicators, ratios, self-similar patterns and more) and we are taking them into account (and discussing the short- and medium-term outlook) in our trading alerts.
Thank you.
Arkadiusz Sieron
Sunshine Profits‘ Gold News Monitor and Market Overview Editor

-
I know Mike is a very solid investor and respect his opinions very much. So if he says pay attention to this or that - I will.
~ Dale G.
-
I've started managing my own investments so view Michael's site as a one-stop shop from which to get information and perspectives.
~ Dave E.
-
Michael offers easy reading, honest, common sense information that anyone can use in a practical manner.
~ der_al.
-
A sane voice in a scrambled investment world.
~ Ed R.
Inside Edge Pro Contributors

Greg Weldon

Josef Schachter

Tyler Bollhorn

Ryan Irvine

Paul Beattie

Martin Straith

Patrick Ceresna

Mark Leibovit

James Thorne

Victor Adair