
Gold & Precious Metals

- Don’t miss the next big rush in the cannabis / marijuana sector.
- Where is crude oil and natural gas headed?
- What about gold and silver?
Mark Leibovit’s VRtrader 90-minute Webinar on Tuesday, April 25th at 7pm Pacific Time to 8:30 pm
This is an exceptional opportunity to hear TIMER DIGEST’s top market-timer and internationally recognized expert in stock-picking and market forecasting and be able to communicate your questions directly to him during the Webinar. It is live. It is special. And, you will hear his money making ideas and strategies…

Before we look at tonight’s charts I would like to thank Sir Plunger for putting on the short oil trade this week while I was recovering from surgery. You won’t find a more through and in depth look at oil than what Sir Plunger offered. And wouldn’t you know it his timing as usual was impeccable. Oil dropped almost 4% today.
Now lets turn our attention to the sector which many members have a love hate relationship with.
There is a potential new pattern forming on some of the precious metals stock indexes which is only coming to light today. Before today’s price action there was only a guess of what may be forming with no confirmation. After today’s big gap breakout another piece of the puzzle is falling into place. Nothing is ever guaranteed when it comes to the markets, so all we can do is get the odds in our favor and try to recognize a potential pattern as soon as possible. Once you think you may have something figured out you then put together a game plan and work it until it either plays out or fails.
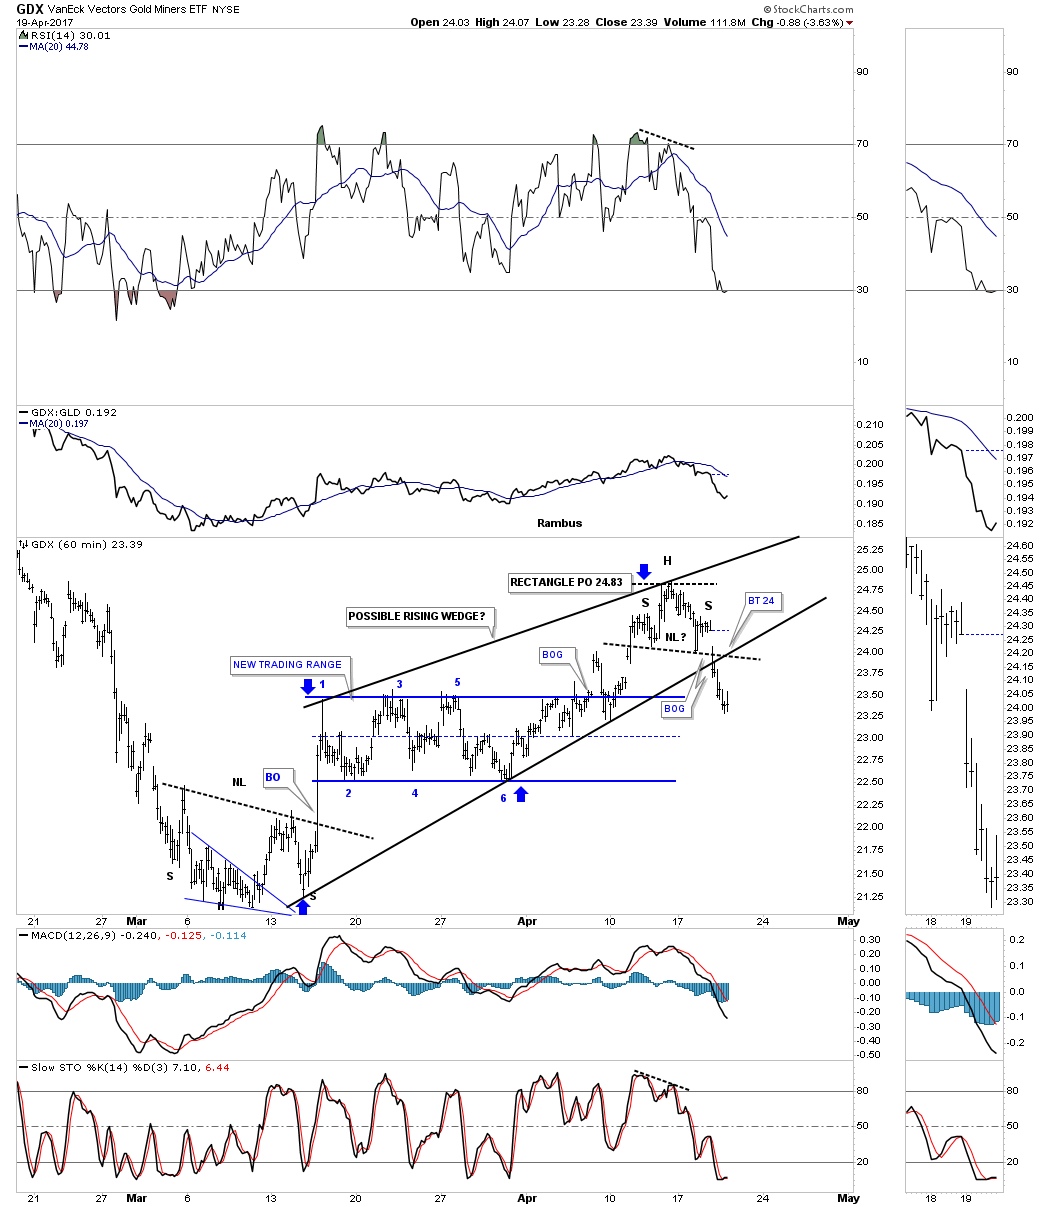
Lets start with the 60 minute chart for the GDX which shows the now completed bearish rising wedge. We got the H&S top which formed at the top of the rising wedge as the 4th reversal point making the rising wedge a consolidation pattern to the downside. It’s still possible we could see a backtest to the 24 area before the impulse leg down begins in earnest, but there are no guarantees. Note the inverse H&S bottom that formed in March which reversed the decline from the August 2016 high, a H&S at the bottom and a H&S at the top, both of which are reversal patterns.
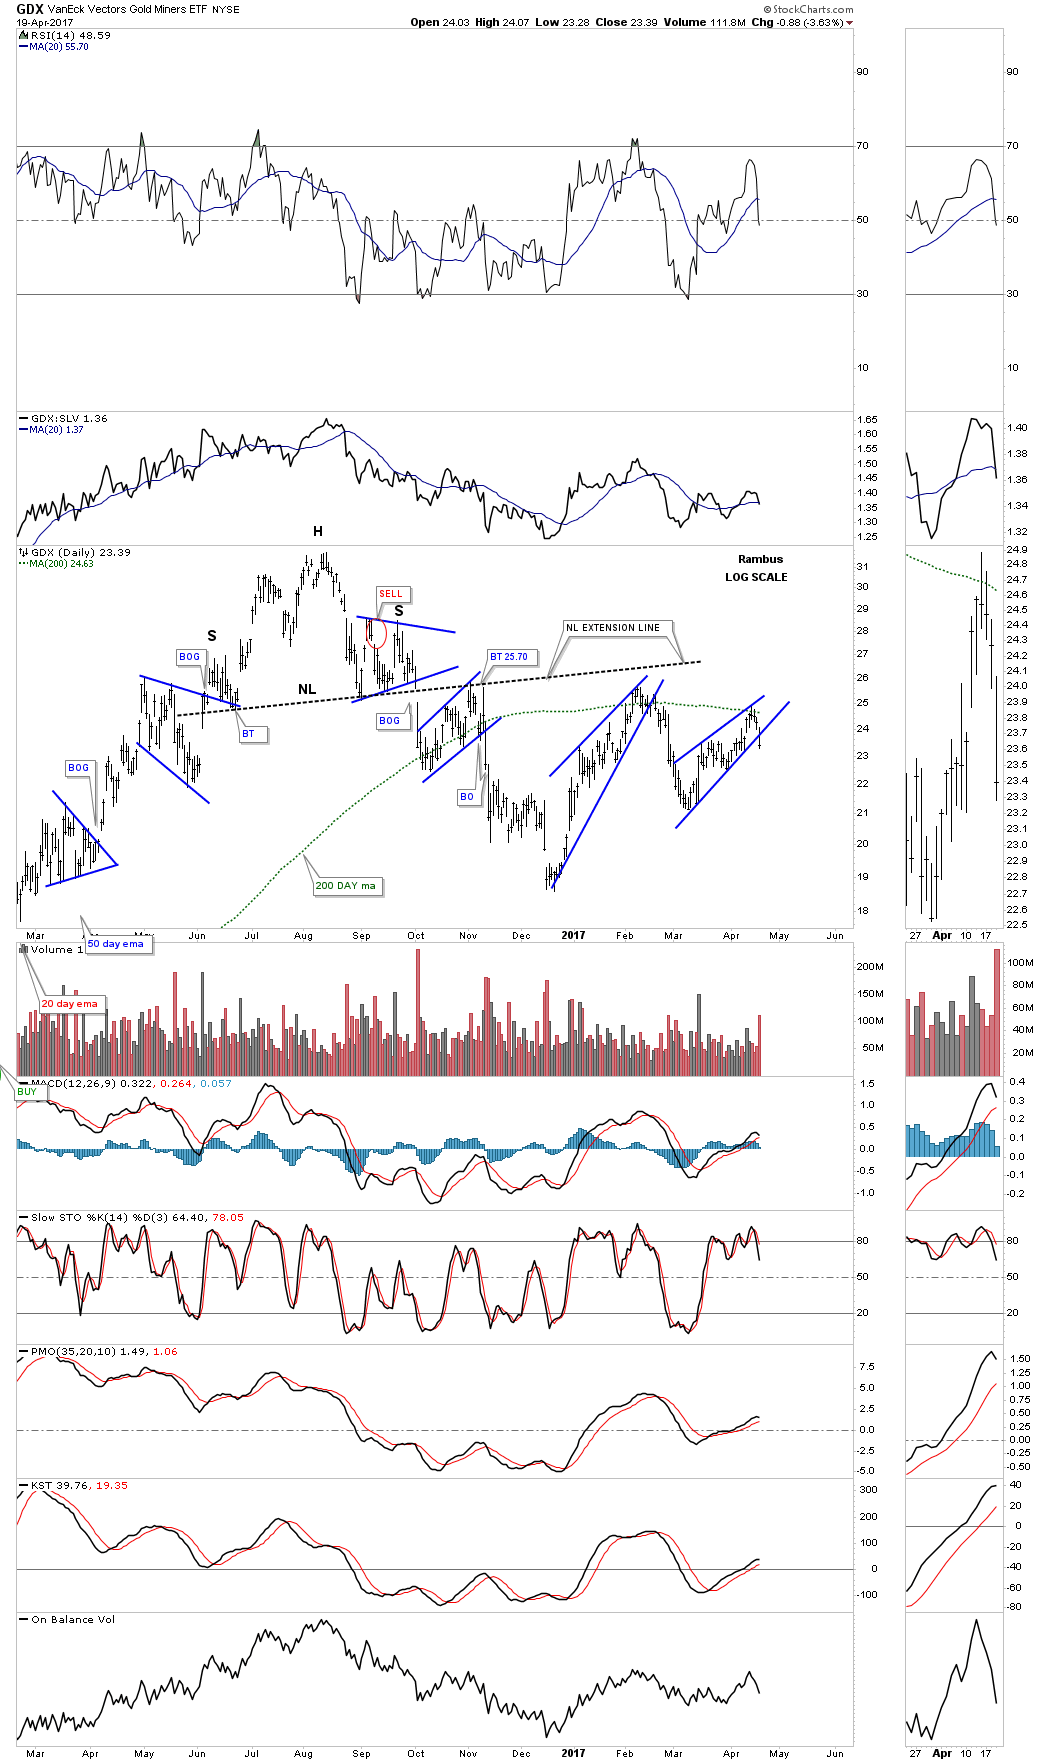
This next chart is a one year look we were watching during the big impulse leg up out of the January 2016 low to the August 2016 high. Here you can see another H&S top which reversed the 2016 rally. After forming several smaller consolidation patterns the GDX bottomed out in December of 2016. That 2 month rally produced the first blue bearish rising wedge with the 200 day ma offering resistance. If you recall we went short on the backtest to the underside of the rising wedge until the Fed announcement, which spiked GDX higher at the beginning of our current and smaller blue rising wedge. Today we shorted the PM stock indexes again, as the price action is in a similar spot to the bigger blue bearish rising wedge.
During the formation or any consolidation pattern there needs to be at least 4 reversal points to make it valid. Sometimes there are 6, 8 or more reversal points before a consolidation pattern is finished building out. Many times a consolidation pattern can be created with several smaller patterns which shows the reversal points. With today’s breakout below the bottom rail of the smaller blue bearish rising wedge it puts a possible triangle consolidation pattern in play. Now you can see how a potential game plan may start to develop.
The first thing we’ll look for is a possible backtest to the underside of the blue rising wedge and then a fall away. Next we’ll need to see how the price action interacts with the bottom rail of the nearly 4 month black triangle consolidation pattern, which still needs to complete the 4th reversal point. One piece of the puzzle at a time, but as long as the game plan keeps playing out there is no need to change things.

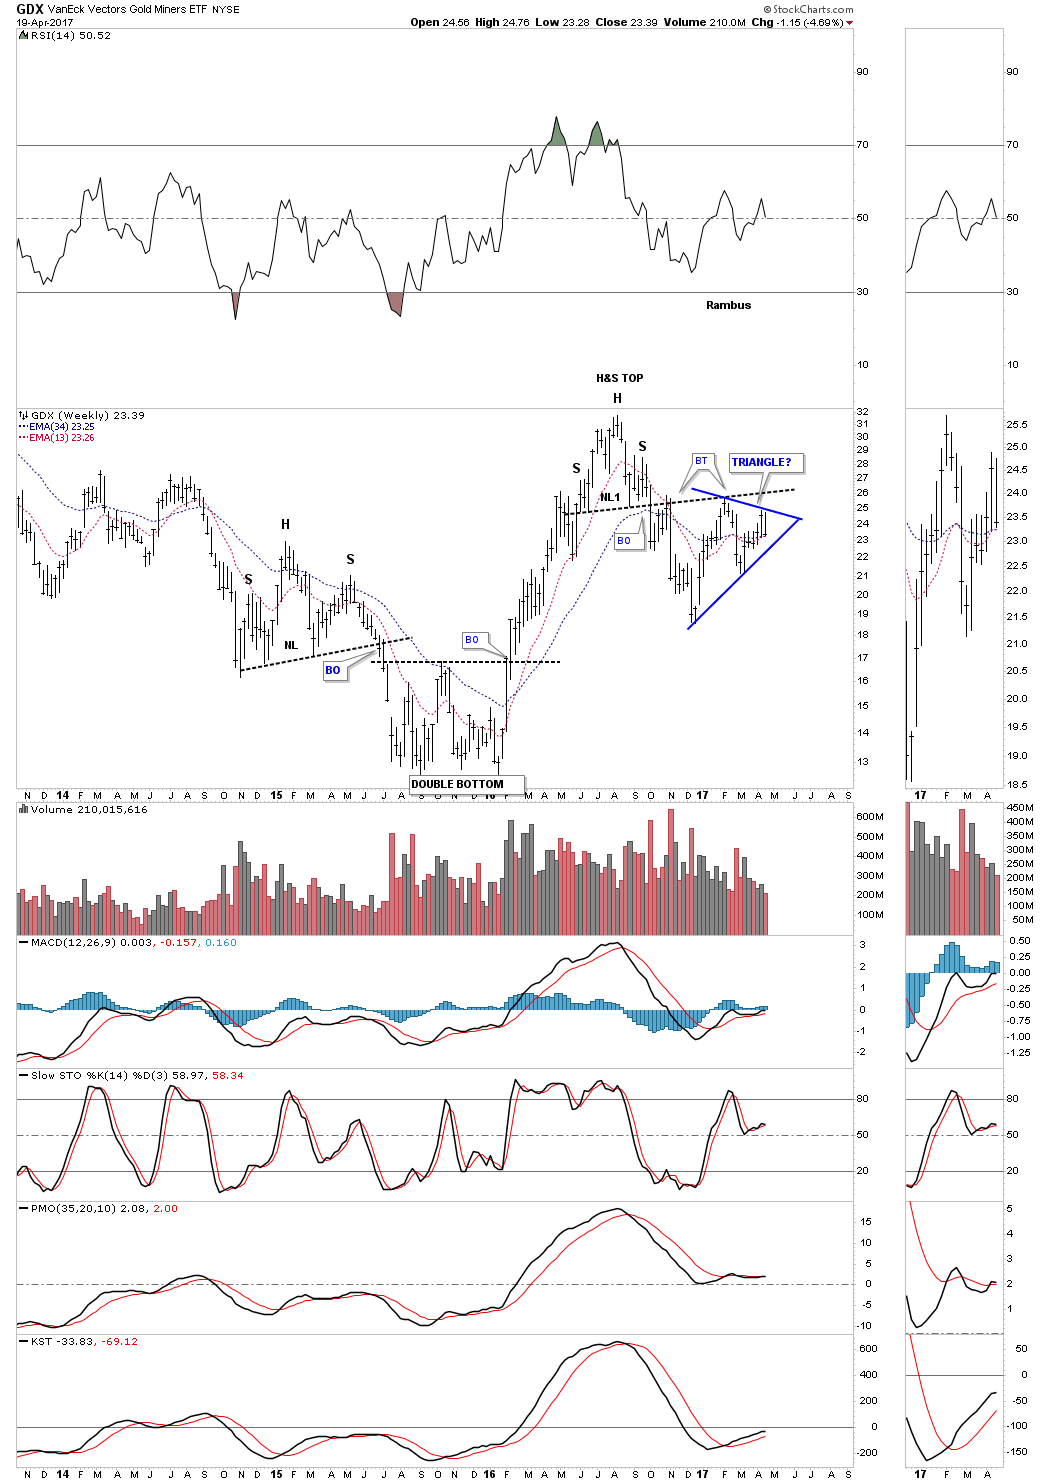
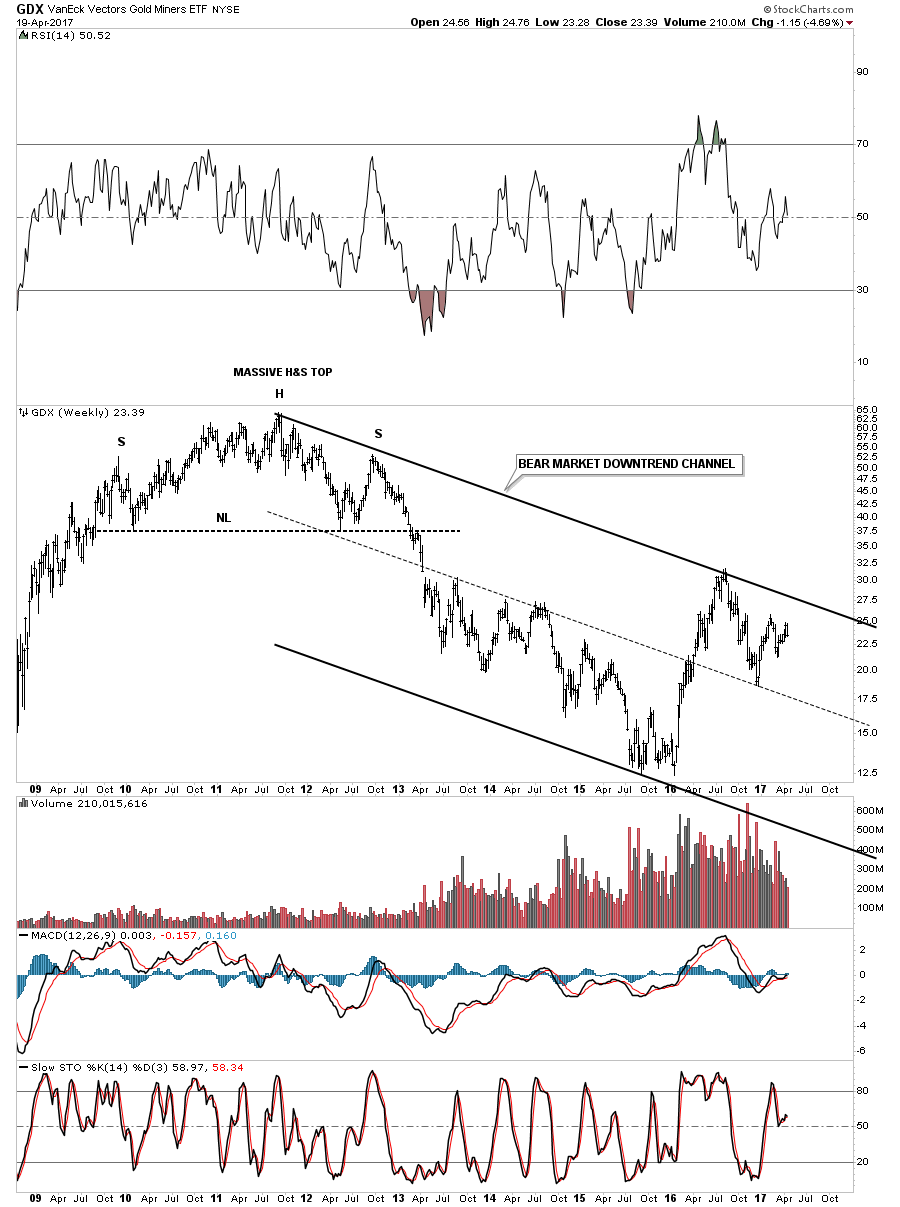
The weekly chart for the GDX shows how the potential triangle consolidation pattern fits into the big picture.
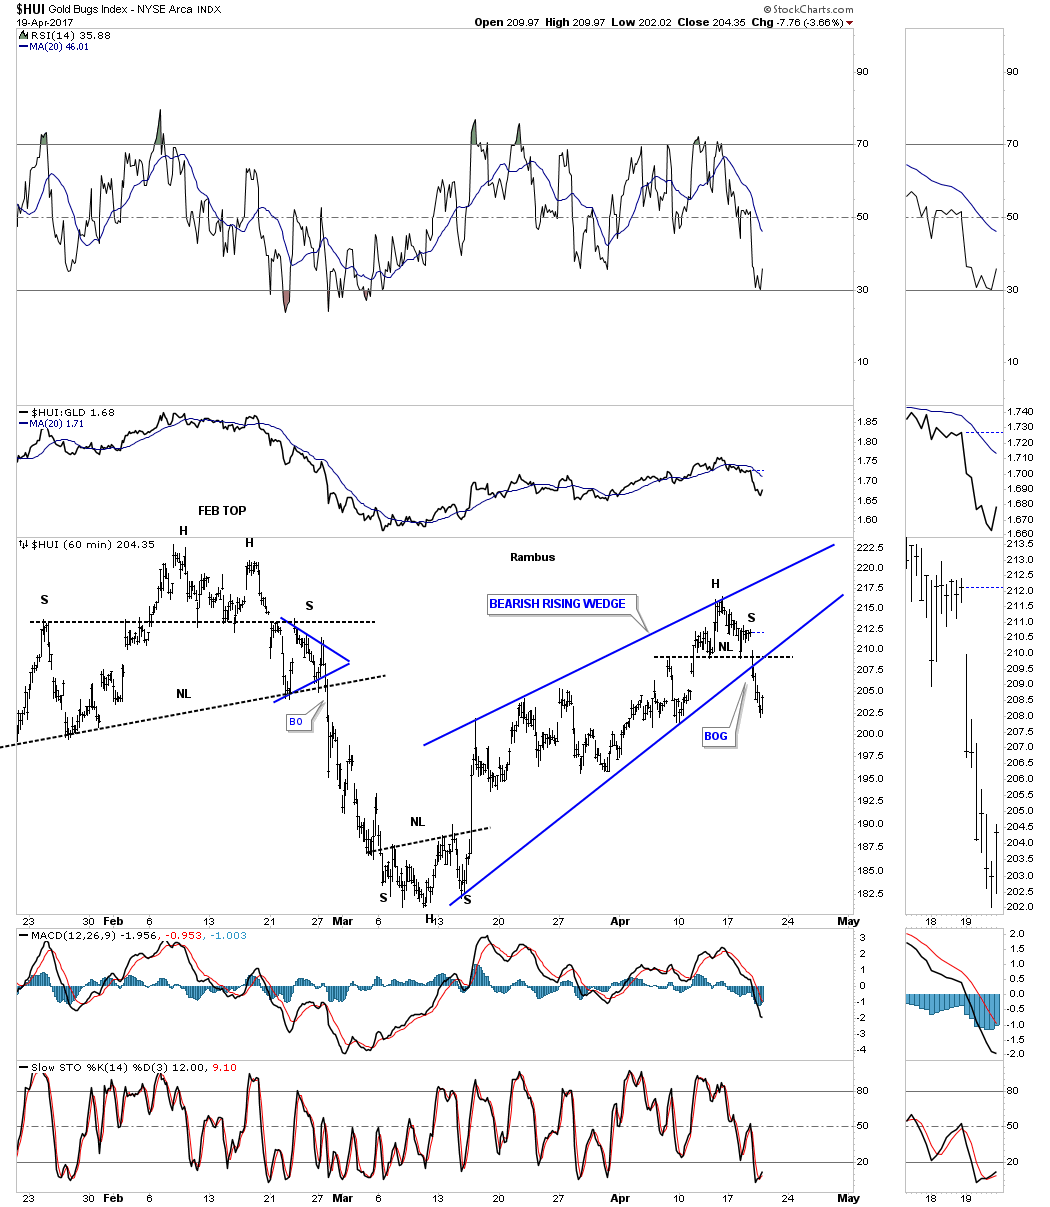
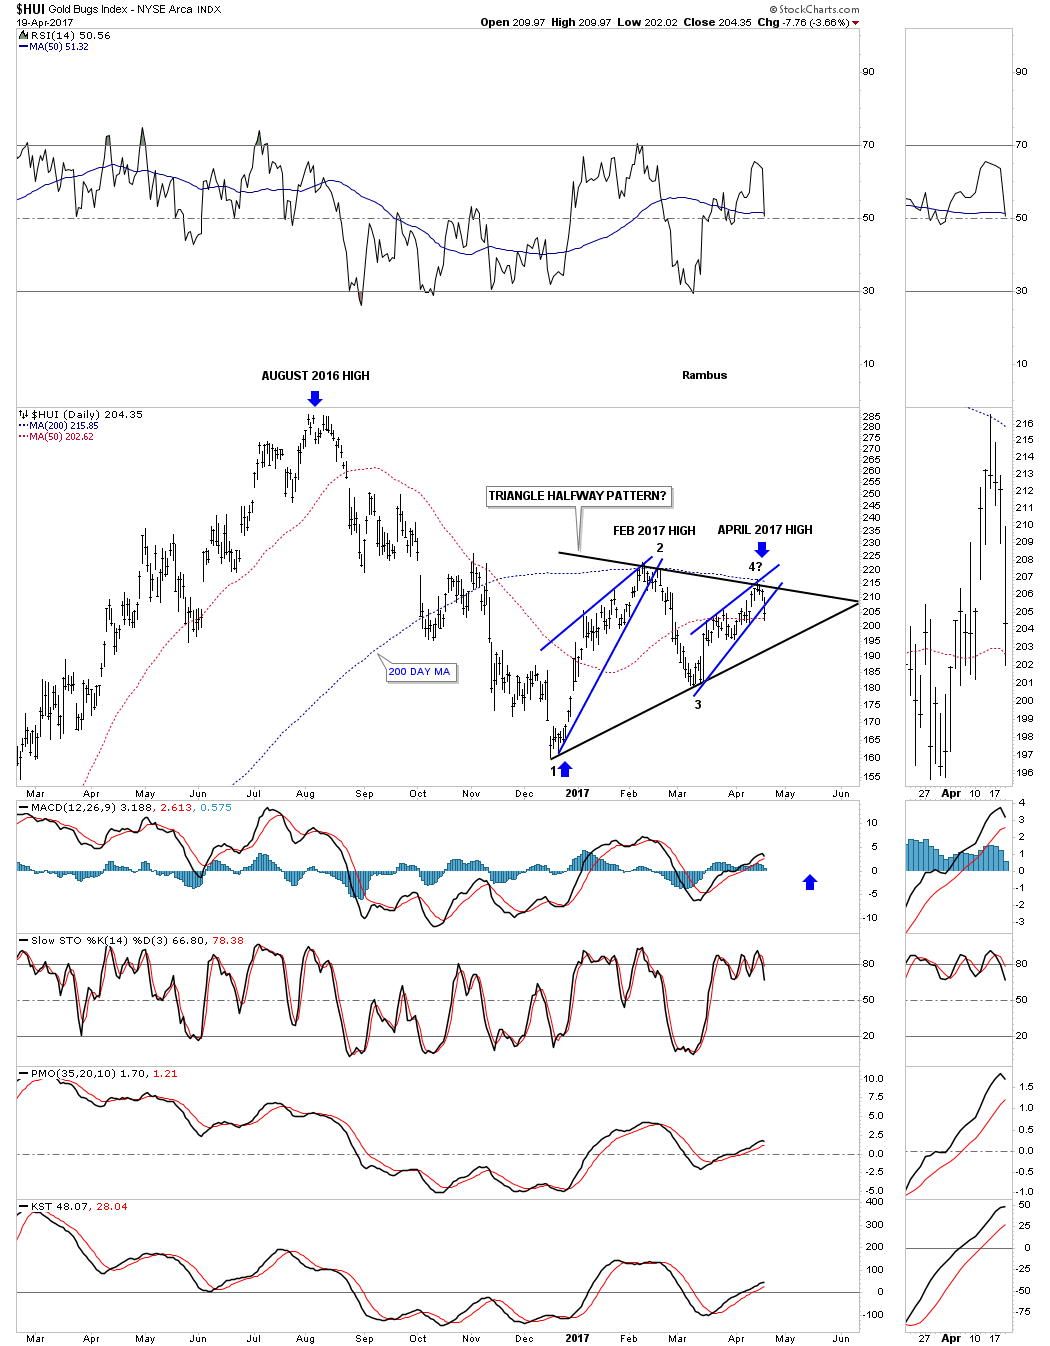
Lets look at one more PM stock index to see how its price action is building out. The 60 minute chart for the HUI shows it broke out today below the bottom rail of its bearish rising wedge.
In a confirmed downtrend one needs to see lower lows and lower highs. This daily chart below shows the August 2016 high, followed by the Feb 2017 high, followed by our most recent high in April, all lower highs. As you can see there is still more work to be done in building out the black triangle, but as long as things keep following the script we need to let things play out.
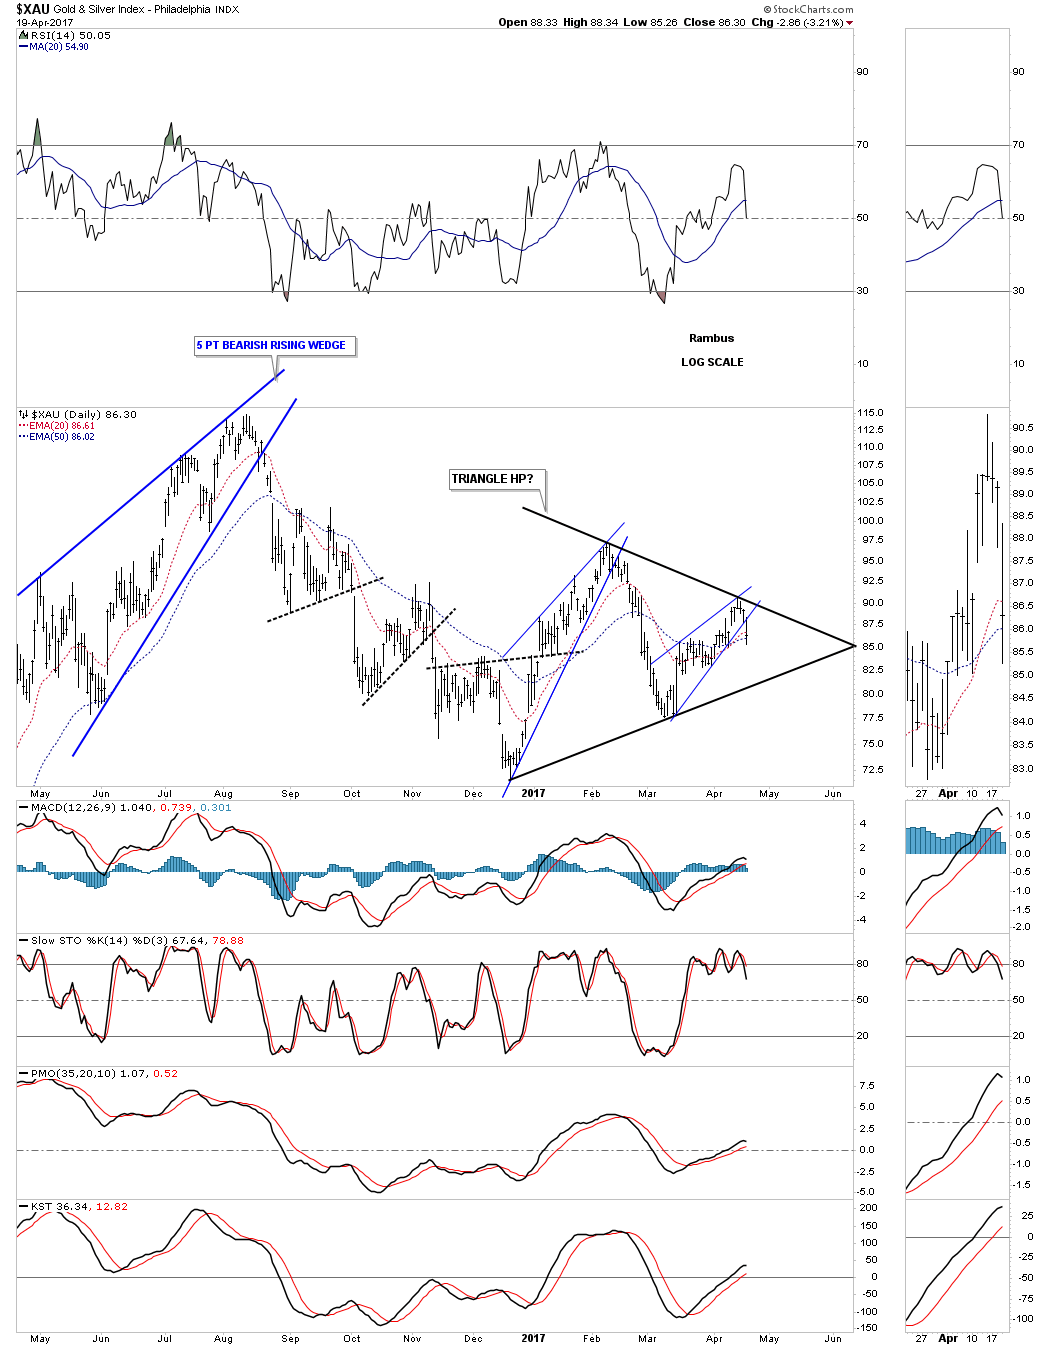
Below is the $XAU and its potential black triangle consolidation pattern.
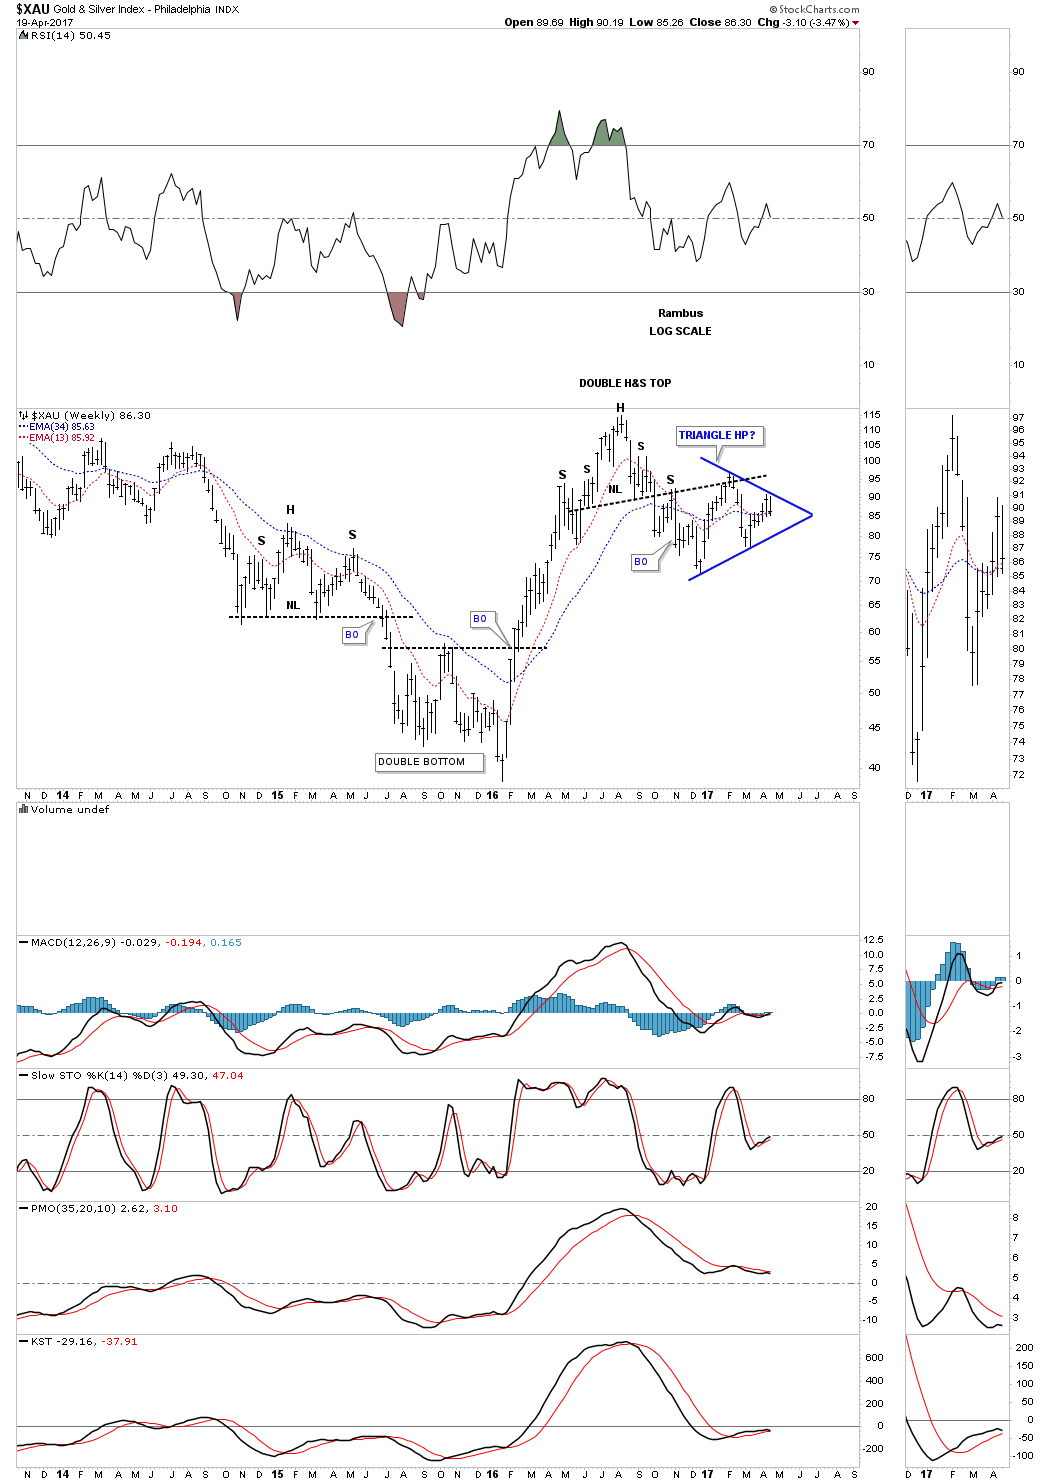
This weekly chart shows how the triangle consolidation pattern has built out just below the neckline, which has been holding resistance.
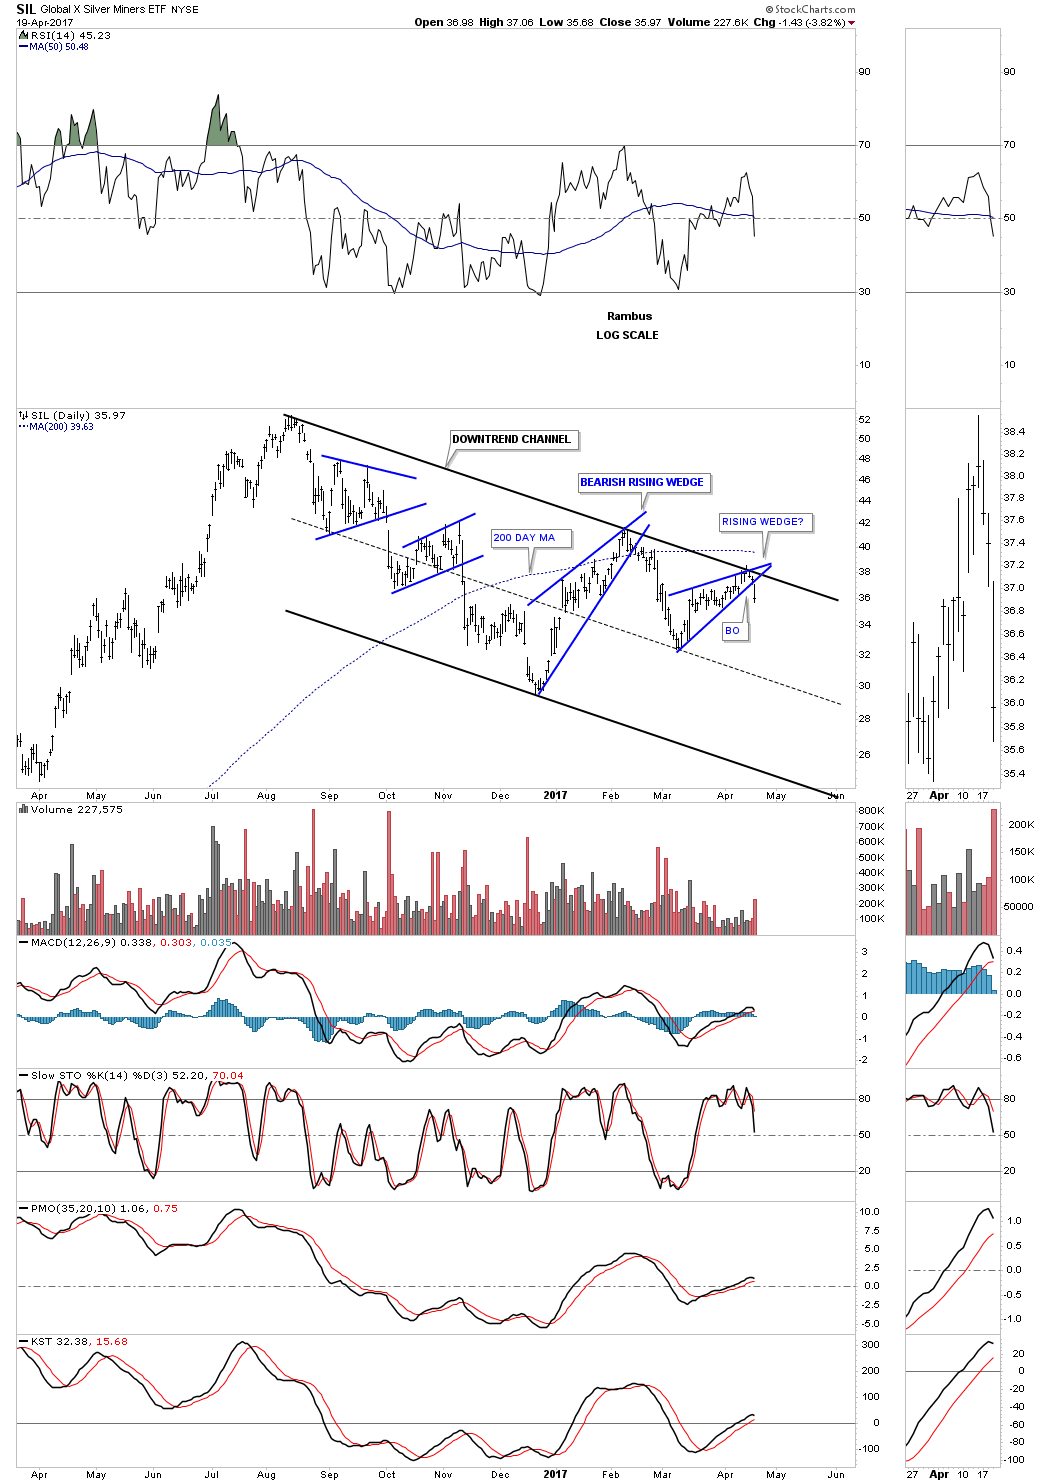
Below is the daily chart for the SIL which shows its downtrend channel firmly in place.
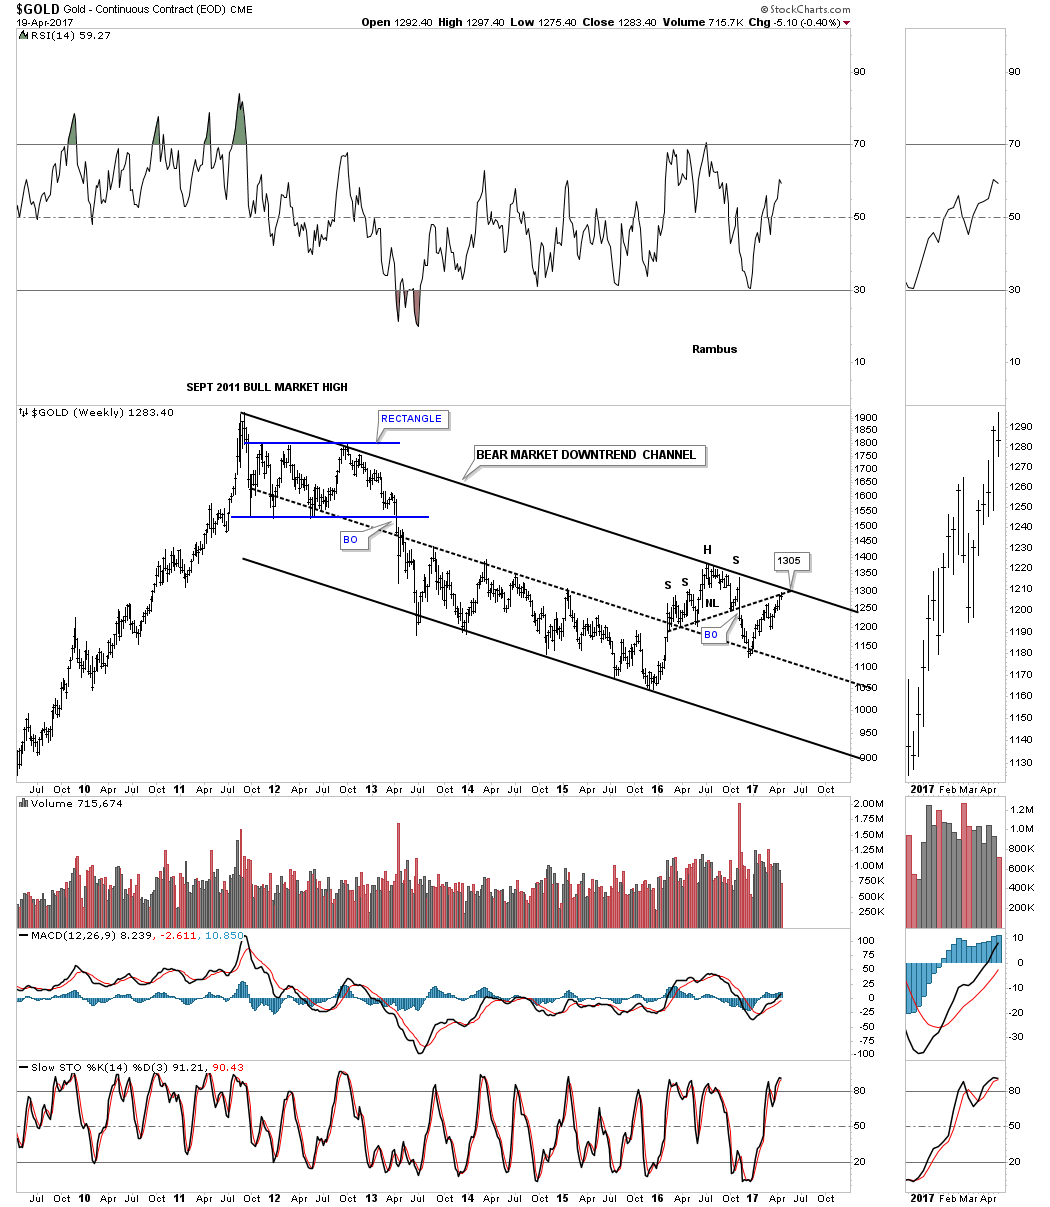
Lets change it up a bit and look at gold. If I had only one chart to use it would be this weekly chart which shows gold’s bear market downtrend channel. Since the first of the year I’ve been waiting patently for gold to rally back up to the top rail of the downtrend channel. I’ve been showing 1305 as the price objective for close to a year, which is now at hand. This is where the neckline and the top rail of the downtrend channel intersect. If gold can trade above that area then the bulls will be in charge.
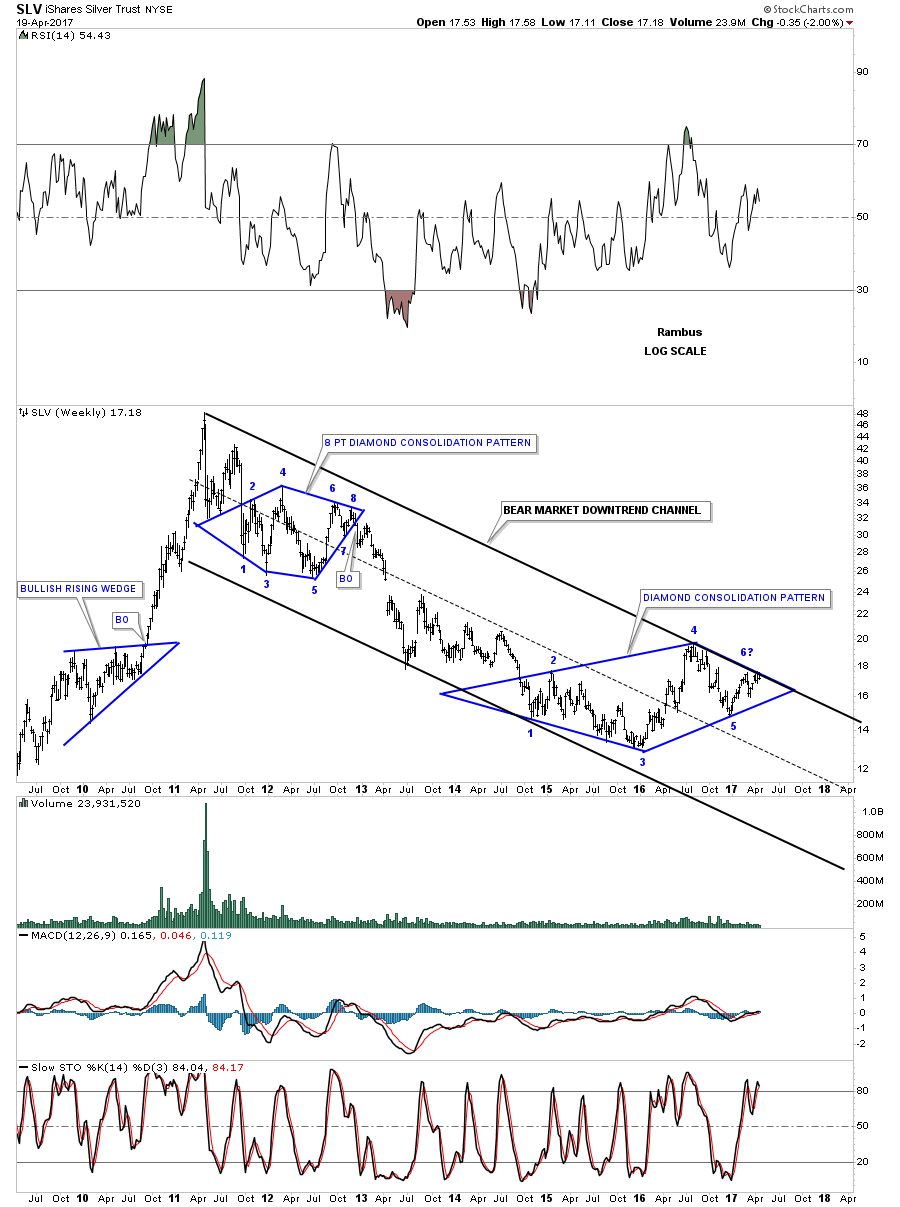
Ironically enough SLV is also testing the top rail of its bear market downtrend channel. The top rail of the downtrend channel may also be part of the 6 point diamond consolidation pattern.
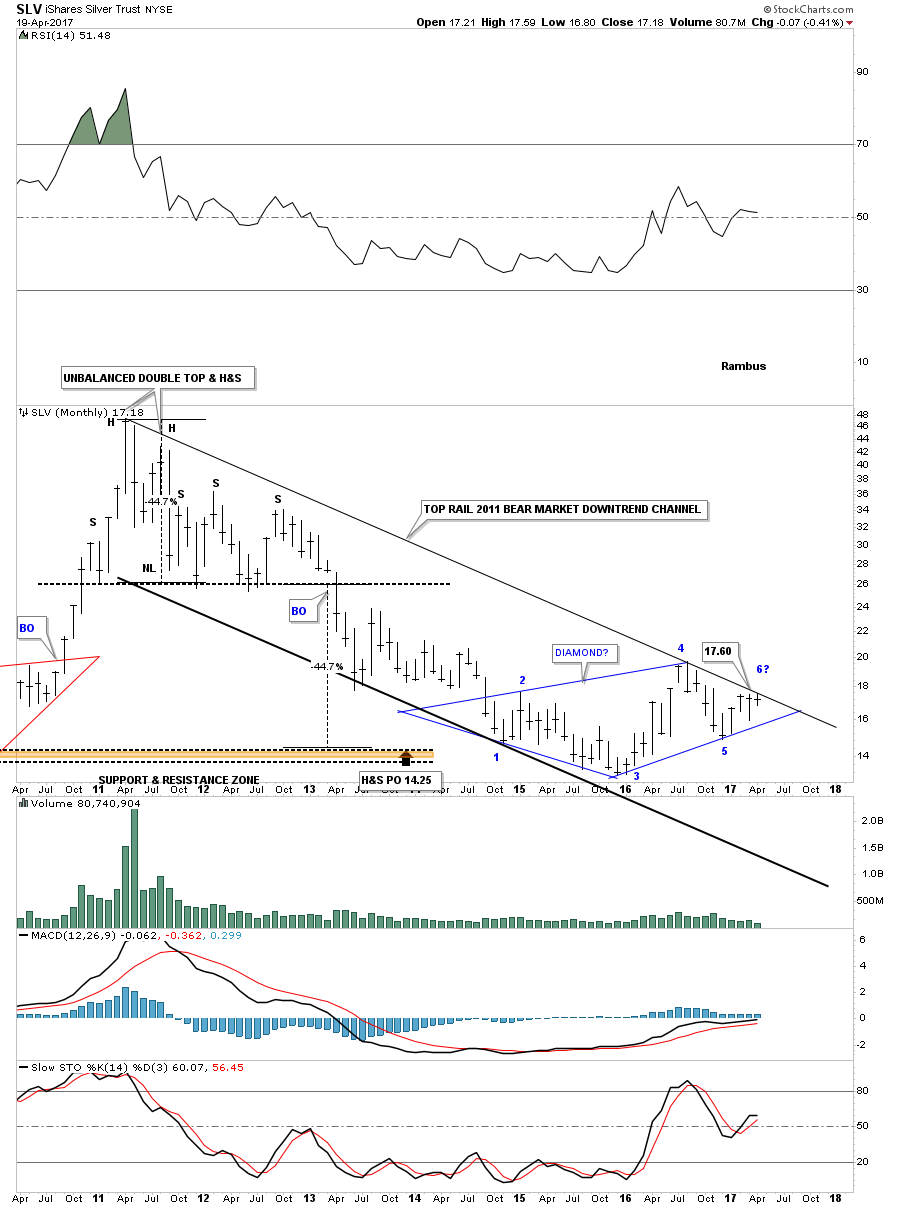
Below is a longer term weekly chart for SLV which shows the top rail of the downtrend channel holding resistance at the 6th reversal point in the blue diamond. To say this is a critical spot on this chart is an understatement.
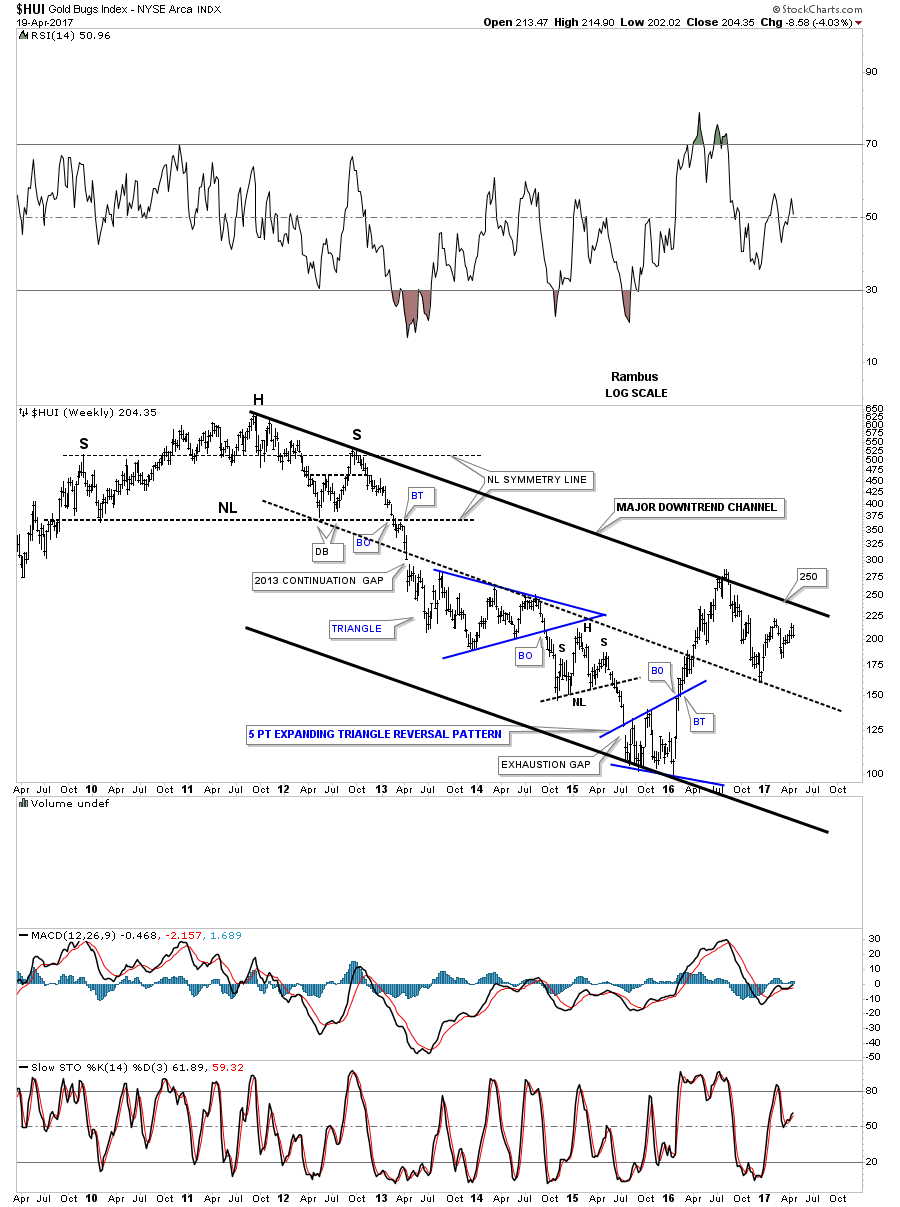
If the HUI is going to show some bullish price action the first thing it will need to do is trade above the top rail of its major bear market downtrend channel
The same can be said for the GDX.
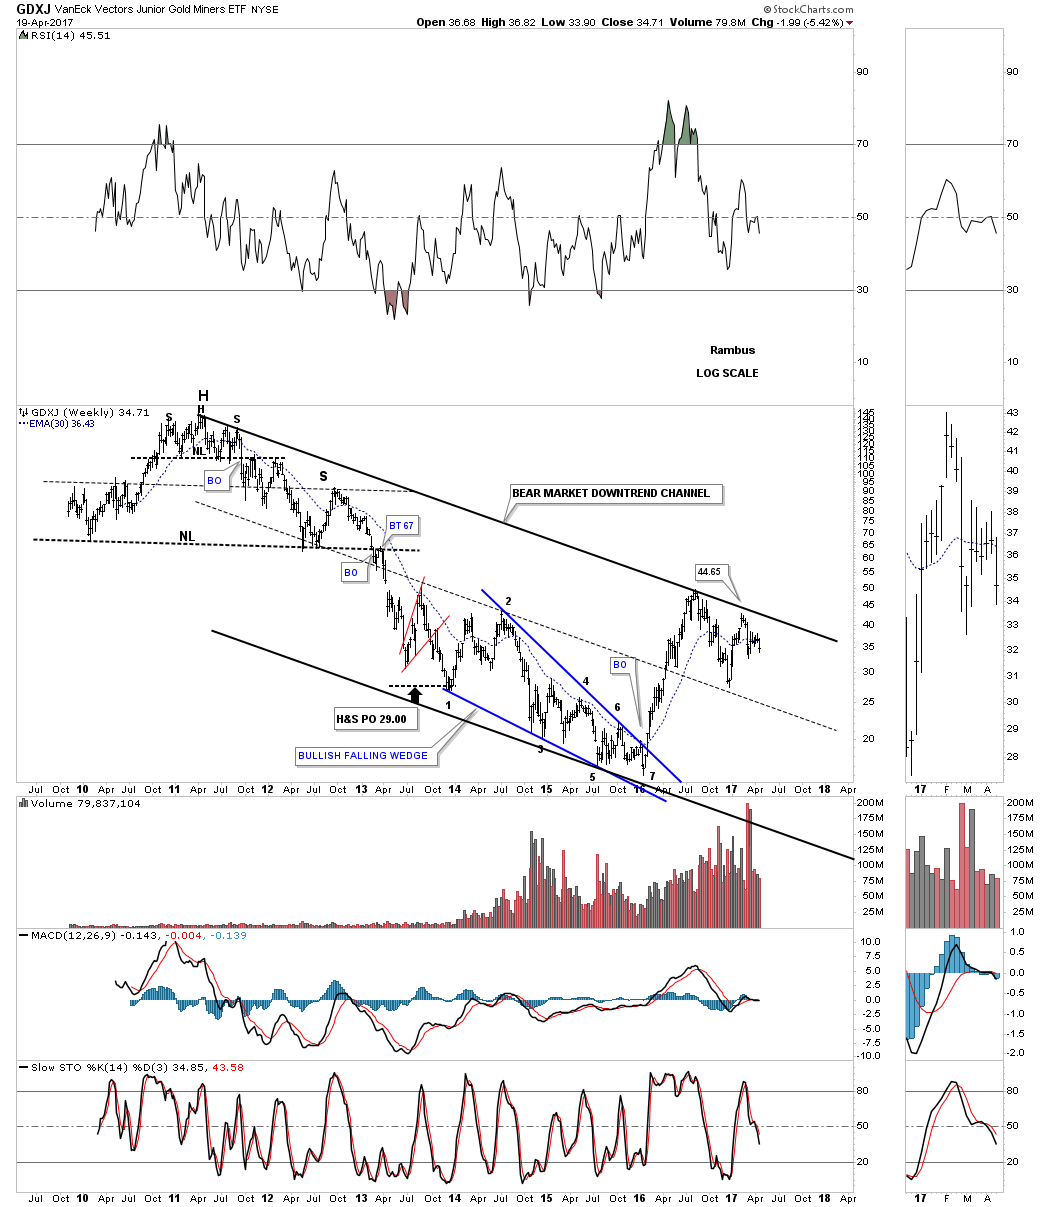
Below is the downtrend channel for the GDXJ.
This next chart is a ratio chart which compares the GDX to the SPX. When the ratio is falling GDX is under preforming the SPX. After another backtest to the neckline this week we could be seeing a potential triangle consolidation pattern building out.

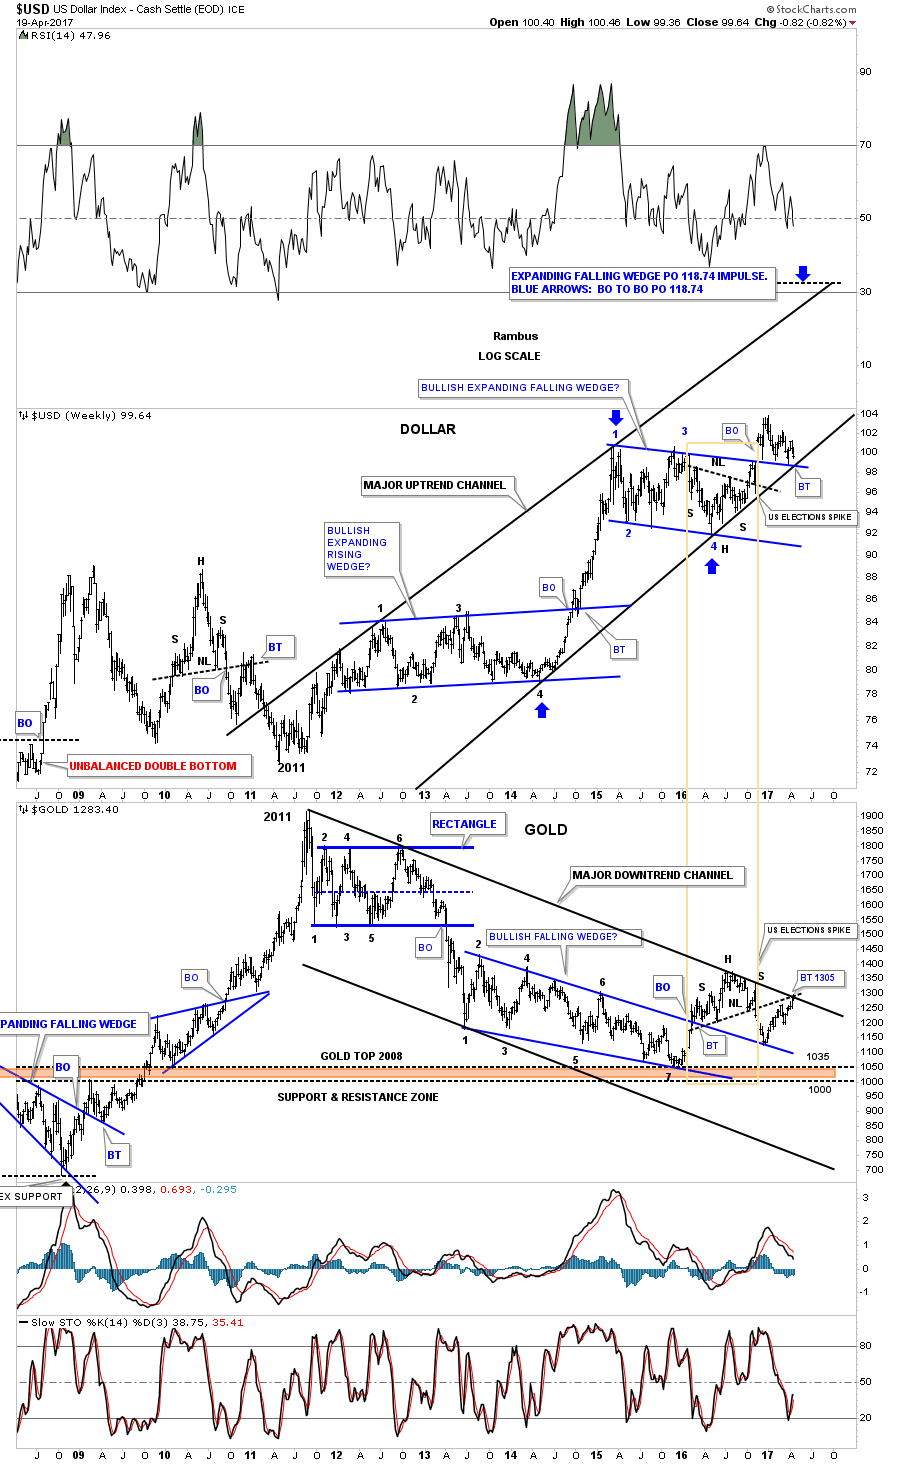
Lets look at one last chart for tonight which is a weekly combo chart which has the US dollar on top and gold on the bottom. The brown rectangle shows the H&S bottom on the US dollar and the H&S top on gold. Both are at important inflection points at their respective trend channels.
The charts above show a game plan that will need to be followed. As long as the game plan continues to play out having some patience will be important. That is much easier said than done. There are usually a couple of times a year when one can get the intermediate term trend right and ride it for all its worth. Hopefully we are on the brink of such a move. All the best…Rambus

The Peru Ministry of Energy and Mining just released their silver production data for February, and it was a whopper to the downside. Actually, I was quite surprised to see how much Peru’s silver production declined versus the same month last year. Also, Peru’s gold February production took a similar big hit.
According to the Peru Ministry of Energy and Mining data, the country’s silver production fell 12% to 323.1 metric tons (mt) this February versus 367.4 mt the same month last year:
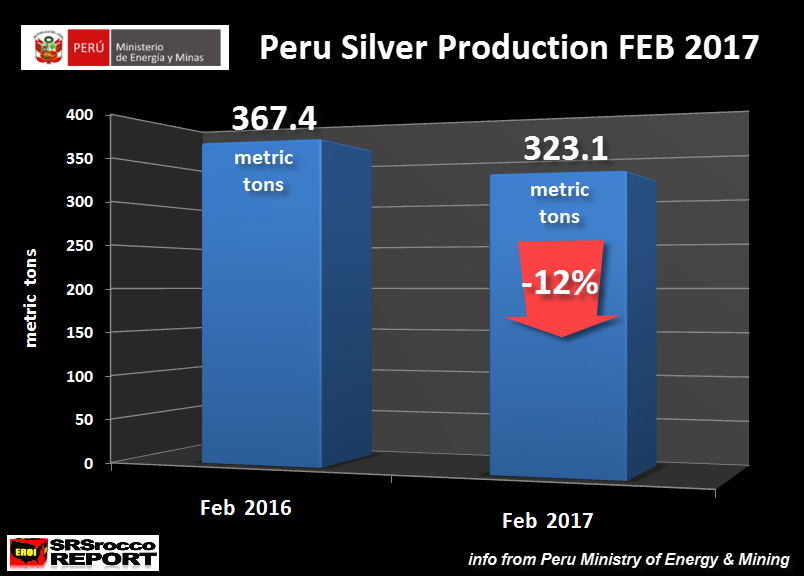
This is a 44 mt decline in one month, nearly 1.5 million oz lost. Here is the table from the Peru Ministry of Energy and Mining showing various metals production data for February:

Silver is shown as “PLATA” and as we see, overall silver production for JAN-FEB has declined 6.7% compared to the same period last year. Which means, Peru’s silver production took a much larger hit in February than in January. Furthermore, Peru’s gold production (shown as “ORO”), also declined significantly by falling 11.3% in February.
The Peru Ministry of Energy and Mining put out this brief explanation why their silver and gold production declined in February:
However, in this month precious metals slightly suffered a lower production volume gold decreased by -11.91%, while silver -11.29%. In the accumulated January, national production of these precious metals decreased by 6.81% for gold and 6.3% for silver.
In the national production of silver, the Lima region (127,157 kg fine), Ancash (126,816 kg fine) and Junín (116,473 kg fine) regions are in the top positions, associated with the polymetallic exploitation of the center of the country. Peru is the second largest silver producer in the world and boasts the largest proven and probable reserves of this precious metal in the world.
Antamina (101,824 kg Fine) in the Ancash region, followed by Uchucchacua (84,745 Kg. Finos) in Lima and Inmaculada (30,468 Kg Finos) in Ayacucho, among several others.
In the case of gold, the national production accumulated to February 2017, reached 23.8 tons fine. Its production was concentrated in the regions of La Libertad (6.4 tons) contributing the total production in 26.92%; Cajamarca cooperating with 23.32% (5.5 tons fine) and Arequipa (3.03 tons fine) contributing 12.74%. These regions accumulate 63% of the national gold production.
The decrease is explained by the lower results (-23.53%) of the main producer: Minera Yanacocha S.R.L. Whose operations in Cajamarca have been affected by an exhaustion of the reserves in the current deposits in operation.
I don’t know why the Peru Ministry of Energy and Mining’s data for gold and silver production declines are different in their explanation than what they show in the excel spreadsheets. However, it is only off by a small percentage. Regardless, the important part of the text above is highlighted in RED. The reason for the big decline of Peru’s gold production was due to “an exhaustion of reserves in the current deposits of operation.” This is a KEY FACTOR that will be played-out across the world as other mines lose production due to the same situation of reserve exhaustion.
We must remember, Peru is the second largest silver producer in the world, right behind Mexico. According to the Silver Institute’s 2016 Interim Report, Mexico’s silver production is estimated to decline to 183 Moz in 2016 (189 Moz in 2015), while Peru’s silver production increased to 141 Moz (136 Moz in 2015).
Global Future Silver Production At Risk
As the global markets finally succumb to the massive amount of debt, economic activity is going to plummet. This will have a negative impact on most energy, metals and commodity prices. Thus, production of base metals will decline significantly. This will impact the production of silver the most at the majority comes as a by-product of zinc, lead and copper production.
According to the World Silver Survey, 34% of silver production came as a by-product of zinc and lead, while 22% came as a by-product of copper production. Thus, 56% of global silver production is a result of copper, zinc and lead production:

Which means, more than half of the world’s future silver production is at risk when base metals prices take a big hit during the next economic crash. People need to realize that using a massive amount of leveraged debt to continue economic activity is not only UNWISE, it is seriously INSANE.
While there is no guarantee what the value of gold and silver will be in the future, LOGIC suggests investors holding onto most STOCKS, BONDS and REAL ESTATE will suffer the financial enema of their life. Again, this is all due to the disintegrating U.S. and global oil industry in the future.
So, PLACE YA BETS and let’s see who made the better investment decision when the global market finally cracks.
….also from the SRSrocco Report:
CONSPIRACY vs FACT: How Much Gold Is In The World??

“Double-click to enlarge what I believe is the greatest bull wedge chart pattern in the history of global markets.”
Apr 18, 2017
- After surging towards $1300, gold is taking a well-deserved short term rest. Can the rally continue?
- Geopolitics news has gotten most of the credit for this rally, but Indian dealers have been buying huge amounts of gold in preparation for the April 28 wedding season Akha Teej celebrations.
- Over the past two months, that’s where most of the demand has come from. Western analysts and investors often forget that Indian buyers follow Western news very closely. In fact, I would argue that India’s top gold traders are more in tune with gold-related news in the West than many Western analysts.
- For example, gold surged higher on the night Donald Trump was elected because Indians bought gold maniacally when they realized Trump was going to win.
- Their frenzied buying took gold to about $1340 that night. It continued until the Modi government stunned the buyers with a cash notes call-in.
- The latest surge in Indian dealer buying appears to have peaked last week, but there are more key events that sit dead ahead in the Western news pipeline.
- That could mean there will be no more than a short and sweet pause in both Indian and bank FOREX trader demand for gold.
- Please click here now. Double-click to enlarge this fabulous “Uptrend of Champions” gold chart.
- After pausing in mid-February as Chinese New Year buying peaked, gold carved out a nice inverse H&S bull continuation pattern, with a neckline in the $1270 area.
- Indian dealer “thunder buying” blasted gold over the neckline and towards the $1300 round number resistance area. It’s unknown whether gold will pull back to the $1260 – $1270 neckline area now. If it does, I’m a happy buyer of more gold, silver, and related stocks!
- Gamblers can also buy now rather than waiting for the pullback. It can be done with small size via call options and other gold gambling products.
- Please click here now. Double-click to enlarge what I believe is the greatest bull wedge chart pattern in the history of global markets. If there was ever a realistic opportunity for investors to “chase price” in the gold market, I’ll dare to suggest…. it is now!
- Incredibly, Akha Teej wedding day is April 28, and the next US debt ceiling deadline is also April 28! One powerful gold price driver is fading in importance, but only as another arrives! For all practical intents and purposes, the US Treasury can probably fund operations using bookkeeping tricks to keep spending at the ceiling limit until the fall.
- Congress is on holiday and it’s unlikely they will do anything other than pass an “extraordinary funding measures” bill to allow the debt ceiling can to (yet again) be kicked down the road.
- Institutional money managers are becoming more nervous about the lack of any real action plan to reduce the ceiling, and that will continue to be supportive for gold.
- Also, first round voting in the French election begins on April 23, just five days from now, and Iranian elections are in mid-May.
- Please click here now. Double-click to enlarge. The US dollar has finally arrived in my 107.50 target price area against the yen, hitting about 108.30 A rally in the “risk-on” dollar now though, is more likely to be accompanied by a US stock market rally than by a big decline in gold.
- Some gold stock enthusiasts are not aware that the GDXJ ETF is undergoing some portfolio rebalancing. The fund has reached regulatory limits in the amounts of shares it can hold in some companies. That’s causing some temporary selling in some well-known gold stocks, and buying in others.
- Investors need to ignore this short term noise. In the big picture, gold and silver stocks are performing well. Still, it will take more rate hikes to reverse US money velocity and generate the kind of inflation that causes these stocks to stage enormous outperformance against bullion. That scenario is coming, but it’s a few years into the future.
- Please click here now. Double-click to enlarge. After bursting up from a beautiful symmetrical triangle pattern, silver is consolidating like a champion above the demand line of the pattern.
- Gamblers and long term investors can both profit nicely from the upside implications of this pattern. Investors who own no silver now should use the current breakout and any pullback to make purchases.
- I always suggest owning physical bullion first, and then diversifying into other types of silver market investing once that has been accomplished.
- Please click here now. Double-click to enlarge. GDX has been pretty much unaffected by the GDXJ rebalancing, and is making a beeline towards the $25 – $26 area highs.
- I expect a breakout above that key price zone will be followed by a surge to $31 – $32 before there is a significant “price correction”. The bottom line: India demand was strong on US election night. It has been even stronger during the geopolitics-themed rally since mid-March. I expect that as Diwali buying begins in the fall, Western gold community investors will see Indian gold demand reach even greater heights, and that should indirectly produce a significant increase in the value of most of mining shares!
Thanks!
Cheers
st
Apr 18, 2017
Stewart Thomson
Graceland Updates
website: www.gracelandupdates.com
Stewart Thomson is a retired Merrill Lynch broker. Stewart writes the Graceland Updates daily between 4am-7am. They are sent out around 8am. The newsletter is attractively priced and the format is a unique numbered point form; giving clarity to each point and saving valuable reading time.
Risks, Disclaimers, Legal
Stewart Thomson is no longer an investment advisor. The information provided by Stewart and Graceland Updates is for general information purposes only. Before taking any action on any investment, it is imperative that you consult with multiple properly licensed, experienced and qualifed investment advisors and get numerous opinions before taking any action. Your minimum risk on any investment in the world is 100% loss of all your money. You may be taking or preparing to take leveraged positions in investments and not know it, exposing yourself to unlimited risks. This is highly concerning if you are an investor in any derivatives products. There is an approx $700 trillion OTC Derivatives Iceberg with a tiny portion written off officially. The bottom line:
Strengths
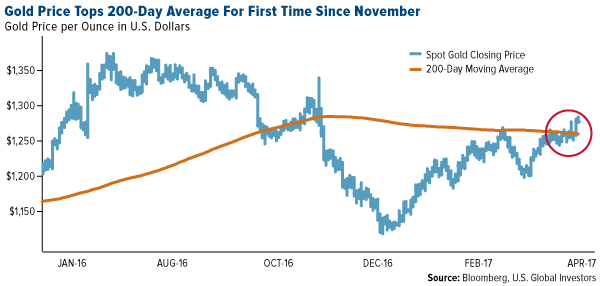
- The best performing precious metal for the holiday-shortened week was silver, up 3.01 percent, followed by gold, up 2.66 percent as geopolitical risks surrounding Syria and North Korea sparked demand for haven assets. Gold settled above its 200-day average for the first time since November, reports Bloomberg.
- Indian gold imports surged nearly seven-fold, or 582 percent, in March from a year earlier, reports Bloomberg. Jewelers stocked up on the yellow metal in anticipation of a demand recovery during the wedding season that began this month, with shipments advancing to 120.8 metric tons since last year, the article continues.
- The U.K. Royal Mint’s gold sales jumped 20 percent during the first quarter of the year, reports Bloomberg, following month-on-month declines in January and February. In volume terms, March sales jumped 263 percent, while gold sold and stored by the mint under its Signature Gold program—which allows partial ownership of bars held in its vault—jumped 178 percent in March.
Weaknesses
- The worst-performing precious metal for the week was palladium, down 0.85 percent. Hedge funds had boosted their net-long position in the futures market to a two-year high in the prior week just as a report came out the following week that U.S. auto sales slumped in March.
- The London Bullion Market Association (LBMA) PM gold price was set nearly $15 below spot on Tuesday, reports Kitco News, once again putting the market’s transparency in the spotlight. Jeff Christian, managing director at CPM Group, says he sees this as the effect of poorly conceived regulations and a faulty price discovery mechanism. Because banks and financial institutions are backing away from becoming market makers, Christian says this has resulted in a sharp reduction in liquidity during the auction process, creating a large discrepancy in prices. “There is something wrong with the process. You have a working spot market and then you have to stop that to then go over to this auction,” he added.
- Gold’s rally steadied earlier in the week on the back of U.S. jobs data that is consistent with the economy growing at 2 percent this year. “The U.S. jobs data was weaker than expected and these provided good support to gold until investors digested the data,” Brian Lan, managing director of GoldSilver Central, said over email. Other news comes from Centerra Gold this week, which reported a fatality at its Kumtor mine in the Kyrgyz Republic. According to Bloomberg, on April 11 a vehicle mechanic was fatally injured while inspecting a light vehicle pickup truck in the field.
Opportunities
- President Donald Trump had a few notable remarks this week, the first being that he will not brand China a currency manipulator, as he previously promised as part of his election platform. As for the second, he thinks the U.S. dollar is too strong, making the U.S. noncompetitive globally as other countries continue to devalue their currencies. Although the dollar dropped after these currency remarks, gold jumped around $8 on the news, potentially setting the backdrop for further gains.
- This week’s quote of the week comes from Secretary of State Rex Tillerson on the matter of chemical weapons in Syria: “The Russians are either complicit or incompetent.” Tillerson seems to have found his voice after enduring criticism of being silent and sidelined in the Trump administration. He traveled to Moscow to deliver his message of disappointment to Russia for its inability to deliver and oversee Syria’s supposed removal of chemical weapons. And just to make sure that anyone thought “59 and done” Tomahawk missiles launched into Syria was where the Trump administration was stopping, it was revealed on Thursday that the U.S. dropped the massive “Mother of all Bombs,” the largest non-nuclear bomb in the world, on suspected terrorist camps in Afghanistan.
- According to BMO Capital Markets, there will be a massive rebalance trade around the GDXJ ETF rebalances in June 2017, including significant demand for around 18 potential new additions, as well as a large selling of existing GDXJ names. There are some huge flows around these gold names, with an average daily trading volume of eight days of volume. The ETF will need to sell $3 billion worth of its existing holdings to buy the new additions, which will create a massive funding trade significantly impacting existing names. On this note, don’t think you can front run the front runners. The brokers, which are Authorized Participants to create the shares for the ETF, will spend the next eight weeks going short and long the expected index changes, largely excluding any outside parties from getting a piece of the trade. Speculators who show up to trade on the rebalance date likely won’t get the price they expect. So over the next eight weeks, we may see some market impact from the pre-rebalance of the index, but keep in mind the GDXJ ETF is about suppling beta to investors. They need the most liquid names to deal in, but this will be a great opportunity to pick up some small-capitalization, high-quality growth names that deliver alpha to investors.
Threats
- The threat of a government shutdown is looming. Government funding expires on April 28, reports Bloomberg, giving Congress five days to “unveil, debate and pass an enormous spending bill, or trigger a government shutdown.” Paul Brace, a congressional expert at Rice University, is even quoted as saying: “It was so much easier when all you had to do was oppose Obama.” There is an exception, the article continues, with a bipartisan group of lawmakers who have been quietly negotiating an omnibus spending bill that would fund the government through the end of the fiscal year on September 30. The border wall decision remains a wild card if it’s included in the budget.
- Although the bond market seems to be focused on what will happen once the Fed whittles down its investments in U.S. government bonds, perhaps more attention should be paid to an even bigger debt pile that could draw buyers away from Treasuries at just the wrong time, writes Bloomberg. “In overseas markets, more than $3 trillion of negative-yielding government bonds—which all but guarantee losses for buy-and-hold investors—have turned positive in recent months,” the article continues. Consequences for the U.S. bond market could be great, as foreigners who previously poured lots of money into higher-yielding Treasuries may be less inclined to do so now that they have “more viable fixed-income options at home.”
- Goldman Sachs maintains its overweight recommendation on commodities but sees a short-term decline for gold, reports Bloomberg. The bank sees the yellow metal falling to $1,200 an ounce in three months, on improvement in hard U.S. growth data and subsequent increases in real rates. Similarly, BMI Research says that the Fed’s rhetoric on balance sheet contraction, together with a stronger dollar, and declining credit growth and inflation expectations, are negative for gold.

-
I know Mike is a very solid investor and respect his opinions very much. So if he says pay attention to this or that - I will.
~ Dale G.
-
I've started managing my own investments so view Michael's site as a one-stop shop from which to get information and perspectives.
~ Dave E.
-
Michael offers easy reading, honest, common sense information that anyone can use in a practical manner.
~ der_al.
-
A sane voice in a scrambled investment world.
~ Ed R.
Inside Edge Pro Contributors

Greg Weldon

Josef Schachter

Tyler Bollhorn

Ryan Irvine

Paul Beattie

Martin Straith

Patrick Ceresna

Mark Leibovit

James Thorne

Victor Adair