
Gold & Precious Metals
Chris Vermeullen, one of the savviest market technicians around, is bullish about gold, but not too bullish this time. He’s seen this pattern many times before. Last week it broke the $1260 resistance point intra-day, only to retreat back before the close. Today, it’s over $1270, but will lose momentum once again? While the long term chart is bullish, he believes that gold will truly shine in the 2nd half of the year.
The stock market is due for a breather and this may very well be the time. Oil is poised to go higher. The VIX while shooting higher will pull back shortly and provide and excellent short. Much more here in this interview. Don’t be fooled by the headlines.


 With the gold and silver surging $20 and 40 cents respectively, today King World News is pleased to present an important update on the war in the gold market from Michael Oliver at MSA. Oliver allowed KWN exclusively to share this key report with our global audience.
Annual momentum turned positive in February 2016 (circled). The post-breakout surge halted at levels that didn’t mean anything to momentum.
…also from KingWorldNews:
We Are Seeing Historic Moves In The Gold Market

Several things happened on Friday and the markets reacted to them, so it’s not easy to interpret the final outcome. Was the reversal bearish or was the session bullish as gold didn’t decline substantially even though the USD rallied? Was gold’s reaction adequate, too small or too big?
Let’s start the discussion with a reminder of one of the reasons for Friday’s pre-market rally. In Friday’s Gold Trading Alert, we wrote the following:
The likely direct reason behind today’s overnight spike in the price of gold is a cruise missile strike at a Syrian airbase, most likely the one from which a deadly chemical weapons attack had been launched earlier this week. However, it’s not likely that 59 Tomahawk missiles was enough to ignite a rally alone. The strike had damaged ties between Washington and Moscow, as Russian spokesman Dmitry Peskov described the U.S. action as “aggression against a sovereign nation” on a “made-up pretext”.
We have already mentioned that news-based rallies are likely to be temporary – today let’s focus on the temporary impact that the above was likely to have – it was likely to boost prices of assets that are viewed as safe havens – gold and… the U.S. dollar. Both are being viewed as safe bets and thus it’s no wonder that we saw a temporary increase in prices of both assets. Consequently, the fact that gold didn’t decline is not a reflection of gold’s true strength vs. the US dollar and thus it shouldn’t be viewed as a bullish sign.
The important thing is that whereas the USD rallied further during the session, gold and silver reversed and erased (or more than erased in the case of silver) the entire daily rally before the end of the session. So, even though the initial safe-haven reaction was quite natural, it was also the case that the news-based rally was temporary – it didn’t even take one trading day for the move in precious metals to be reversed.
All in all, it appears that the reversals are the thing to keep in mind, while gold’s supposed strength vs. the USD is not. Let’s take a look at the gold chart (chart courtesy of http://stockcharts.com).
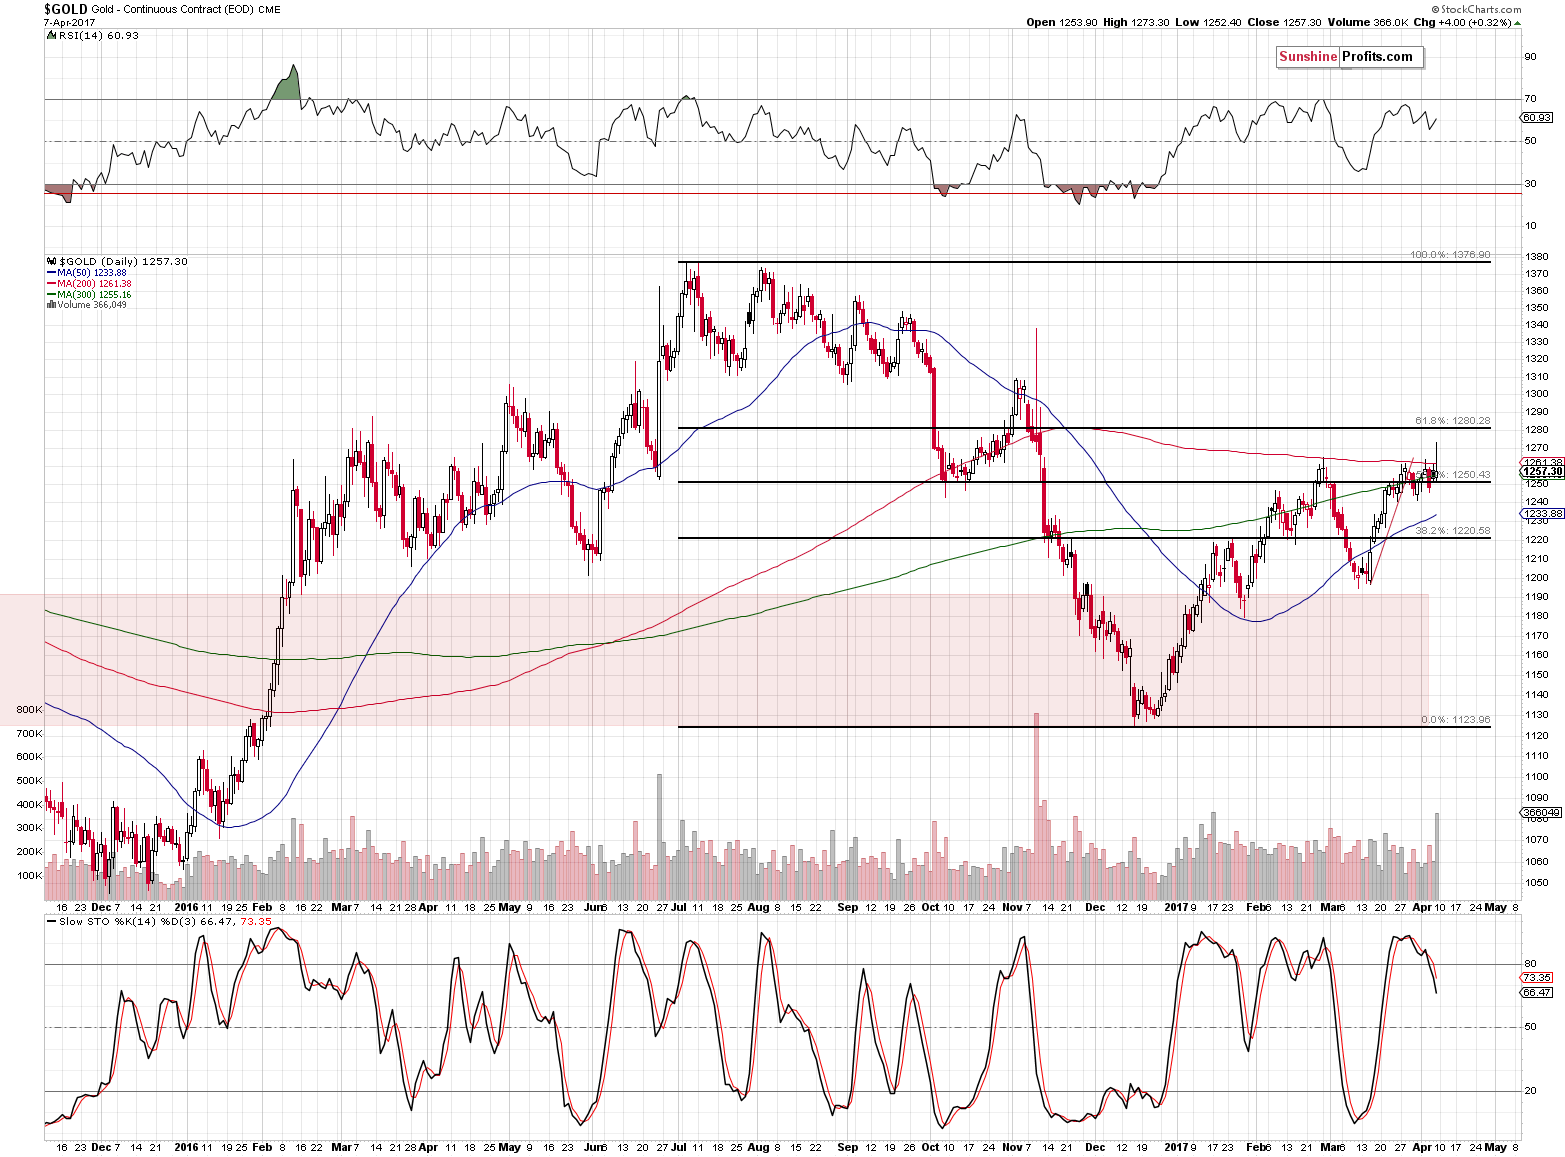
Gold’s reversal was not only sizable, it was also accompanied by huge volume – this is a classic, reliable reversal pattern. Needless to say, the implications are bearish. Moreover, please note that the sell signal from the Stochastic indicator remains in place.
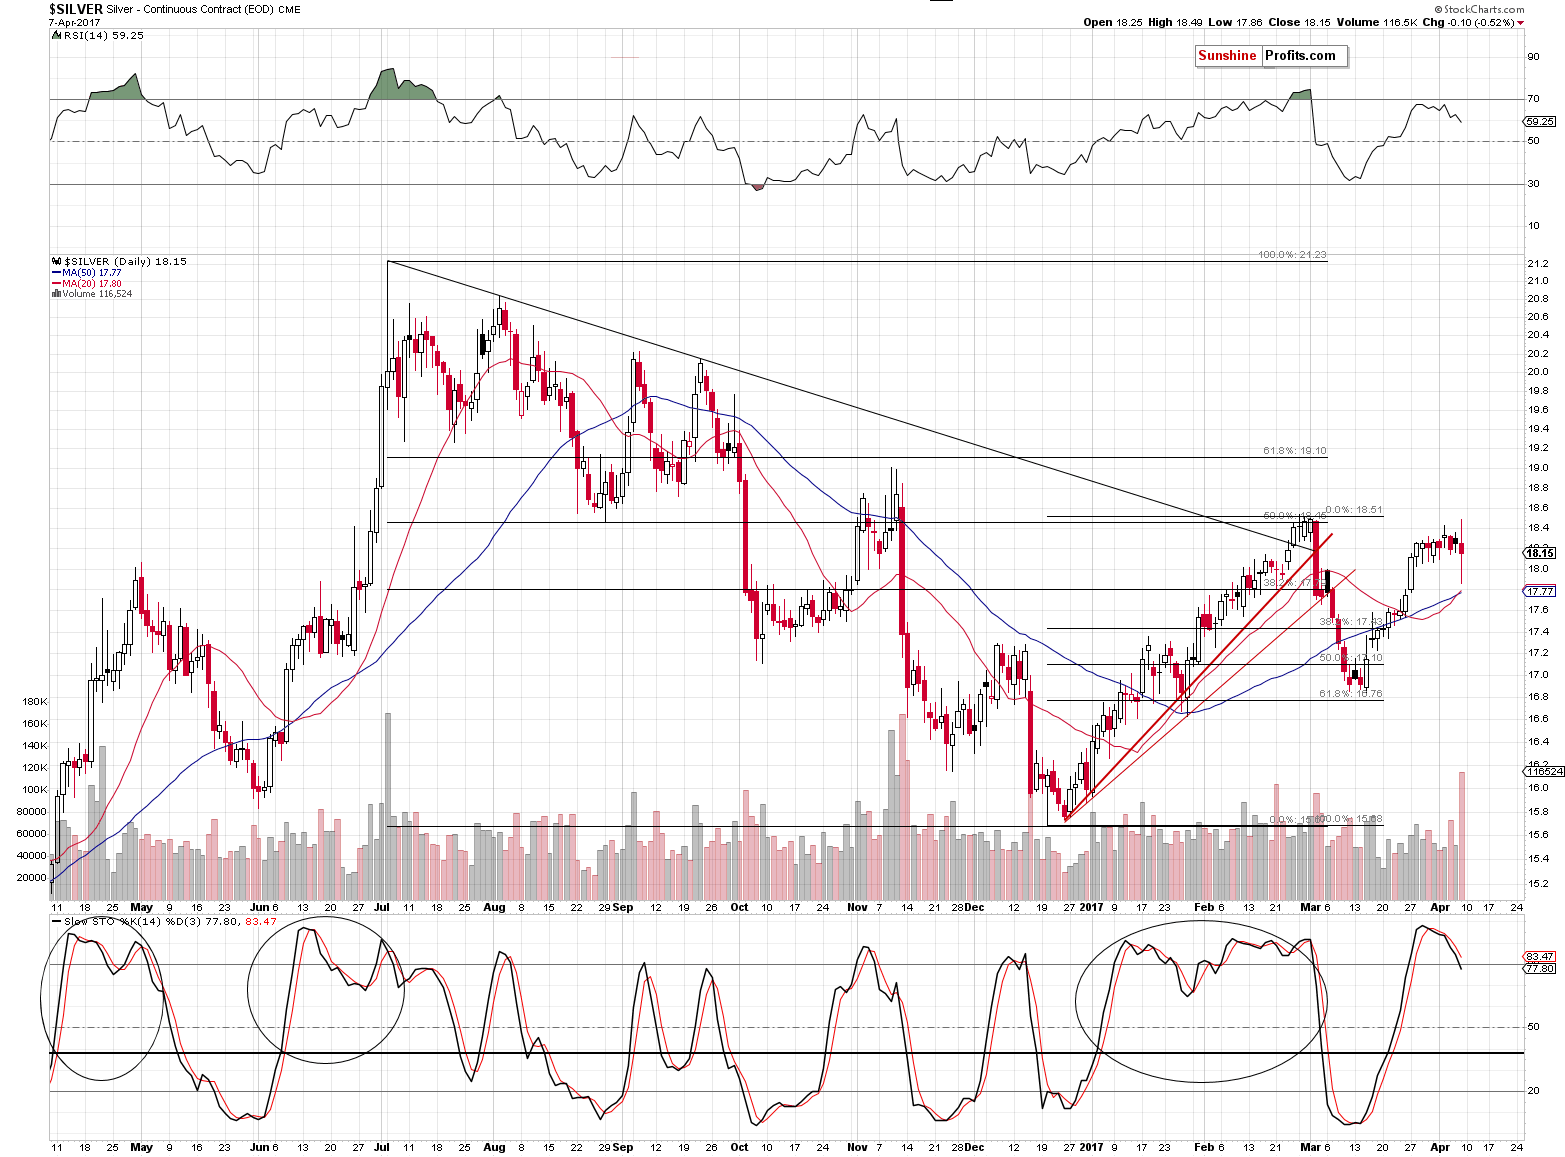
Not only is the reversal in gold significant by itself – it’s also confirmed by analogous action in silver. In fact, silver declined even more than gold (having closed below $18, which is not visible on the above chart) and it’s currently at $17.90. The implications are bearish.
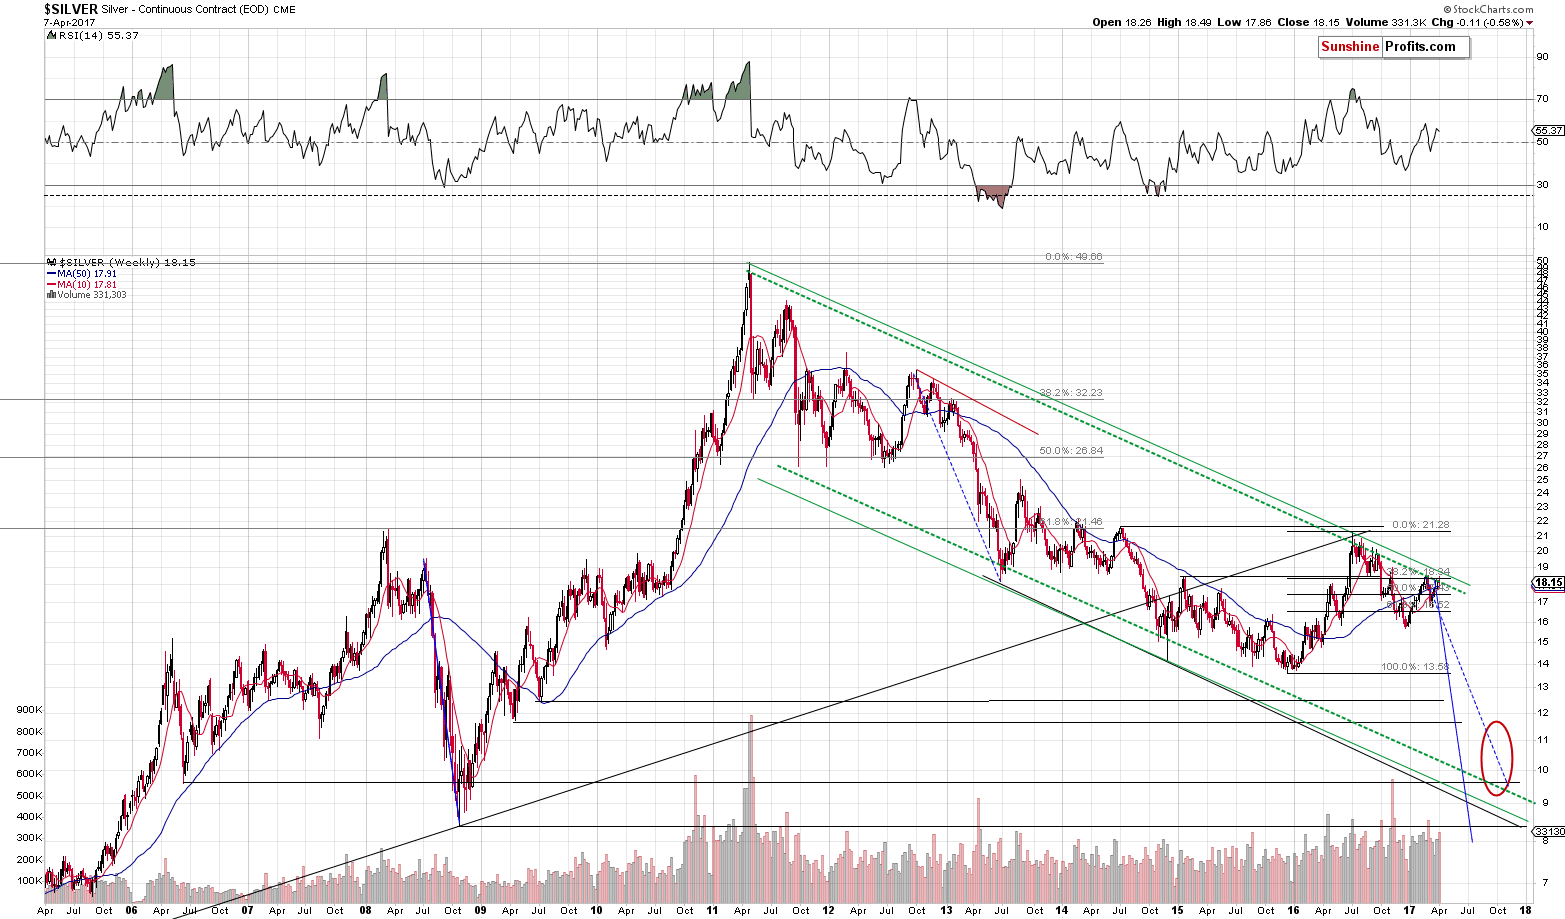
Last week, we wrote the following about the above long-term silver chart:
There are a few things that decide whether a resistance line is strong or not. The more important the tops that it’s based on, the more important the resistance line. The more tops create a given line, the more important the resistance is. Finally, for the line to be very important, the space between the tops that create it should be rather significant (for instance the red line based on 2 late-2012 tops didn’t result in anything in the following months and years).
Moreover, the way a given resistance line is likely to work is based on what created a given line. Therefore, a resistance line based on intra-day tops is likely to stop intra-day moves, a line based on daily closes is likely to stop the moves in terms of daily closing prices (so that the closing price doesn’t break the line even though intra-day moves might) and the line based on weekly closes is likely to stop the moves in terms of weekly closing prices (in analogy to daily closing prices).
After the rather lengthy introduction, let’s move to the point. Silver just moved to the line that is very important (green dashed line based on one extremely important top, one very important top and one less important top) and it did so in terms that were in tune with what the line was based on – silver closed the week at the line that was based on weekly closing prices.
The implications are naturally bearish for the following weeks and months as the above means that even if silver moves a bit higher temporarily, it’s unlikely to move higher substantially or for long. The above alone suggests that we are in the “pennies to the upside and dollars to the downside” territory without considering anything else (including the USD Index). The situation would be different if the silver had broken above this line and confirmed this breakout – but it didn’t, so the implications of moving to it are clearly bearish.
So, a reversal is very likely to occur shortly, if it didn’t occur on Friday.
Silver moved higher very temporarily, reversed before the end of the week and overall it declined last week. The mentioned long-term resistance line seems to have stopped the rally.
Summing up, Friday’s pre-market upswing in the precious metals sector appears to have been just a temporary news-based move that was already invalidated. The resulting reversals are very bearish developments especially that they were seen in both: gold and silver. Naturally, the above could change in the coming days and we’ll keep our subscribers informed, but that’s what appears likely based on the data that we have right now. If you enjoyed reading our analysis, we encourage you to subscribe to our daily Gold & Silver Trading Alerts.
Thank you.
Sincerely,
Przemyslaw Radomski, CFA
Founder, Editor-in-chief, Gold & Silver Fund Manager
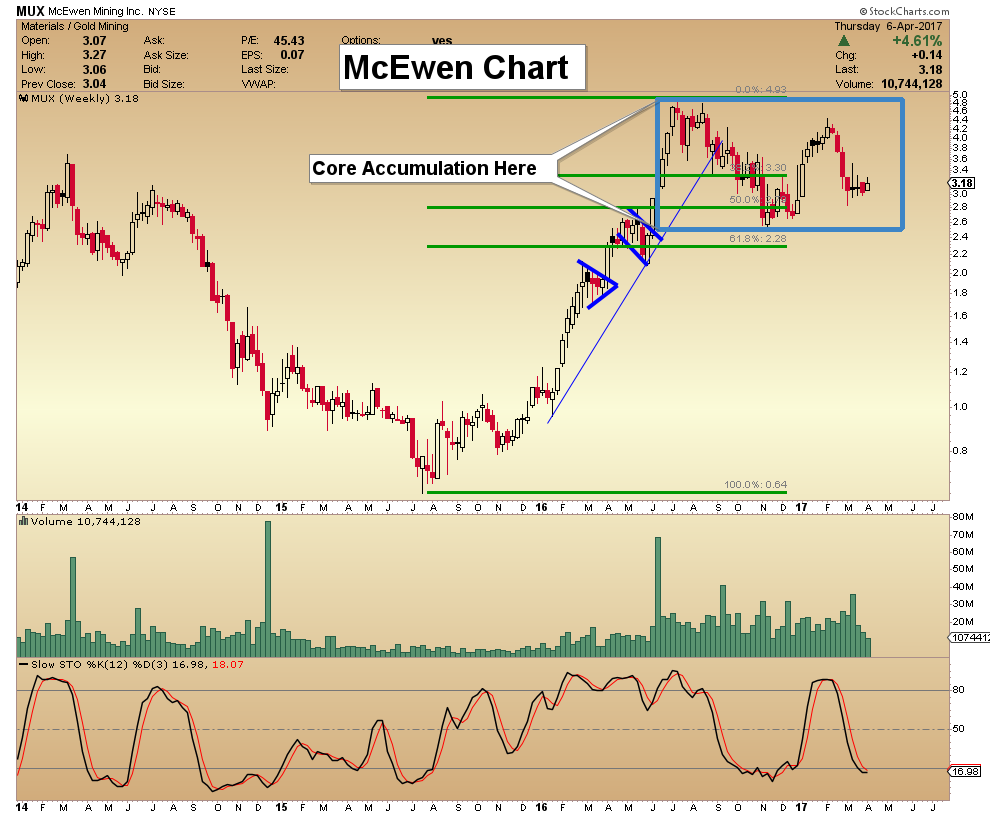
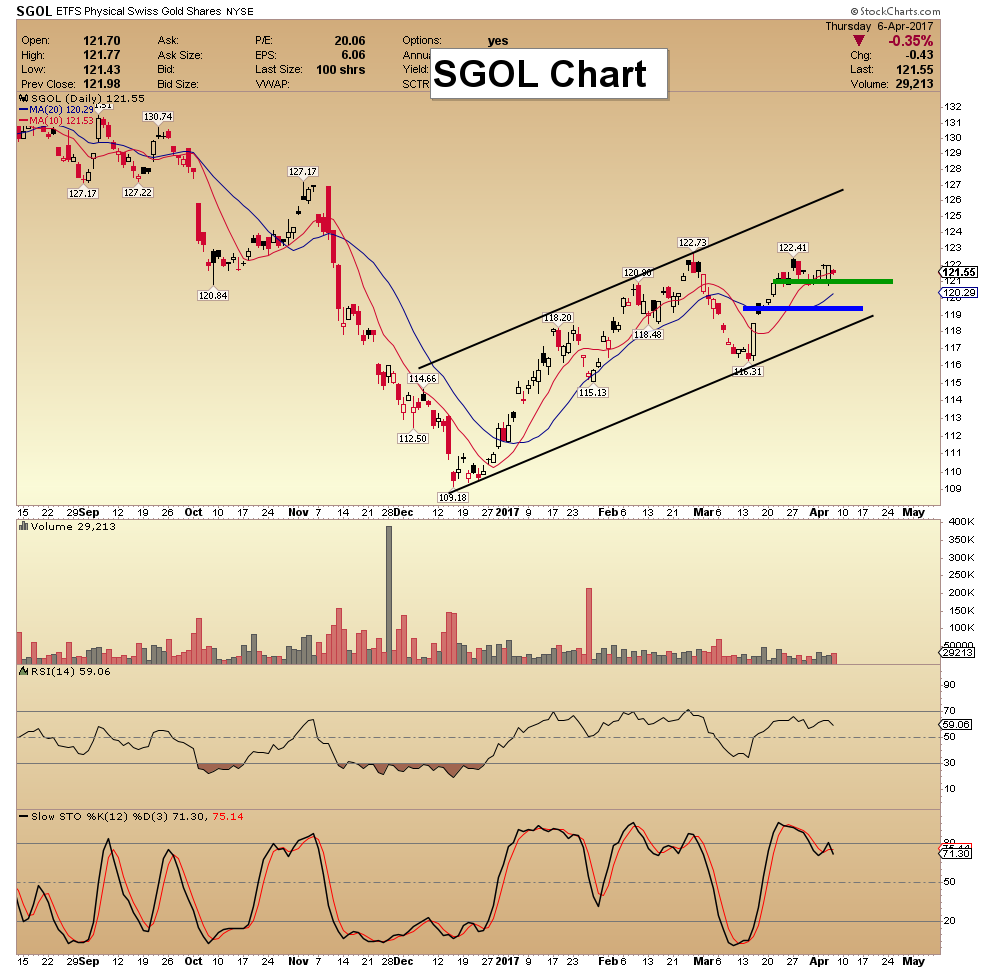
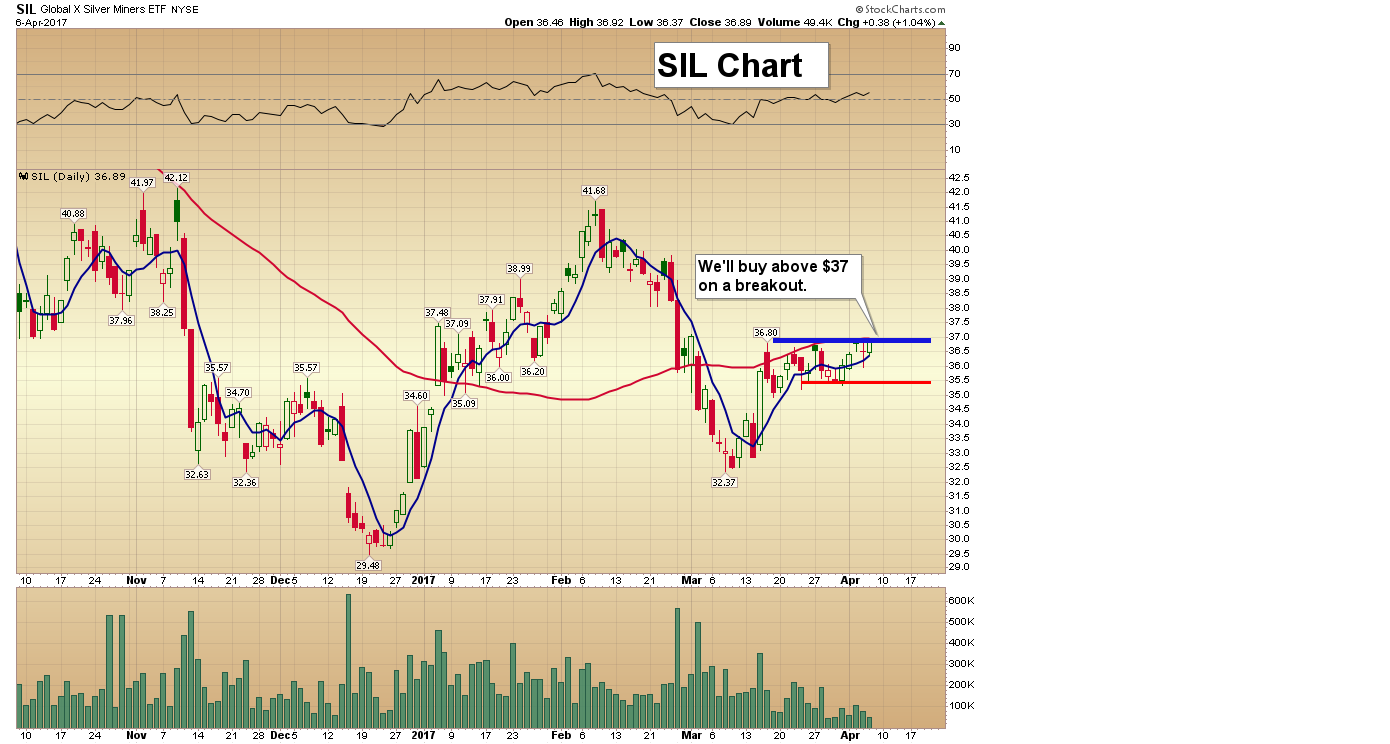
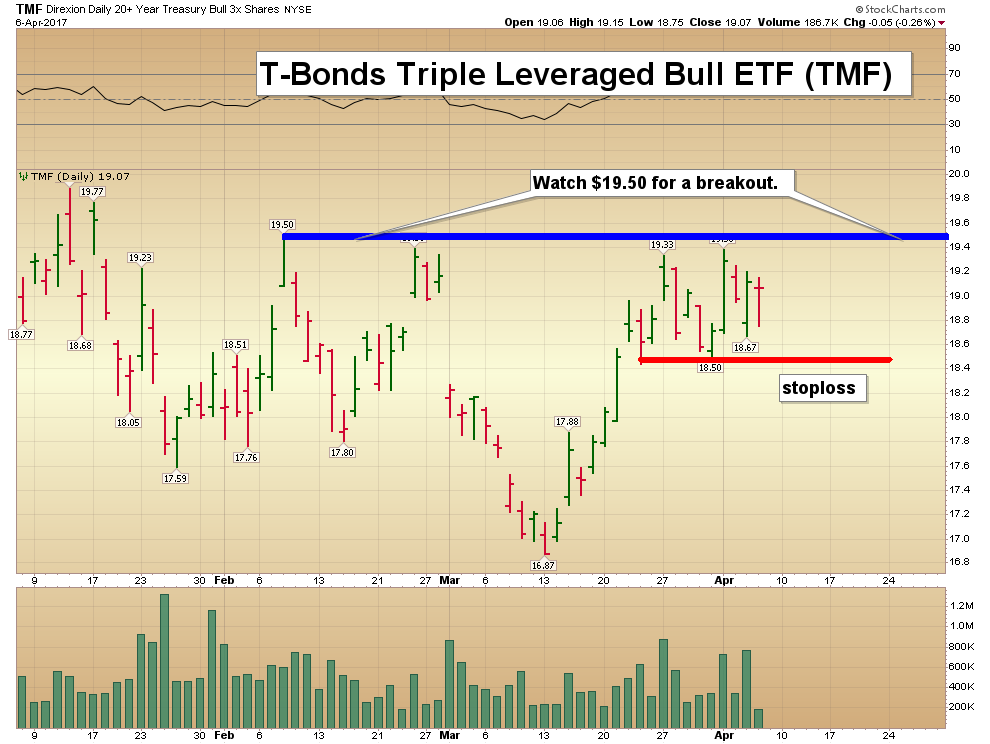
Today’s videos and charts (double click to enlarge):
SF Juniors Trading Charts & Video Analysis

SF Juniors Core Position Charts & Video Analysis


SFS Charts & Tactics Video Analysis


SF60 Charts & Tactics Video Analysis


SF Trader Time Charts Video Analysis


Morris
The SuperForce Proprietary SURGE index SIGNALS:
25 Surge Index Buy or 25 Surge Index Sell: Solid Power.
50 Surge Index Buy or 50 Surge Index Sell: Stronger Power.
75 Surge Index Buy or 75 Surge Index Sell: Maximum Power.
100 Surge Index Buy or 100 Surge Index Sell: “Over The Top” Power.
Stay alert for our surge signals, sent by email to subscribers, for both the daily charts on Super Force Signals at www.superforcesignals.com and for the 60 minute charts at www.superforce60.com
About Super Force Signals:
Our Surge Index Signals are created thru our proprietary blend of the highest quality technical analysis and many years of successful business building. We are two business owners with excellent synergy. We understand risk and reward. Our subscribers are generally successfully business owners, people like yourself with speculative funds, looking for serious management of your risk and reward in the market.
Frank Johnson: Executive Editor, Macro Risk Manager.
Morris Hubbartt: Chief Market Analyst, Trading Risk Specialist.
website: www.superforcesignals.com
email: trading@superforcesignals.com
email: trading@superforce60.com
SFS Web Services
1170 Bay Street, Suite #143
Toronto, Ontario, M5S 2B4
Canada

-
I know Mike is a very solid investor and respect his opinions very much. So if he says pay attention to this or that - I will.
~ Dale G.
-
I've started managing my own investments so view Michael's site as a one-stop shop from which to get information and perspectives.
~ Dave E.
-
Michael offers easy reading, honest, common sense information that anyone can use in a practical manner.
~ der_al.
-
A sane voice in a scrambled investment world.
~ Ed R.
Inside Edge Pro Contributors

Greg Weldon

Josef Schachter

Tyler Bollhorn

Ryan Irvine

Paul Beattie

Martin Straith

Patrick Ceresna

Mark Leibovit

James Thorne

Victor Adair