
Gold & Precious Metals

In case you haven’t already noticed, inflation has been steadily creeping up since July. In February, the most recent month of available data, consumer prices advanced at their fastest pace in five years, hitting 2.7 percent year-over-year. March data won’t be released until next week, but I expect prices to proceed on this upward trend, buttressed by rising mortgages and costs associated with health care and energy.
One of the consequences of strong inflation is that real rates—what you get when you subtract the current consumer price index (CPI) from the nominal rate—have turned negative. And when this happens, gold has typically been a beneficiary. This is the Fear Trade in action.
Take a look below. Gold shares an inverse relationship with the real 10-year Treasury yield, which is influenced by consumer prices. When inflation is soft and the yield goes up, gold contracts. But when inflation is strong, as it is now, it can push the Treasury yield into subzero territory, prompting many investors to move into other so-called safe haven assets, including gold.

Again, I expect consumer prices to continue rising, especially if President Donald Trump gets his way regarding immigration and trade. Slowing the stream of cheap labor from Mexico and other Latin American countries, coupled with raising new tariffs at the border, should have the effect of making consumer goods and services more expensive. Although it might sting your pocketbook, faster inflation could be constructive for gold investors.
$1,475 an Ounce Gold this Year?
In its weekly precious metals report, London-based consultancy firm Metals Focus emphasized the importance of negative real rates on the price of gold, writing that “real and even nominal rates across several other key currencies, including the euro, should also remain negative for some time.” The European Central Bank’s deposit rate currently stands at negative 0.4 percent, not including inflation, and Sweden’s Riksbank, the world’s oldest central bank, will continue its negative interest rate policy as it awaits stronger economic growth. Meanwhile, the Bank of Japan left its short-term interest rate unchanged at negative 0.1 percent at its meeting last month.
This is all beneficial for gold. Discouraged by the idea of negative rates eating into their wealth, many savers might be compelled to invest in gold, which enjoys a reputation as an excellent store of capital.
Based on the near-term outlook for real rates, as well as uncertainty over Brexit, rising populism in Europe and Trump’s trade and foreign policies, Metals Focus analysts see gold testing $1,475 an ounce this year. If so, that would put the yellow metal at a four-year high.
Central Banks Still Have an Appetite for Gold
Since 2010, global central banks have been net buyers of gold as they move to diversify their reserves away from the U.S. dollar. Although 2016 purchases fell about 35 percent compared to 2015, they still remained high on a historical basis, thanks mostly to China and Russia.
These purchases are likely to continue this year, according to Metals Focus, though at a slower rate as many banks get closer to meeting their target reserves amount.

Because gold accounts for only 2.3 percent of China’s reserves, as of March, the Asian country might very well keep up with its monthly purchases for some time. (The U.S., by comparison, has nearly 75 percent of its reserves in gold.)
I’ve pointed out before that it’s reasonable for investors to pay attention to what central banks are doing. They’re diversifying their assets and, in a way, hedging against their very own policies. It would be prudent for every household to do the same. As such, I recommend a 10 percent weighting in gold, with 5 percent in bullion (coins and jewelry), the other 5 percent in quality gold stocks.
Frank Holmes
US Global Investors
Lipper Recognizes Our Gold Fund
I believe an exceptional way to get exposure to high-quality gold stocks is through our Gold and Precious Metals Fund (USERX), which invests in precious metals mining “seniors,” or those that generally have the largest market cap in the mining sector. The first no-load gold fund in the U.S., USERX seeks not just capital appreciation but also protection against monetary instability and the very inflation I discussed earlier.
I’m very pleased to tell you that the fund was recently recognized by Thomson Reuters Lipper. In a New York City ceremony in March, the mutual fund data provider awarded USERX with two Fund Awards for 2017 in the Precious Metals Equity Funds category for the three- and five-year periods.
In January, the Gold and Precious Metals Fund was also awarded a 5-Star Overall Rating by respected investment ranking and analysis firm Morningstar, as of December 31, 2016. The fund was rated among 71 Equity Precious Metals funds, based on risk adjusted returns.
USERX is co-managed by myself and precious metals expert Ralph Aldis. The two of us were honored with the Mining Journal’s Best Americas Based Fund Manager award for 2016.
I invite you to visit the fund page for the Gold and Precious Metals Fund (USERX) to explore its holdings and performance!
Please consider carefully a fund’s investment objectives, risks, charges and expenses. For this and other important information, obtain a fund prospectus by visiting www.usfunds.com or by calling 1-800-US-FUNDS (1-800-873-8637). Read it carefully before investing. Foreside Fund Services, LLC, Distributor. U.S. Global Investors is the investment adviser.
Past performance does not guarantee future results. A high ranking does not necessarily mean that a fund had a positive return over the ranking period. See current performance for the Gold and Precious Metals Fund here.
Gold, precious metals, and precious minerals funds may be susceptible to adverse economic, political or regulatory developments due to concentrating in a single theme. The prices of gold, precious metals, and precious minerals are subject to substantial price fluctuations over short periods of time and may be affected by unpredicted international monetary and political policies. We suggest investing no more than 5% to 10% of your portfolio in these sectors.
Morningstar ratings for the Gold and Precious Metals Fund (USERX), in the Equity Precious Metals fund category: USERX was rated 5 Stars Overall out of 71 funds, 5 Stars out of 71 funds for the three-year period, 5 Stars out of 64 funds for the five-year period, and 4 Stars out of 46 funds for the 10-year period, as of December 31, 2016.
The Morningstar Rating™ for funds, or “star rating”, is calculated for managed products (including mutual funds, variable annuity and variable life subaccounts, exchange-traded funds, closed-end funds, and separate accounts) with at least a three-year history. Exchange-traded funds and open-ended mutual funds are considered a single population for comparative purposes. It is calculated based on a Morningstar Risk-Adjusted Return measure that accounts for variation in a managed product’s monthly excess performance, placing more emphasis on downward variations and rewarding consistent performance. The top 10% of products in each product category receive 5 stars, the next 22.5% receive 4 stars, the next 35% receive 3 stars, the next 22.5% receive 2 stars, and the bottom 10% receive 1 star. The Overall Morningstar Rating for a managed product is derived from a weighted average of the performance figures associated with its three-, five-, and 10-year (if applicable) Morningstar Rating metrics. The weights are: 100% three-year rating for 36-59 months of total returns, 60% five-year rating/40% three-year rating for 60-119 months of total returns, and 50% 10-year rating/30% five-year rating/20% three-year rating for 120 or more months of total returns. While the 10-year overall star rating formula seems to give the most weight to the 10-year period, the most recent three-year period actually has the greatest impact because it is included in all three rating periods.
Lipper named the Gold and Precious Metals Fund the Best Precious Metals Equity Fund, out of 62 funds, for the three-year period ending 11/30/2016. The fund was also recognized as Best Precious Metals Equity Fund, out of 58 funds, for the five-year period ending 11/30/2016. The award was earned for the fund’s consistent performance over the three-year and five-year periods ending 11/30/16.The award selection process began with Lipper calculating a Consistent Return score for each fund for the three-year and five-year time periods as of 11/30/16. Consistent Return is a quantitative metric that incorporates two characteristics: risk-adjusted return, and the strength of the fund’s performance trend. The top-scoring Consistent Return fund within each classification received the awards.
Although Lipper makes reasonable efforts to ensure the accuracy and reliability of the data contained herein, the accuracy is not guaranteed by Lipper. Users acknowledge that they have not relied upon any warranty, condition, guarantee, or representation made by Lipper. Any use of the data for analyzing, managing, or trading financial instruments is at the user’s own risk. This is not an offer to buy or sell securities.
The Mining Journal’s Best Americas Based Fund Manager award is among the publication’s annual Outstanding Achievement Awards and was decided based on metrics provided by Morningstar. The Mining Journal, based in London, is a leading publication for the global mining industry.
The consumer price index (CPI) is one of the most widely recognized price measures for tracking the price of a market basket of goods and services purchased by individuals. The weights of components are based on consumer spending patterns.
All opinions expressed and data provided are subject to change without notice. Some of these opinions may not be appropriate to every investor.

How do you depress the physical gold price? It’s quite easy… you throw $10 trillion paper dollars at it. Not only did global paper gold trading amount reach a new record in 2016, it surpassed the previous year’s total by nearly 50%.
This is simply amazing when we look around at the staggering amount of insanity taking place in the financial markets. With the economic and financial markets sitting at the edge of the cliff, it would seem prudent for investors to curtail their highly leverage bets in the “Paper Gold Casino” and buckle down by purchasing real physical metal.
Unfortunately, the Mainstream media and the Financial networks have totally lobotomized investors by removing the following vocabulary from the mushy substance between their ears….. Wisdom, Prudent, Long-term, Safe-haven and Gold-Silver.
With the advent of twitter, wisdom today comes down to reading no more than ONE SENTENCE. Anything longer than that is a complete waste of time when it is better spent sitting in front of six computer monitors trading digits. Forget about investing one’s money to build up a real company, when it is more stimulating to try and SCALP tiny profits by trading stocks all day fueled by a half dozen monster energy drinks.
This is called progress…… a giant leap forward for mankind and technology.
Global Gold Exchange Notional Trading Amount Hit New $10 Trillion Record In 2016
According to GFMS newly released 2017 Gold Survey, total global exchange notional trading amount reached $9.8 trillion in 2016. This was up 46% from $6.7 trillion in 2015. These figures were based on the total amount of “volume in nominal tonne equivalent” traded on nine exchanges. For example, here are the top four exchanges annual gold traded quoted by GFMS:
- COMEX = 179,047 tonnes
- SHFE = 34,760 tonnes
- SGE = 11,793 tonnes
- TOCOM = 8,541 tonnes
The total amount of paper gold traded on the nine exchanges in 2016 equaled 243,000 metric tons versus 180,000 metric tons the previous year. I took these values and multiplied them by the average annual gold price to arrive at the figures below. I also compared these figures to the total amount of physical gold retail investment for each year (source GFMS 2017 Gold Survey):
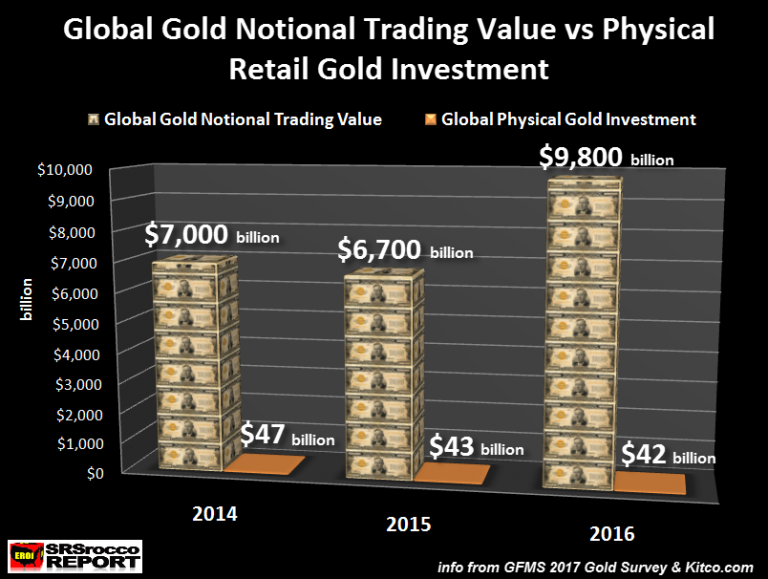
As we can see, the global exchanges traded a stunning $9.8 trillion worth of paper gold last year versus $42 billion in physical gold investment. This turns out to be 233 times the amount of paper gold traded for each ounce of physical gold purchased.
With this sort of trading volume, the Monster Energy Drink Stock (ticker MNST) looks like an excellent investment opportunity. And why shouldn’t it be? The Monster Energy Drink stock price has surged nearly 10 times from $5 in 2009 to $46 currently. While this may seem like a good stock to invest in, I am waiting until they sell Monster Energy IV’s that you just stick in your arm so you can continue trading without wasting waste time knocking down 5-6 individual cans.
We must remember… TIME IS MONEY.
So, the question is this…. what would happen to the physical gold market if a small percentage of the Monster Energy Drink traders purchased physical gold instead of the millions of contracts traded on the exchanges. According to GFMS, total gold trading volume just on the COMEX last year was a stunning 58 million contracts.
Annual Global Gold Exchange Trading Volume Also Reached New Record Of 7.8 Billion Oz
Furthermore, if we look at the total amount of paper gold traded on the nine exchanges in 2016, it also reached a new record 7.8 billion oz:

Not only was the 2016 total 7.8 billion oz paper gold trading volume 34% higher than in 2015, it was 76 times higher than the 103 million oz of world gold mine supply. I decided to add the paper gold trading volume during the 1970’s when the gold futures markets began. During the first year of gold futures trading in 1975, a total of 84 million oz (Moz) were traded. However, by the end of the decade and as the gold price shot up towards $850, total paper gold trading surpassed one billion oz in 1979.
Again, what would have been the reaction to the physical gold market if investors purchased more physical gold in 1979, than the one billion ounces of paper contracts?? Well, I will tell you what I think from some wisdom from Jim Rickards. I listened to Jim Rickards interview with Greg Hunter today and he had some very interesting things to say. One of Rickards interesting tidbits was that Americans own about one ounce of gold each versus the typical poor Indian farmer who has acquired kilos of gold.
So….. when the FAN FINALLY HITS THE COW EXCREMENT, the wealth of the world will move from WEST to EAST as Americans are forced to pawn off the remainder of their gold jewelry for much needed MONSTER ENERGY DRINKS.
GOD HATH A SENSE OF HUMOR.
Check back for new articles and updates at the SRSrocco Report.

Precious metals closed the first quarter with solid gains. Gold gained almost 9% while Silver gained 14%. The miners (GDX and GDXJ) gained the same amounts (9% and 14%) but unlike the metals which closed at their highs of the quarter, ended up losing more than half their gains. Despite a strong quarter, the entire complex remains below the February highs and 200-day moving average (ex Silver) just days after the US Dollar index rebounded strongly from its own 200-day moving average. As the second quarter begins, the warning signs for precious metals are mounting.
It is never a good sign when Gold is the strongest part of the sector and especially while the sector trades below key moving averages. While Silver rests above its 200-day moving average and has recently outperformed Gold on a percentage basis, unlike Gold it has yet to reach its late February highs around $18.50. So in that respect Silver has lagged Gold. Meanwhile, the miners have not even come close to returning to their 200-day moving averages or February highs. They first reached their 200-day moving averages ahead of the metals and also began their correction first.
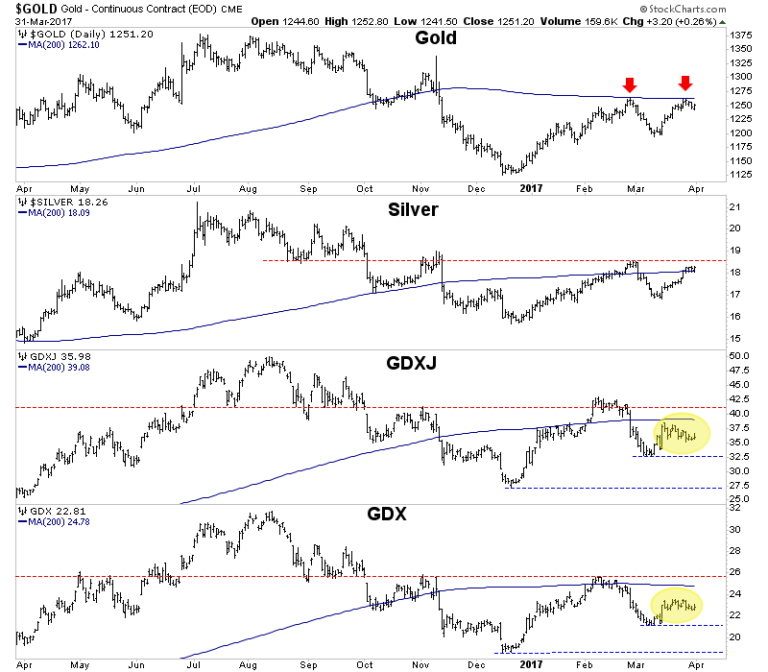
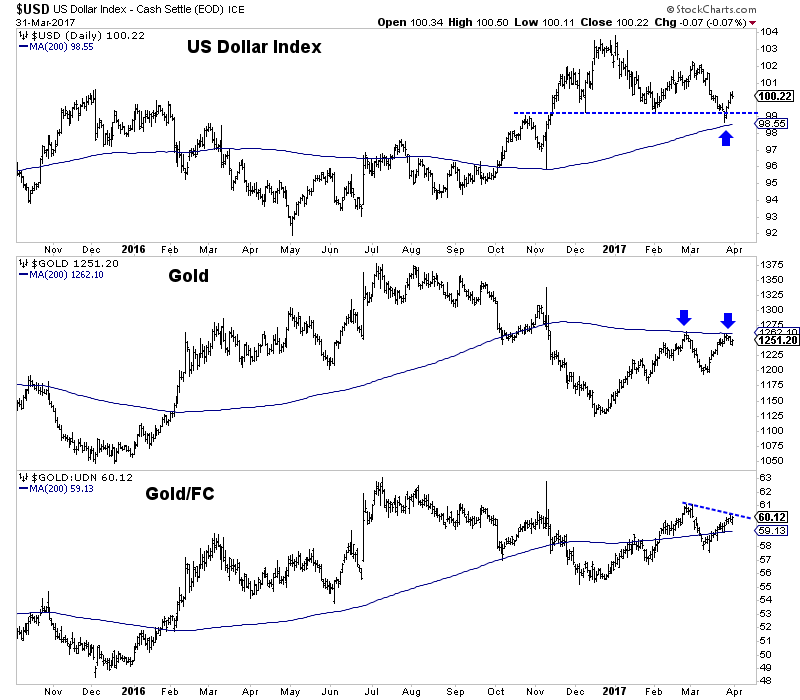
Gold is the strongest part of the sector but we see evidence it could weaken during the start of the second quarter. Gold has already failed twice at its 200-day moving average and now it must contend with a rebound in the US Dollar index. Last week the greenback enjoyed a strong rebound off its rising 200-day moving average. Furthermore, note that since December the greenback retraced only 38% of its advance from 92 to nearly 104. The strongest trends will retrace usually 38% or 50% of previous gains. Finally, while Gold against foreign currencies (Gold/FC) is quite strong from a bird’s eye view, it is currently showing a negative divergence to Gold as it is below its late February high. If Gold/FC is weaker than Gold it means that Gold is more vulnerable than usual to a rising US Dollar.
As the second quarter begins, there are critical warning signs for precious metals. The miners typically lead the metals and their recent failure to return to their 200-day moving averages and February highs is a bad omen for the metals. In addition, last week we covered the GDX advance decline line which is so weak it couldn’t even come close to its 50-day moving average. Meanwhile, the US Dollar’s strong rebound off its 200-day moving average will provide additional resistance to Gold. Given that Gold is currently the strongest part of the sector, that is not good for the entire sector. We expected 2017 to be a grind. Be patient and if precious metals turn lower, wait to buy bargains amid oversold conditions. We continue to look for high quality juniors that we can buy on weakness and hold into 2018. For professional guidance in riding this new bull market, consider learning more about our premium service including our current favorite junior miners.
Jordan Roy-Byrne, CMT, MFTA
The following article is arranged in Question and Answer (Q & A) format. Through the Q & A approach, this article raises some important issues about price discovery in the gold markets and aims to explain the view that the gold price is being set by the paper gold markets.
BullionStar’s CEO Torgny Persson and precious metals analyst Ronan Manly are of the opinion that due to the structure of contemporary gold markets, it is primarily trading activity in the paper gold markets which sets the international price of gold.
Question: The international gold price is constantly quoted in the financial media alongside other major financial indicators. What is this international gold price, and how is it defined?
The international gold price usually refers to the price of gold quoted in US Dollars per troy ounce as traded on the 24-hour global wholesale gold market (XAU/USD). Gold is traded non-stop globally during the entire business week, creating a continuum of international gold price quotes from Sunday evening New York time all the way through to Friday evening New York time. Depending on the context, this international gold price sometimes refers to a spot gold market quote, such as spot gold traded in London, and at other times may refer to the front month of a gold futures contract price as traded on the US Commodity Exchange (COMEX). The front month contract is a nearby month which will usually exhibit the highest trading volume and activity.
The international gold price can also at times be referring to the LBMA Gold Price benchmark price as derived during the London daily gold price auctions (morning and afternoon auctions). LBMA is an abbreviation for London Bullion Market Association.
Therefore, this ‘international price’ could be referencing a spot gold price, a futures gold price, or a benchmark gold price, but all three would, at a comparable time, be roughly similar in magnitude.
Question: Where does this international gold price come from, where is it derived?
Recent empirical research has determined that gold price discovery is jointly driven by London Over-the-Counter (OTC) spot gold market trading and COMEX gold futures trading, and that the “international gold price” is derived from a combination of London OTC gold prices and COMEX gold futures prices. See “Who sets the price of gold? London or New York (2015)” by Hauptfleisch, Putniņš, and Lucey.
In general, the higher the trading volume and liquidity in a specific asset market, the more that market contributes to discovering prices for that asset. This is also true of the global gold market. Between them, the London OTC and New York trading venues account for the vast majority of global gold trading volume, and in 2015, the London OTC spot market represented approximately 78% of global gold market turnover while COMEX accounted for a further 8% (See Hauptfleisch, Putniņš, and Lucey (2015)).
Based on London gold clearing statistics for 2016, a quick calculation shows that total trading volume in the London OTC gold market is estimated to have been at least the equivalent of 1.5 million tonnes of gold in 2016, while trading volume of the 100 oz COMEX gold futures contract reached 57.5 million contracts during 2016, equivalent to 179,000 tonnes of gold. Gold trading volume on the London OTC gold market in 2016 was therefore about 8.4 times higher than trading volume in the COMEX 100 oz gold futures contract.
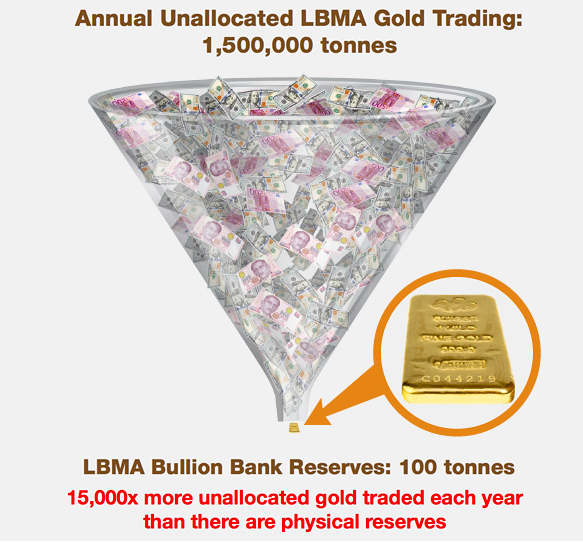
LBMA Unallocated Gold Trading, 1.5 million tonnes in 2016
However, COMEX has been found, by the above academic research, to have a larger influence on price discovery than London OTC, despite the lower trading volumes of COMEX. This is most likely due to a combination of factors such as COMEX’ accessibility and extended trading hours via use of the GLOBEX platform, the higher transparency of futures trading compared to OTC trading, and the lower transaction costs and ease of leverage in COMEX trading. In contrast, the London OTC gold market has limited trading hours (during London business hours), barriers to wider participation since it’s an opaque wholesale market without central clearing, and trading spreads which are dictated by a small number of LBMA bullion bank market-makers and a handful of London-based commodity brokerages.
The bottom line though is that both sets of trading statistics, London OTC and COMEX, are gigantic in comparison to the size of the underlying physical gold markets in London and New York.
Question: So, does the physical gold market or the paper gold market set this international price of gold?
The international gold price is purely set by paper gold markets, in other words it is set by non-physical gold markets. Based on their respective gold market structures, the London OTC gold market and COMEX are both paper gold markets. Supply of and demand for physical gold plays no role in setting the gold price in these markets. Physical gold transactions in all other gold markets just inherit the gold prices that are discovered in these paper gold markets.
The London OTC gold market predominantly involves the trading of synthetic unallocated gold, where trades are cash-settled and not physically delivered (i.e. no delivery of physical gold). These synthetic gold transactions have little connection to any underlying gold holding, hence they are de-facto gold derivative positions. By definition, unallocated gold positions are just a series of claims on bullion banks where the holder is an unsecured creditor of the bank, and the bank has a liability to that claim holder for an amount of gold. The holder, on its side, takes on credit risk towards the bullion bank. The London OTC gold market is therefore merely a venue for trading gold credits.
The London OTC gold market is also one in which the bullion banking participants employ fractional-reserve gold trading to create large amounts of paper gold out of thin air (analogous to commercial lending), where the trading is also leveraged and opaque, and where this paper gold is only fractionally backed by physical gold. This “gold” is essentially synthetic gold. See BullionStar Gold university article “Bullion banking Mechanics” for further details on fractional-reserve gold trading.
Since COMEX only trades exchange-based gold futures contracts, it is, by definition, a derivatives market. Cash-settlement is the norm. Only 1 in 2500 gold futures contracts traded on COMEX is delivered with a transfer of warrants representing metal. The rest of the contracts are cash-settled. This means that 99.96% of COMEX gold futures contracts are cash-settled. See BullionStar US Gold Market Infographic for details.
Given COMEX trading gold futures and London trading synthetic unallocated gold, both the London and COMEX gold markets essentially trade gold derivatives, or paper gold instruments, and by extension, the international gold price is being determined in these paper gold markets.
Beyond the London OTC gold market and COMEX, all other gold trading venues are predominantly price takers that take in and use the gold prices established by the paper gold markets in London and New York. These other markets include physical gold markets around the world which look to the international gold price as an input into their domestic gold price setting mechanisms and conventions.
Question: Explain a little more about the market structures of these London OTC and COMEX markets?
By definition, futures trading is trading of securities whose value is derived from an underlying asset but whose securities are distinct from those of the underlying asset, i.e. derivatives. COMEX gold futures contracts are derivatives on gold. COMEX registered gold stocks are relatively small, very little physical gold is ever delivered on COMEX, and even less physical gold is withdrawn from COMEX approved gold vaults. COMEX gold trading also employs significant leverage. Hauptfleisch, Putniņš, and Lucey (2015) state that “such trades [on COMEX] contribute disproportionately to price discovery”. Note that the COMEX gold futures market is actually a 24-hour market but its liquidity is highest during US trading hours.
Turning to the London OTC gold market, nearly the entire trading volume of the London OTC gold market represents trading in unallocated gold, which to reiterate, merely represents a claim by a position holder on a bullion bank for a certain amount of gold, a claim which is rarely exercised. London OTC gold trades also predominantly cash-settle. Traders, speculators and investors in unallocated gold positions virtually never take delivery of physical gold.
This is a fact confirmed by a UK HMRC / LBMA Memorandum of Understanding published in 2013 which states that in the London gold market “investors acquire an interest in the metals, although in most situations, physical delivery will not occur and in 95% of trades, trading in unallocated metals will be undertaken.” Additionally, in 2011, the then LBMA CEO Stuart Murray also confirmed that there were ‘very substantial amounts of unallocated gold’ held in London.
A 2015 legal opinion on unallocated gold drafted by respected global law firm Dentons describes unallocated gold as ‘synthetic’ gold and as a derivatives transaction.
Dentons states that “the reality of unallocated bullion trading is that buyers and sellers rarely intend for physical delivery to ever take place. Unallocated bullion is used as a means to have “synthetic” holdings of gold and so obtain exposure to the price of gold by reference to the London gold fixing.”
Although the LBMA does not publish gold trading volumes on a regular basis, it did publish a one-off gold trading survey covering Q1 2011 in which it was revealed that during the first quarter of 2011, 10.9 billion ozs of gold (340,000 tonnes) were traded in the London OTC gold market. During the same period, 1.18 billion ozs of gold (36,700 tonnes) were cleared in the London OTC gold market. This would suggest a trading turnover to clearing turnover ratio of 10:1. In the absence of live trading data from the London OTC gold market, this 10:1 proxy ratio can continue to be applied as a multiplier to the LBMA London Gold Market daily clearing statistics, which are published every month, and which are always phenomenally high.
For example, average daily clearing volumes in the London Gold Market during January 2017 totalled 20.5 million ounces. That’s the equivalent 638 tonnes of gold cleared per day in London. On a 10:1 trading to clearing multiple, that’s the equivalent of 6,380 tonnes of gold traded per day, or 1.6 million tonnes of gold traded per year.
Since there are only about 6,500 tonnes of gold stored in London, most of which represents static holdings of central banks, ETFs and other holders, the London OTC gold trading activities are totally disconnected from the underlying physical gold holdings. Furthermore, only about 190,000 tonnes of gold have ever been mined throughout history, half of which are estimated to be held in the form of jewellery. Therefore, the trading of nearly 6,500 tonnes of gold per day within the London OTC gold market has nothing to do with the physical gold market, yet perversely, this trading activity drives global gold price discovery and the pricing of physical bullion trades and transactions.
Revealingly, according to the LBMA bullion bankers who established the reporting of London gold clearing statistics, who specifically were the then LMPCL chairman, Peter Fava, and JP Morgan’s Peter Smith, these LBMA gold clearing statistics include trading activities such as “leveraged speculative forward bets on the gold price” and “investment fund spot price exposure via unallocated positions”, activities which are just side-bets on the gold price. See October 2003 article titled “Clearing the Air Discussing Trends and Influences on London Clearing Statistics“, from LBMA Alchemist Issue 32.
In essence, trading activity in the London gold market predominantly represents huge synthetic artificial gold supply, where paper gold trading is deriving the price of gold, not physical gold trading. Synthetic gold is just created out of thin air as a book-keeping entry and is executed as a cashflow transaction between the contracting parties. There is no purchase of physical gold in such a transaction, no marginal demand for gold. Synthetic paper gold therefore absorbs demand that would otherwise have flowed into the limited physical gold supply, and the gold price therefore fails to represent this demand because demand has been channelled away from physical gold transactions into synthetic gold.
Likewise, if an entity dumps gold futures contracts on the COMEX platform representing millions of ounces of gold, that entity does not need to have held any physical gold, but that transaction has an immediate effect on the international gold price. This has real world impact, because many physical gold transactions around the world take this international gold price as the basis of their transactions.
Although gold clearing volumes and the LBMA’s market survey provide some useful inputs into calculating London gold trading volumes, there is very little known publicly about how much physical gold actually trades in the London gold market. This is because the LBMA and its member banks choose not to reveal this information. There is no trade reporting in the London OTC gold market, no reporting of physical gold vault positions, no reporting of the unallocated gold liabilities of LBMA member bullion banks, and no reporting of how much physical gold in total these bullion banks retain to back up their fractional-reserve unallocated gold trading system. However, physical gold trading is by definition an extremely minuscule percentage of average daily trading volumes in the London OTC gold market. For details on the workings of the gold market in London, see BullionStar Infographic the “London Gold Market“.
While one of the three components that comprise the London gold clearing statistics is stated to be “physical transfers and shipments by LPMCL clearing members”, the LBMA doesn’t even see fit to publish a breakdown of these 3 components. This compounds the secrecy and is another example of where bullion banks and central banks keep the global gold market in the dark about how much gold is being physically transferred and shipped.
Question: How do local gold markets around the world use the international gold price?
Local gold markets all around the world look to the international gold price, and take in this gold price, usually quoting their local country gold prices in comparison to the international gold price.
In the physical gold market, product pricing of gold coins and bars is based on a combination of the spot gold price plus a premium. The premium is that part of the product price in excess of the value of the precious metal contained in the coin or bar. Given that the physical gold market is a price taker, physical gold market spot prices feed in from where the price is being discovered, i.e. the international gold price.
For example, the 2017 issue of the Royal Canadian Mint 1 troy ounce Gold Maple Leaf bullion coin is quoted on the BullionStar website at a US dollar price which reflects the US dollar spot price of gold plus a premium.

Gold coin and gold bar premiums are based on a number of factors. Part of the premium will reflect natural minting / refining costs such as fabrication, marketing, distribution and insurance costs. If the products have been distributed through a wholesaler, the premium will reflect a wholesaler mark-up. Another component of a premium is semi-variable and reflects physical market imbalances caused by supply and demand fluctuations. If demand for a gold coin or gold bar is high, its premium will increase. If supply of the product is abundant, the premium would tend to be lower than if in short supply.
In general, premiums on gold coins are higher than those on gold bars, while premiums on large gold coins and gold bars are lower than premiums on smaller gold coins and gold bars.
Question: What contribution does the Shanghai Gold Exchange make to gold price discovery and does the SGE, with its large physical trading, influence the international gold price?
The Shanghai Gold Exchange (SGE) is the world’s largest physical gold exchange and nearly all physical gold bars in China flow through the SGE. Gold trading volumes and gold withdrawal statistics for the SGE are certainly impressive. For the year 2016, total SGE gold trading volumes reached 24,338 tonnes, a 43% increase over the 2015 figure of 17,033 tonnes. SGE trading volumes include physical contracts, deferred contracts, OTC trades settled through the SGE, and also trading volumes on the Shanghai international Gold Exchange (SGEI). In 2016, physical gold withdrawals from the SGE totalled 1,970 tonnes, down 24% from 2015’s withdrawals of 2,596 tonnes, but still huge on an absolute basis because these withdrawals represent actual physical gold taken out of the SGE vaults.
By the end of 2016, the SGEI (International Bourse), which was launched in September 2014, had recorded cumulative trading of nearly 9,000 tonnes of gold. The Shanghai Gold Benchmark Price (a.k.a. Shanghai Gold Fix), which was launched on 19 April 2016, is a gold auction for 1 kilo gold bars of 99.99 purity quoted in RMB. Over the 8 months from launch to end of 2016, the Shanghai Gold Fix had traded 569 tonnes, which equates to over 1.5 tonnes per day on average.
All in all, the SGE has generated impressive physical gold trading volumes (24,338 tonnes for 2016) and withdrawals (1970 tonnes for 2016). For the sake of comparison, compare these annual SGE physical gold trading volumes to the bloated London OTC gold market where trading volumes of approximately the equivalent of 6,500 tonnes of gold per day are the norm. Such a comparison reveals the fractional-reserve nature of the London gold market and the fact that physical transactions can only be a minuscule fraction of the London market.
But does SGE trading affect the international gold price as derived in the London OTC and COMEX markets, or is the SGE a price taker?
The short answer is that the SGE does not influence the international price and the SGE is a price taker. There may be some lagged influence by the SGE on the international price but this would require further study. The Chinese gold market is still a closed gold market with market frictions and distortions. Gold can be imported into China but cannot in general be exported out of China. There is therefore no freedom of movement of gold out of China. Gold imports into China are strictly controlled via import licenses and these licenses are only issued to a small number of Chinese and foreign banks.
But it’s worth looking at SGE premiums to see if changes in SGE premiums ever provide any signalling ability for subsequent changes in the international gold price. SGE premiums arise when the Shanghai gold price trades above the international gold price. SGE premiums are a possible gauge to determine whether SGE trading affects the international gold price. In November and December 2016, SGE premiums rose sharply from less than 0.5% to over 3% which was a period in which gold imports into China surged. However, during that same period, the international gold price fell. So in this case, the expanding SGE premiums had no effect on the international gold price.
That example was just eyeballing, but a recent study by Metals Focus (MF) consultancy, titled “Links Between the Chinese and International Gold Prices” also found that the correlations between changes in the LBMA Gold Price (AM) and SGE premiums are not significant and were in some cases even found to be negative, which in summary means that SGE trading was not affecting the international gold price. MF also calculated some lagged correlations to see if SGE premiums influence subsequent changes in the LBMA Gold Price, due to, for example, “increased shipments of bullion to China over subsequent days”. MF claims that “SGE premiums have a modest but positive and statistically significant impact on future gold price [LBMA Gold Price] moves” however, correlation is not causation. Properly functioning financial markets are supposed to instantaneously reflect pricing information in other markets, not take days to reflect it. There are also too many other variables which could also be responsible for explaining why the LBMA Gold Price moved higher after SGE premiums had previously moved higher.
However, unlike the OTC and COMEX, the Shanghai Gold Exchange is structured around physical gold price discovery. The establishment of a gold exchange in Shanghai was first referenced in China’s 10th Five Year plan in 2001 as an integral part of the nation’s gold liberalisation strategy. Following its launch in 2002, the SGE was quick to promote physical gold ownership and by 2004 was allowing private citizens in China to transact on the Exchange and purchase gold bullion. On the SGE, physical delivery of gold is the norm, not the exception. The SGE has a network of 61 gold vaults in 35 citiesacross China.
This makes the SGE a nature candidate to take the lead in pricing real physical gold and acting as a physical gold price discovery centre if and when the physical gold markets detach from the paper gold markets, and physical gold demand and supply becomes the natural determinant of the international gold price.

Question: What is the significance of the LBMA Gold Price?
The LBMA Gold Price is a twice daily auction for unallocated gold controlled by the LBMA. The final output of the auction is a benchmark gold price. The auction is conducted in US Dollars, however the derived price is also published in 11 other currencies. This auction is the successor to the London Gold Fixing and the benchmark is now a ‘Regulated Benchmark’ under UK financial regulations and is administered by ICE benchmark Administration (IBA), part of the ICE exchange group. But the new auction mechanics are fundamentally similar to the older London Gold Fixing mechanics. The auction opening prices are based on COMEX and London OTC price quotations as well as trading prices at auction opening times, i.e. at 10:30 am and 3:00 pm respectively.
Structurally, the LBMA Gold Price auction has very narrow direct participation, with only a handful of LBMA member bullion banks being authorised by the LBMA to take part. These are the same bullion banks which are the market makers and largest traders in both London OTC gold market trading and in COMEX futures gold trading. The LBMA Gold Price auctions therefore lack broad market participation and is not representative of the broader gold market. The LBMA and ICE Benchmark Administration also refuse to reveal the identities of the auction chairpersons, a refusal which suggests that those now involved have connections to the former scandal tainted London Gold Fixing auction. They also refuse to reveal how the chairperson chooses the opening price for the auctions. See “Six months on ICE – The LBMA Gold Price” for more details.
Not surprisingly, the LBMA gold auctions also settle in unallocated gold, so trading and settlement in the auction is also detached from physical gold markets. Trading volumes in the daily gold auctions usually only reach the equivalent of 1-2 tonnes of unallocated gold transfers, and rarely exceed 3 tonnes. So not only do the LBMA gold auctions not offer wide participation to the thousands of gold trading entities around the world, the volumes traded in the auctions are not representative of the global gold market and the benchmark is therefore not a reliable representation of the global gold market.
Perversely however, the LBMA Gold Price benchmark price is very influential in the gold world in that it is a widely-used valuation source for gold-backed Exchange Traded Funds (ETFs) such as the SPDR Gold Trust and the iShares Gold Trust. Furthermore, it is often used ad a transaction reference price by physical bullion dealers when purchasing physical gold from refineries and suppliers. The LBMA Gold Price is also widely used as a benchmark for valuing financial products such as ISDA gold interest rate swaps, gold options and other gold derivatives, and is even used by other futures exchanges as a reference point on their gold futures contracts, for example the gold futures contract (FGLD) of the Malaysia Derivatives Exchange.
Therefore, this reference price and auction, which is controlled by a handful of bullion banks under the banner of the LBMA, is based on trading synthetic gold, but is referenced widely around the world in countless gold contracts and in countless physical gold markets and retail gold outlets.
Even very large central bank physical gold transactions take this gold fixing reference price derived in London and then use it as a price with which to execute their own independent bi-lateral transactions. For example, when the Swiss National Bank used the Bank for International Settlements (BIS) gold trading desk as its agent to sell hundreds of tonnes of physical gold in the early 2000s, the transaction prices used for the transfers were based on taking the London Gold Fixing price as a reference price. As another example, in 2010, the IMF’s so-called ‘on-market’ gold sales were conducted by a selling agent who also based the sales transfer prices on the London Gold Fixing price. This is the same London Gold Fixing that is currently under investigation in an ongoing New York court class action suit.
Of concern here is that a benchmark that was controlled by a cartel of London-based bullion banks, that was opaque in its operation, and that is currently the subject of a gold price manipulation class action suit, was being used to value very large physical gold transactions. The question must be asked, was this benchmark fit for purpose and to what extent was it representative of the underlying worldwide physical gold market?
Question: So what about outside London and US / NY trading hours. Do other markets contribute more during these other times, for example TOCOM in Japan and MCX in India?
In general, higher trading volumes mean more liquidity to drive price discovery. But since financial markets are integrated, price information rapidly flows between markets due to simultaneously and overlapping trading. Futures markets such as TOCOM in Japan and MCX in India do contribute to gold price discovery, especially at times when the larger markets are not trading, but because these other venues are less liquid, COMEX tends to lead in the lead-lag analysis of futures prices. This finding is according to a study by financial academics from Bangkok University led by Rapeesorn Fuangkasem.
Question: How does gold lending affect the gold price?
The Gold Lending Market is centred in London at the Bank of England. It is here that central banks and commercial bullion banks interact in the execution of ultra-secretive gold lending and gold swaps transactions that increase the available supply of gold. Bullion banks euphemistically refer to this as liquidity provision but these transactions act as a supply overhang on the gold market. Few if any transactional details about the gold lending market are ever made public. If gold lending trade details were market-wide knowledge, their impact would be immediately reflected in the gold price. But they are not. Secrecy about central bank gold lending transactions therefore makes this market informationally inefficient. And when a market is informationally inefficient, the prices in that market do not necessarily reflect the non-public information in that market.
Likewise gold lending and gold swaps are not reported distinct from central bank gold holdings. In the perverse world of central bank accounting policies, gold held and gold lend/swapped is merely reported as one line item of ‘Gold and Gold Receivables’ on central banks’ balance sheets. Therefore, the real state of central bank gold holdings is obscured for any central bank engaged in gold lending or gold swaps.
Gold Lending also provides borrowed physical gold for bullion banks to engage in leveraged fractional-reserve bullion banking and trading, mostly in London where the international spot gold price is predominantly determined. Therefore, gold lending, the leveraged and fractional-reserve nature of gold trading, and the lack of reporting of real central bank gold holdings, all align to have a potentially depressing effect on the gold price as discovered in the London Gold Market.

Question: Given that paper gold markets determine the gold price, then when or how could physical markets begin determining the gold price?”
There are two sets of gold markets – on the one side, the COMEX gold futures and London OTC unallocated gold spot markets which are both ultra leveraged and which both create gold supply out of thin air, and on the other side, the physical gold markets which inherit the gold prices derived in these paper gold markets. Currently the physical gold markets have no effect on the international gold price.
Any shift away from the dominance of gold price discovery in the paper markets to a dominance of gold price discovery in the physical gold markets could only occur via a disconnect between physical gold prices and paper gold prices. The conditions for such a disconnect to occur would only be possible in an environment in which trading behaviour in the paper markets changed and/or the supply-demand balance in the physical gold market became acutely stressed and out of balance.
A shift in trading behaviour in the paper gold markets refers to an increased preference for converting paper gold claims (unallocated positions or gold futures positions) into physical holdings either directly by exercising conversion rights, or indirectly by selling paper gold and then using the proceeds to buy physical gold. Many of these paper claims are held by institutional and wholesale market clients. An increase at the margin in paper gold holders demanding direct conversion of their paper claims into physical gold would probably make such conversion impossible as cash-settlement of futures and unallocated positions would be introduced and made obligatory by regulators and exchange / marketplace providers.
The indirect option would be to sell paper gold and then buy physical bullion on the physical gold market from bullion dealers such as BullionStar. This move into physical gold would raise physical gold demand to such an extent that it could overwhelm available gold supply. At the same time the international gold price would fall because of selling pressure in the paper gold markets, thereby creating a disconnect between the price of paper gold and the price of physical gold, and would make the continued holding of paper gold claims ever riskier.
One trigger that could prompt a shift in sentiment from paper gold to physical gold would be a realization by a critical mass of paper gold holders that physical gold stocks are finite, while paper gold claims are at best fractionally-backed. The acceptance of this reality would be a self-fulfilling prophesy, prompting more and more paper gold claim holders to attempt to rotate into physical gold.
The contemporary physical gold markets have already witnessed sustained flows of physical gold from West to East over the last number of years driven by huge physical gold demand emanating from China, India and much of the rest of Asia. While physical gold flows are dynamic and while gold flows can and sometimes do reverse out of normal recipient destinations such as Hong Kong, Turkey, Dubai and Thailand, this is not true of China and to a large extent is not true of India either, where gold that gets imported does not come back out again. India has imported over 11,000 tonnes of gold since 2001. China has imported 7,200 tonnes of gold since 2001.
As more and more gold goes into destinations such as China and India in quantities which exceed annual gold mine supply, there is less gold available in above ground stockpiles to meet supply deficits. This is akin to a slow bank run on gold. There is also very little gold stored in the London gold market that is not already accounted for by central bank gold holdings or ETF gold holdings. Coupled with this, if in the future the paper gold holders shift to a preference for converting their paper claims into physical gold, this could also be a catalyst for tipping the physical gold market even further into a situation of excess demand and acute supply stress.
In a scenario of a destructing paper gold market, ownership of physical allocated and segregated gold is paramount. This means physical gold that is unencumbered, free from competing claims and titles, and that cannot be lent out or swapped. The paper gold market is already a gigantic bubble which has expanded to an unsustainable size and whose huge fractionally-backed claims are supported by very small physical gold foundations. The unsustainable nature of such a bubble dictates that it’s a matter of when and not if the paper gold bubble bursts. In such a scenario, physical gold ownership is the only thing that can protect against a systemic collapse of the financial system and protect against the destruction of the fractionally-reserved gold banking system.
Footnote:
BullionStar’s ideological belief promotes freedom of speech and liberty. Likewise, we believe that open debate produces improved analysis and research. Indeed, the BullionStar blog platform encourages varied opinions and well-researched ideas. Debate is particularly important when applied to the gold market, a market which is often opaque and deliberately shrouded in secrecy by its influential bullion bank and central bank participants.
BullionStar’s precious metals analyst Koos Jansen has a different view and believes that while paper markets might have some short-term impact on price, the physical gold market is more dominant in gold price formation over the long-term. Due to having taken some time off recently for health reasons, Koos did not contribute to the following article. But he recently summarized his view as follows:
“Due to my research in recent years my opinion has shifted from ‘the gold price is purely set in the paper markets’ to ‘the physical market is more dominant in the long-term whereas the paper market has more impact in the short term’. That’s where I stand now. If central banks suppress the price over years/decades they need to supply physical gold or the paper and physical price would diverge. Potentially there is a combination of paper and physical schemes at work.”
Koos Jansen will, at a later point in time, present his view by answering and publishing the same or similar questions on the BullionStar website.
BullionStar
E-mail BullionStar on: support@bullionstar.com

-
I know Mike is a very solid investor and respect his opinions very much. So if he says pay attention to this or that - I will.
~ Dale G.
-
I've started managing my own investments so view Michael's site as a one-stop shop from which to get information and perspectives.
~ Dave E.
-
Michael offers easy reading, honest, common sense information that anyone can use in a practical manner.
~ der_al.
-
A sane voice in a scrambled investment world.
~ Ed R.
Inside Edge Pro Contributors

Greg Weldon

Josef Schachter

Tyler Bollhorn

Ryan Irvine

Paul Beattie

Martin Straith

Patrick Ceresna

Mark Leibovit

James Thorne

Victor Adair