
Gold & Precious Metals

Last week we wrote that precious metals should see upside follow through but to be wary of the 200-day moving averages and February highs before becoming excited. The metals did follow through as Gold gained 1.5% and Silver gained 1.9% (for the week) but the miners disappointed. GDX gained only 1.1% while GDXJ finished in the red as did junior silver companies (SILJ). As spring beckons, the gold stocks are showing relative and internal weakness.
Two signs of weakness in the miners are visible in the weekly candle charts below. First, while Gold has already rallied back to its high the first week of February, GDX and GDXJ are down 11% and 15% respectively. The miners and the metals will not always be perfectly aligned but that is a rather stark divergence. Secondly, although Gold closed at the highs of the week in each of the past two weeks the miners failed to hold their gains. This is not exactly the type of price action that inspires more gains in the short term.

Gold, GDXJ, GDX Weekly Candles
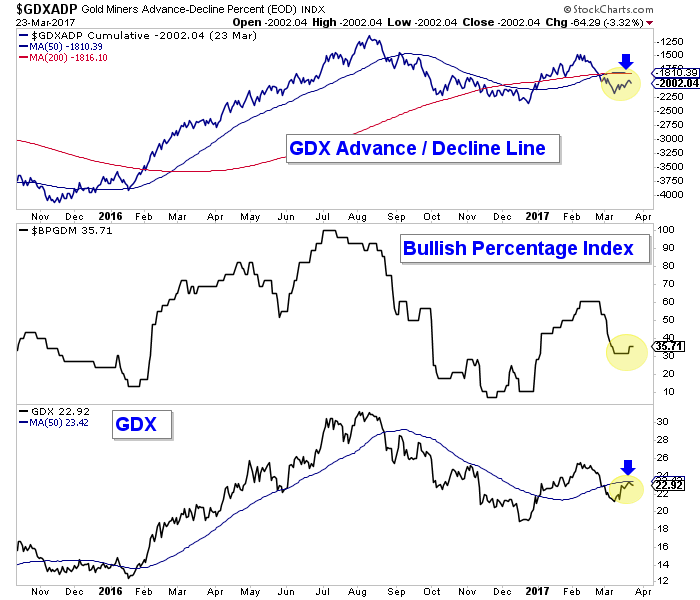
Gold stocks are also showing some internal weakness. In the chart below we plot the advance/decline (A/D) line for GDX and its bullish percentage index (BPI). Both are breadth indicators. The A/D line is the holy grail of leading indicators while I have found the BPI to be more of a confirmation or overbought/oversold indicator. At present, the A/D line is below both its 50 and 200-day moving averages which are flattening and soon to slope lower. That is ominous if the A/D line can’t regain those moving averages. Meanwhile, the BPI is only at 36%. This means it has room to move up but it also shows weakness as it has barely changed despite gains in recent weeks.
 x
xPart of the cause of weakness in the gold stocks (and relative strength in Gold) is the weakness in the stock market which is actually a welcome and positive development for precious metals. As we discussed in a recent video, precious metals are currently setup to benefit from weakness in the stock market as they were in the 1970s and early 2000s. Patience is needed though as stock market weakness is not necessarily an instant or immediate catalyst for the gold stocks.
The current weak technical action in the gold stocks is further evidence that precious metals are unlikely to see a blast off anytime soon. Gold could continue to rally on the back of stock market weakness but don’t expect that to pull miners much higher. I reiterate that at present it’s not wise to chase strength in the miners. Instead, traders and investors should be patient and wait for (presumably) lower prices and a better entry point. We continue to look for high quality juniors that we can buy on weakness and hold into 2018.
Jordan Roy-Byrne, CMT, MFTA

Here are today’s videos and charts (double click to enlarge):
Big Macro Picture Key Charts & Video Analysis
SFS Key Charts & Tactics Video Analysis

SF Juniors Key Charts & Video Analysis

SF60 Key Charts & Tactics Video Analysis
SF Trader Time Key Charts Video Analysis

Morris
The SuperForce Proprietary SURGE index SIGNALS:
25 Surge Index Buy or 25 Surge Index Sell: Solid Power.
50 Surge Index Buy or 50 Surge Index Sell: Stronger Power.
75 Surge Index Buy or 75 Surge Index Sell: Maximum Power.
100 Surge Index Buy or 100 Surge Index Sell: “Over The Top” Power.
Stay alert for our surge signals, sent by email to subscribers, for both the daily charts on Super Force Signals at www.superforcesignals.com and for the 60 minute charts at www.superforce60.com
About Super Force Signals:
Our Surge Index Signals are created thru our proprietary blend of the highest quality technical analysis and many years of successful business building. We are two business owners with excellent synergy. We understand risk and reward. Our subscribers are generally successfully business owners, people like yourself with speculative funds, looking for serious management of your risk and reward in the market.
Frank Johnson: Executive Editor, Macro Risk Manager.
Morris Hubbartt: Chief Market Analyst, Trading Risk Specialist.
website: www.superforcesignals.com
email: trading@superforcesignals.com
email: trading@superforce60.com
SFS Web Services
1170 Bay Street, Suite #143
Toronto, Ontario, M5S 2B4
Canada
Last week, several U.S. economic reports were released. What do they imply for the gold market?
The FOMC meeting and parliamentary election in the Netherlands prevented us from covering recent economic data coming out from the U.S. Let’s catch up. First of all, inflation continued to strengthen. Consumer prices increased 0.1 percent last month, according to the Bureau of Labor Statistics. It was the smallest rise since last summer and much below a 0.6 percent surge in January. Core CPI, which excludes the volatile energy and food categories, increased 0.2 percent, only slightly faster. However, overall CPI rose 2.7 percent on an annual basis, the highest level since early 2012. Core CPI jumped 2.2 percent over the last 12 months.
As one can see in the chart below, the overall consumer inflation rate significantly accelerated over the last several months. The inflation rate rose from 0 percent in September 2015 to almost 3 percent currently. It strengthens the hawks’ camp in the U.S. central bank, which is generally bad news for gold bulls. However, until the Fed remains behind the curve, gold may gain due to lower real interest rates.
Chart 1: CPI (blue line) and core CPI (red line) year-over-year from February 2012 to February 2017.
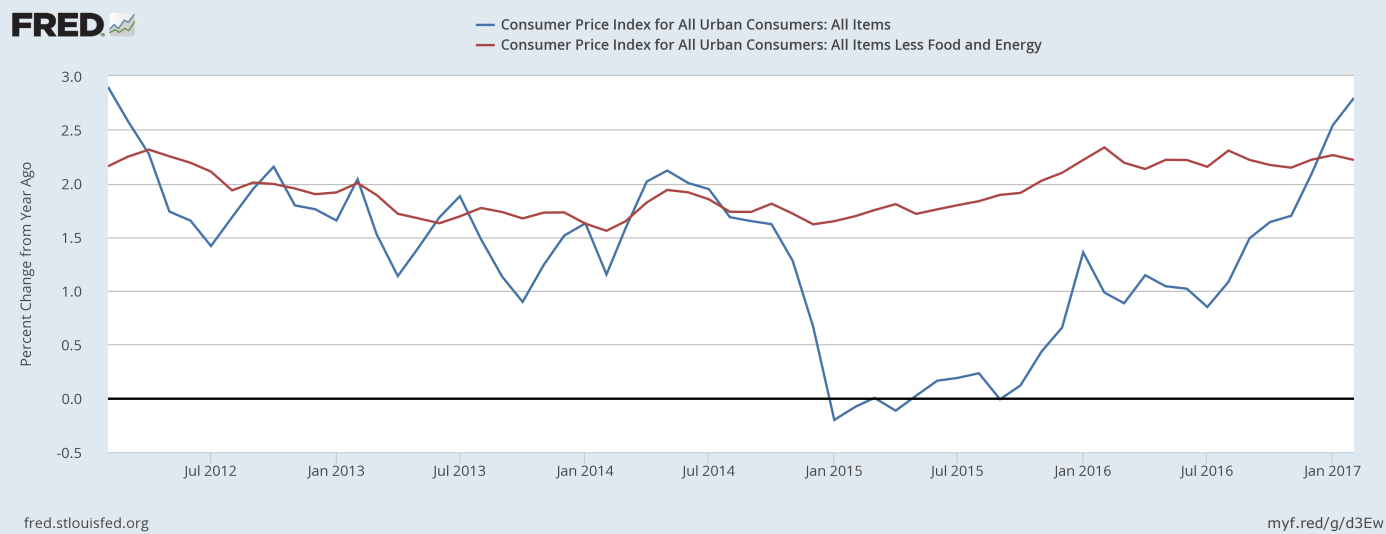
When it comes to other data, retail sales rose just 0.1 percent in February, following a 0.6 percent jump in January. Weak sales – despite unseasonably warm weather, are a negative surprise, which does not bode well for economic growth. As a reminder, the Atlanta Fed’s GDPNow model forecasts real GDP growth in the first quarter of 2017 at only 0.9 percent.
National industrial production was flat in February, but regional manufacturing indices, such as Philly Fed and Empire State remained at high levels in March (although they corrected a bit). Permits to build new homes dropped 6.2 percent, but housing starts climbed 3 percent in February. And the sentiment among home builders also surged, as the National Association of Home Builders’ confidence index jumped 6 points to 71 in March, the highest level since June 2005.
The bottom line is that retail sales were weak in February, but inflation accelerated on an annual basis. However, given a big drop in oil prices, inflation may soften in the months ahead. Anyway, the recent data on inflation does not affect significantly the prospects of the Fed hikes. A hawkish Fed is rather negative for the yellow metal, although two more hikes in 2017 have been probably already priced in. Stay tuned!
If you enjoyed the above analysis, we invite you to check out our other services. We focus on fundamental analysis in our monthly Market Overview reports and we provide daily Gold & Silver Trading Alerts with clear buy and sell signals. If you’re not ready to subscribe yet and are not on our mailing list yet, we urge you to join our gold newsletter today. It’s free and if you don’t like it, you can easily unsubscribe.
Disclaimer: Please note that the aim of the above analysis is to discuss the likely long-term impact of the featured phenomenon on the price of gold and this analysis does not indicate (nor does it aim to do so) whether gold is likely to move higher or lower in the short- or medium term. In order to determine the latter, many additional factors need to be considered (i.e. sentiment, chart patterns, cycles, indicators, ratios, self-similar patterns and more) and we are taking them into account (and discussing the short- and medium-term outlook) in our trading alerts.
Thank you.
Arkadiusz Sieron
Sunshine Profits‘ Gold News Monitor and Market Overview Editor

-
I know Mike is a very solid investor and respect his opinions very much. So if he says pay attention to this or that - I will.
~ Dale G.
-
I've started managing my own investments so view Michael's site as a one-stop shop from which to get information and perspectives.
~ Dave E.
-
Michael offers easy reading, honest, common sense information that anyone can use in a practical manner.
~ der_al.
-
A sane voice in a scrambled investment world.
~ Ed R.
Inside Edge Pro Contributors

Greg Weldon

Josef Schachter

Tyler Bollhorn

Ryan Irvine

Paul Beattie

Martin Straith

Patrick Ceresna

Mark Leibovit

James Thorne

Victor Adair