
Gold & Precious Metals

posted Mar 3, 2017
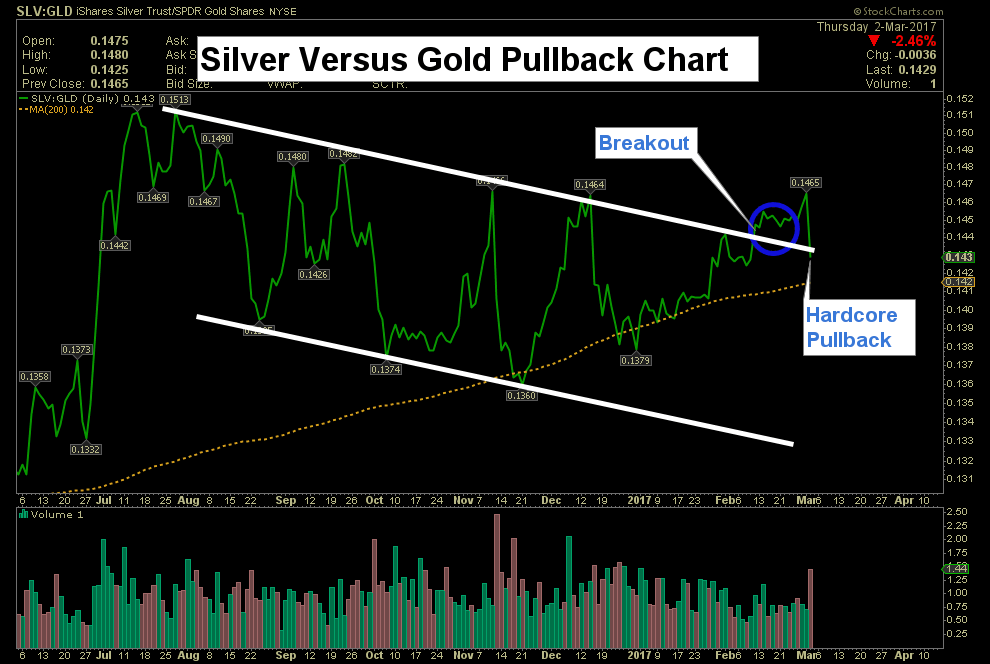
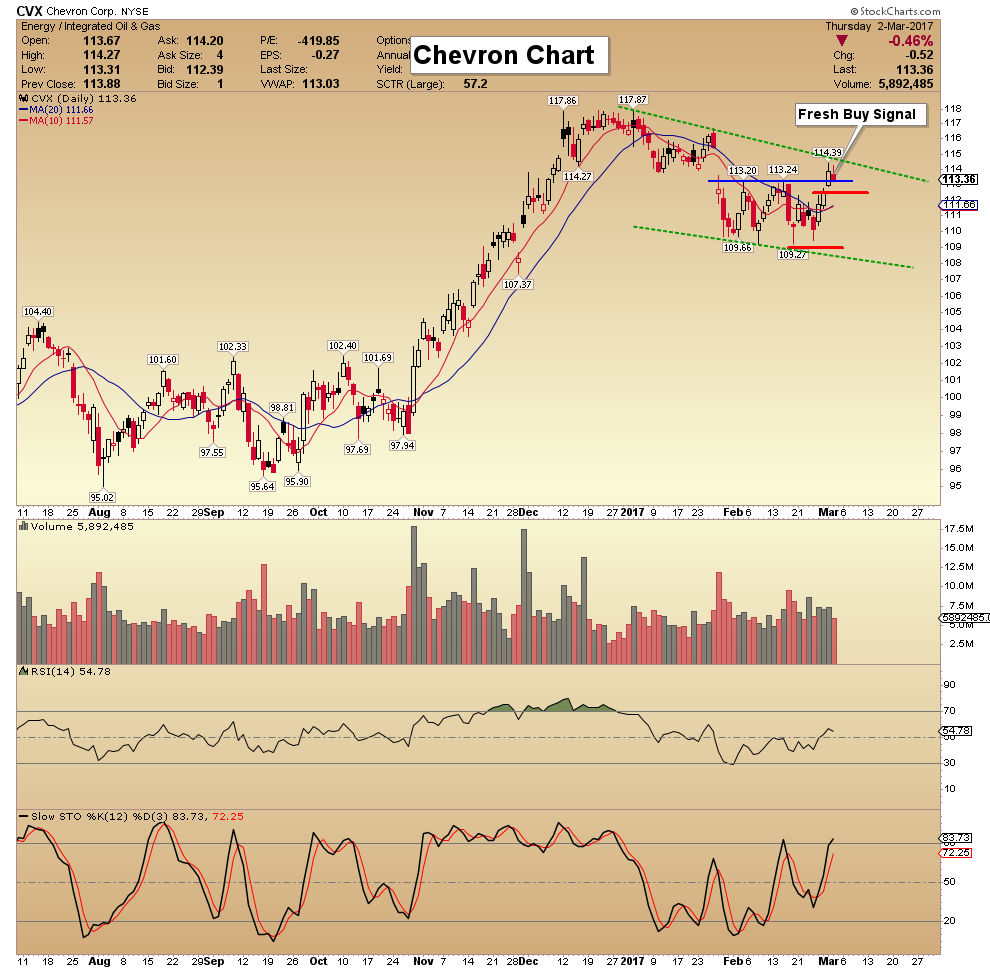
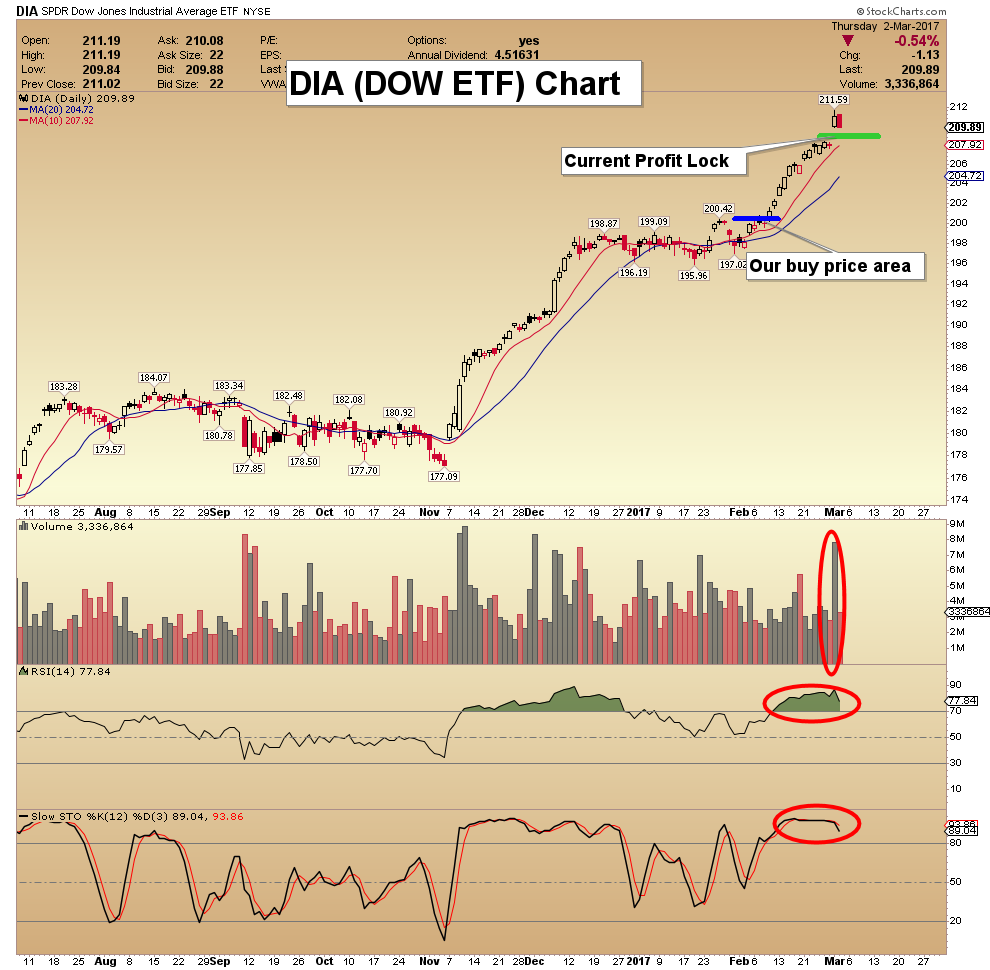
Today’s videos and charts (double click to enlarge):
Silver Versus Gold Video Analysis
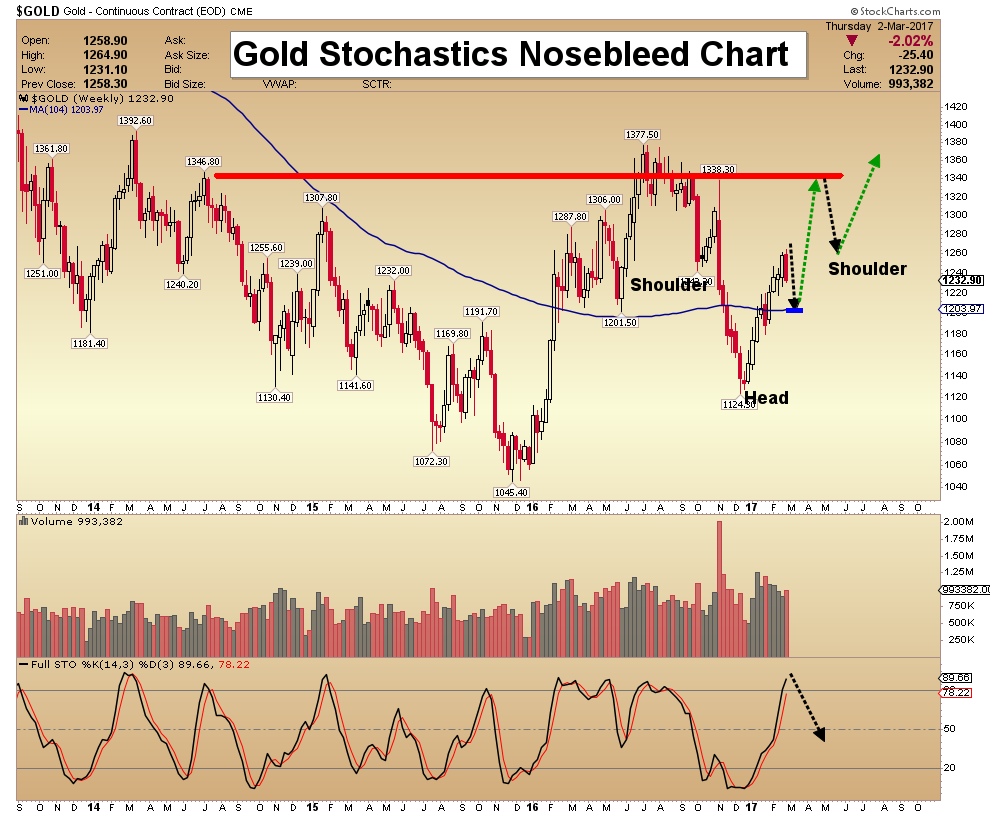

SFS Key Charts & Tactics Video Analysis

SF60 Key Charts & Tactics Video Analysis

SF Trader Time Key Charts Video Analysis

Morris
Feb 27th was just another period of back-and-forth movement for gold, silver, the USD Index and even the general stock market – but not for precious metals mining stocks. Gold stocks and silver stocks plunged very visibly – there are very important implications of this move and they are not bullish.
Let’s take a closer look at the charts (charts courtesy of http://stockcharts.com), starting with the GDX ETF (proxy for both gold and silver stocks).
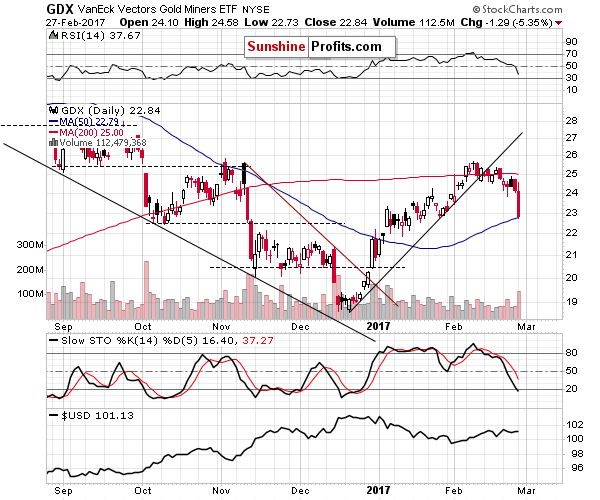
Precious metals mining stocks declined on huge volume and the fact that this happened without the metals’ lead is profound. Miners were a leading indicator in the recent past as well as in the previous years – including the time before THE plunge of 2013. We discussed that in greater detail in yesterday’s gold trading alert, while describing the situation in gold stocks (using the HUI Index as a proxy):
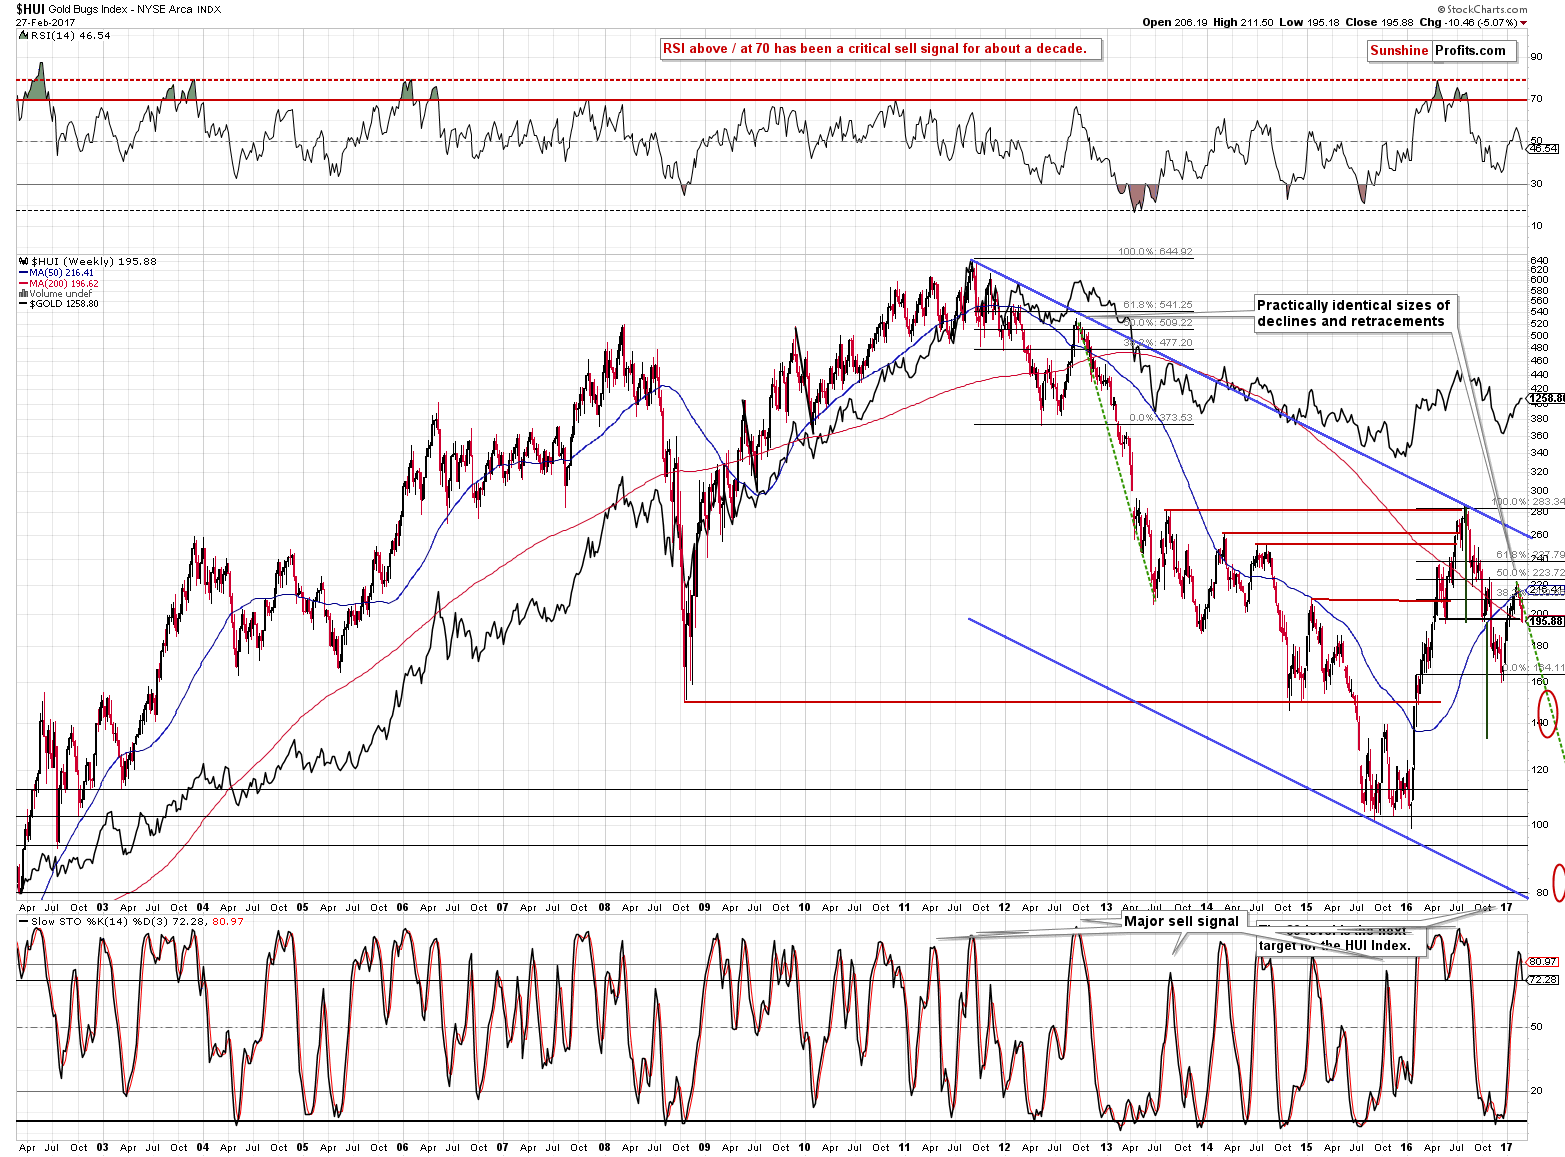
The HUI Index declined by 8 index points (almost 4%) [last week] despite having very strong reasons to move higher. Not only gold rallied, but we also saw higher prices of stocks in general (highest weekly close ever in case of S&P and DJIA) – miners should have rallied strongly and they weren’t just responding weakly – they declined, which is rather extreme. We saw something similar in 2012 and 2013, before the huge plunge in gold.
The above chart features something less visible but still very important. The size of the decline that followed the 2011 top and the size of the subsequent rebound (in the second half of 2012) is practically identical to the decline that we saw in the second half of 2016 and the current rebound. Back in 2012 gold stocks formed a local top after retracing about 50% of the previous decline and it appears that exactly the same thing happened also this time.
But the question remains if the top in metals was just formed or not. The upswing in gold and volume in GLD makes it quite likely.
Interestingly, while the HUI declined by almost 4% last week, it’s already down by more than 5% this week, even though gold is flat. The bearish implications described above clearly remain in place.
We already featured the GDX ETF chart that includes silver stocks, but let’s take a look specifically at them, to make sure that they confirm the observations made while analyzing gold stocks.
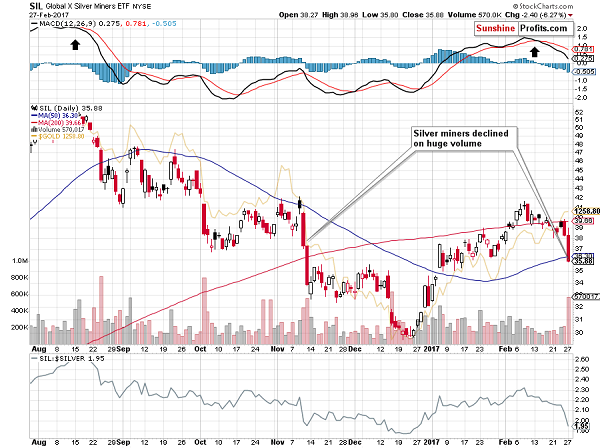
During yesterday’s session alone silver stocks declined about as much as they did from the February top to Friday – the size of the decline just doubled. The volume was huge. Both factors (size and volume) serve as good confirmations of the bearish signals that we discussed earlier.
Summing up, the bearish outlook for the precious metals sector remains in place. While the daily price changes are not particularly meaningful (except the miners’ underperformance – its implications are meaningful and bearish), the long- and medium-term signals that are very important (being highly effective in the past) continue to paint a very bearish picture for the precious metals sector for the upcoming weeks and months. It seems that the following weeks will be more than exciting and we encourage you to stay up-to-date with developments in gold and silver.
Thank you.
Przemyslaw Radomski, CFA
Founder, Editor-in-chief, Gold & Silver Fund Manager
* * * * *
All essays, research and information found above represent analyses and opinions of Przemyslaw Radomski, CFA and Sunshine Profits’ associates only. As such, it may prove wrong and be a subject to change without notice. Opinions and analyses were based on data available to authors of respective essays at the time of writing. Although the information provided above is based on careful research and sources that are believed to be accurate, Przemyslaw Radomski, CFA and his associates do not guarantee the accuracy or thoroughness of the data or information reported. The opinions published above are neither an offer nor a recommendation to purchase or sell any securities. Mr. Radomski is not a Registered Securities Advisor. By reading Przemyslaw Radomski’s, CFA reports you fully agree that he will not be held responsible or liable for any decisions you make regarding any information provided in these reports. Investing, trading and speculation in any financial markets may involve high risk of loss. Przemyslaw Radomski, CFA, Sunshine Profits’ employees and affiliates as well as members of their families may have a short or long position in any securities, including those mentioned in any of the reports or essays, and may make additional purchases and/or sales of those securities without notice.

The early stages of Gold bull markets (this one included) are characterized by strong outperformance from the miners. They will lead the metals and turning points and register strong outperformance. We saw that in the early 2000s, late 2008 to early 2009 and we have seen it again over the past year. During the recent rebound, the miners rallied back to the “Trump” resistance while Gold is not yet close to doing so. However, unfortunately for bulls, while Gold is now pushing higher above key levels, the gold stocks are lagging. This new and recent underperformance suggests the gold stocks have made an interim peak and will remain entrenched in a correction or consolidation.
In the daily bar chart below we plot Gold, GDX and GDXJ. Gold closed the week up 1.6% and through resistance at $1250/oz while both GDX and GDXJ closed down over 2.5%. That is a strong negative divergence. Gold also eclipsed its early February high while miners did not. Do note that the miners already reached their early November peak (GDXJ exceeded it) while Gold remains some $40/oz below that peak. Buying in the miners reached an exhaustion point.

Gold, GDX, GDXJ
So if the gold stocks are correcting, how much downside potential is there? Upon first glance, we see 8% downside for GDX and 10% to 12% downside for GDXJ and TheDailyGold junior index. Note that the miners have already corrected roughly 6% to 9%. Keep an eye on GDX $22 because it is a confluence of strong support. It includes the 400-day exponential moving average which has provided support during many bull market corrections. The same can be said for the 350-day exponential moving average for TheDailyGold junior index. The secondary downside target for GDX and GDXJ would be the 400-day moving averages which are currently at $20 and $30 and rising.
 TDG Junior Index, GDXJ, GDX
After a roughly 40% to 50% rebound in only two months it should be no surprise that the mining sector has begun to soften around important resistance. Therefore, the recent underperformance in the shares relative to the metals (Silver included) rather than a surprise is confirmation that a correction in the shares has begun. We expect the metals to follow suit soon enough. Investors and traders are advised to accumulate their favorite names as the mining sector nears our downside targets.
Jordan Roy-Byrne, CMT, MFTA
Jordan@TheDailyGold.com – For professional guidance in riding this new bull market, consider learning more about our premium service including our current favorite junior miners.

-
I know Mike is a very solid investor and respect his opinions very much. So if he says pay attention to this or that - I will.
~ Dale G.
-
I've started managing my own investments so view Michael's site as a one-stop shop from which to get information and perspectives.
~ Dave E.
-
Michael offers easy reading, honest, common sense information that anyone can use in a practical manner.
~ der_al.
-
A sane voice in a scrambled investment world.
~ Ed R.
Inside Edge Pro Contributors

Greg Weldon

Josef Schachter

Tyler Bollhorn

Ryan Irvine

Paul Beattie

Martin Straith

Patrick Ceresna

Mark Leibovit

James Thorne

Victor Adair