
Gold & Precious Metals
February 24, 2017
Today’s videos and charts (double-click to enlarge):
Gold, Silver, & T-Bonds Key Charts Video Analysis
SFS Key Charts & Tactics Video Analysis


SF Juniors Key Charts & Tactics Video Analysis

SF Trader Time Key Charts Video Analysis
Morris
The SuperForce Proprietary SURGE index SIGNALS:
25 Surge Index Buy or 25 Surge Index Sell: Solid Power.
50 Surge Index Buy or 50 Surge Index Sell: Stronger Power.
75 Surge Index Buy or 75 Surge Index Sell: Maximum Power.
100 Surge Index Buy or 100 Surge Index Sell: “Over The Top” Power.
www.superforcesignals.com and for the 60 minute charts at www.superforce60.com

In 2016, two powerful fundamental forces drove the rally in gold prices:
Force #1: Negative real interest rates, as inflation accelerated while bond yields remained near record lows, and …
Force #2: Massive money printing, not by the Fed, but by the European Central Bank and Bank of Japan.
This year, political concerns are Trumping the fundamentals, literally, and pushing gold prices higher amid growing policy uncertainty here in the U.S. and especially in Europe.
Here at home, we have a new president who has outlined some very pro-growth policies, but Trump has been short on the details. And the devil is always in the details. Meanwhile in Europe, Brexit is moving forward as the U.K. prepares for life outside the European Union.
And major elections taking place this year in France and the Netherlands will create even more populist pressure for others to exit the EU, and pronto. Markets are already getting nervous about the growing wave of populism around the world, and that’s keeping a firm bid under gold.
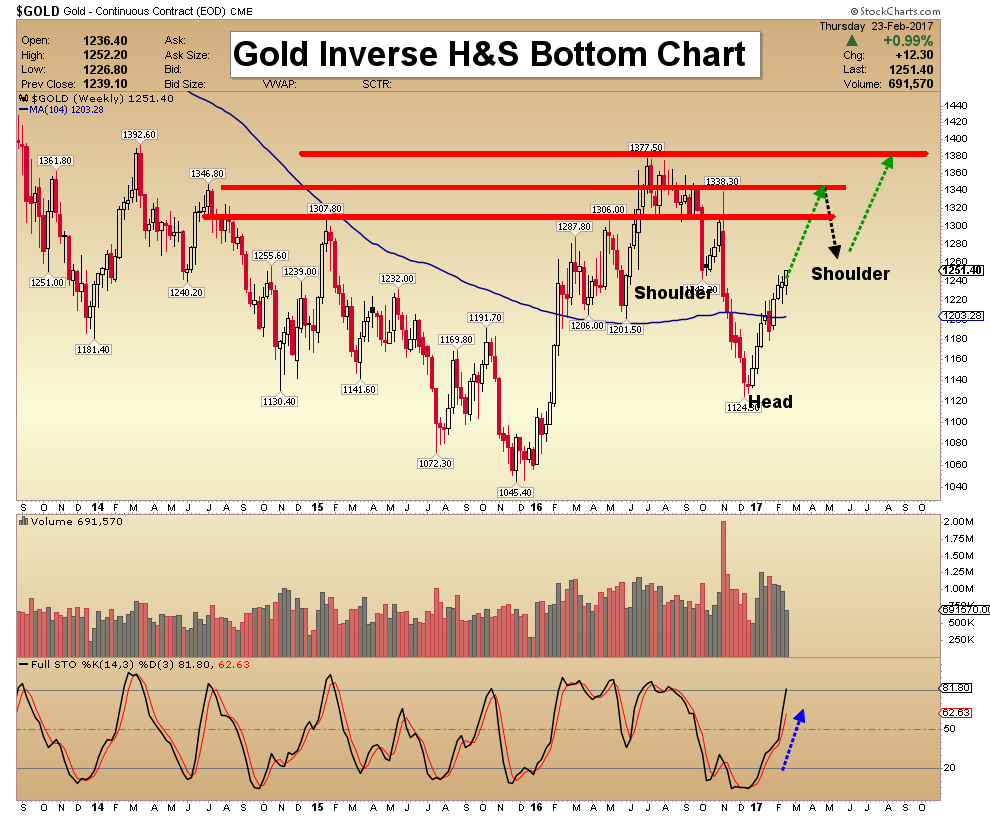
So far this year, gold is pulling off a repeat performance of its trend in 2016. In fact, if you compare the trend in gold over the past six months, to the path it followed last year, the pattern looks eerily similar.
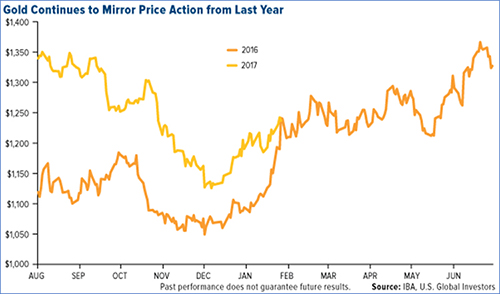
Of course, history never repeats exactly, but it often rhymes. If this pattern holds up — and my own neural net AI forecast charts suggest it will — then I expect gold to enter a mostly sideways trading range, including a correction in the months ahead, which could retest the $1,200 level or a tad lower on the downside.
The real story, however, is not in the yellow metal itself, but in the action of gold mining stocks. I expect this is just the beginning of a major move higher for gold and silver stocks — especially the smaller, junior mining shares. Gold and silver stocks should easily outperform precious metals’ prices to the upside in the years ahead, as gold inevitably skyrockets to $5,000 or more.

In fact, the senior mining stocks could outperform by 5- or even 10-to-1 over the price of gold, itself. And select junior mining stocks will really shoot the lights out, easily gaining 20-to-1 or even 50-to1 over the yellow metal.
Right now, investors have already caught on to the outperformance of gold mining stocks, making this a dangerous time to put new money to work in the miners. Let me explain why …
Last year was a good year for gold ETFs, with investors piling into these funds. Record net inflows of $24 billion during 2016 surpassed the previous high of $22 billion in 2009, even after flows reversed briefly post-election, with $8.4 billion of outflows in November and December 2016.

In January alone, another $320 million flowed into ETFs that track the price of gold. And the VanEck Vectors Junior Gold Miners ETF (GDXJ) attracted even more, $650 million of net money flows over the past month.
The trouble is, retail ETF investors are almost always late to the party. And they’re likely piling in now, just before gold enters a corrective phase, as I have forecast.
Bottom line: Expect a better buying opportunity in gold and mining stocks AFTER a near-term correction, which should take place between March and May.
Best wishes,
Larry
related:
The January headline consumer price index (CPI) came in at 2.5%, which is near a 5-year high. What happened to deflation? As a result, real interest rates declined deeper into negative territory or in the case of the 10-year yield, went from positive to negative. No this isn’t a commodity-driven story. The core CPI (ex food and energy) has been above 2% since the end of 2015 when commodities were in the dumps. Inflation is perking up and couple that with a Fed that pursues rate hikes at a glacial speed and that is very bullish for precious metals.
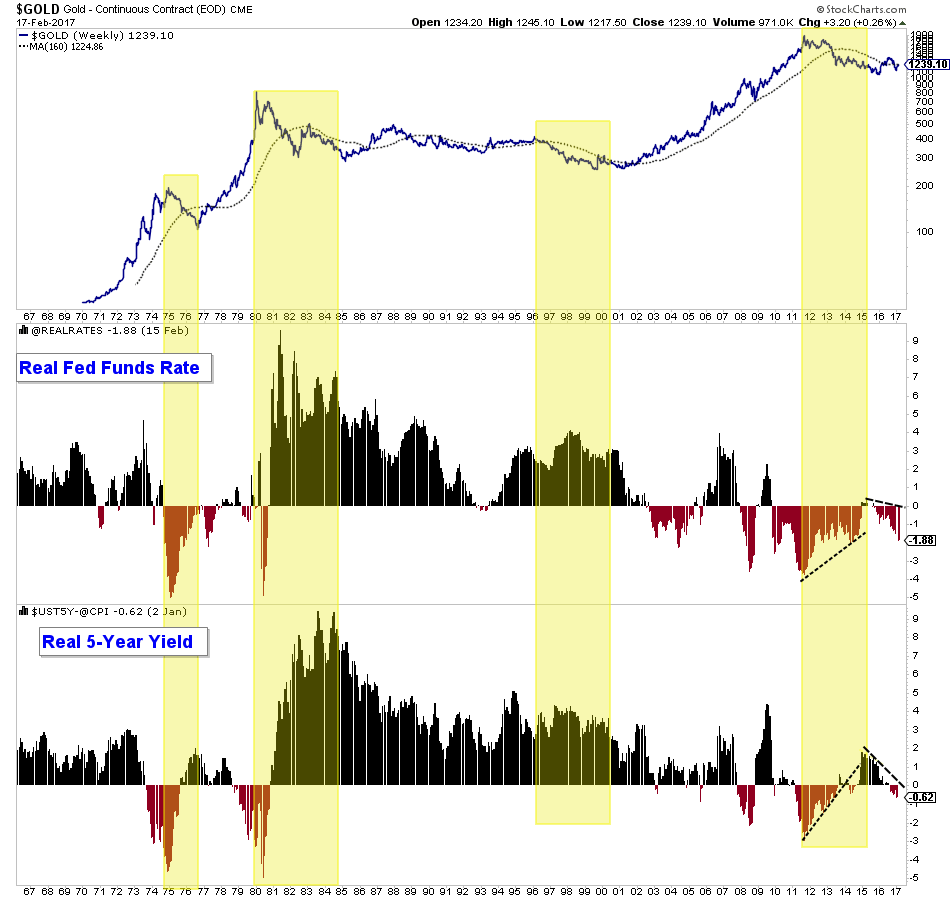
The chart below is what I refer to as our master fundamental chart for Gold. It plots Gold along with the real fed funds rate and the real 5-year yield. In short, negative and/or declining real interest rates drive bull markets in Gold while rising real rates or strongly positive real rates (like in the 1980s and 1990s) drive bear markets in Gold. Since the middle of 2015 both the real fed funds rate and the real 5-year yield have declined by +2%. The real fed funds rate has declined from a fraction above 0% to now almost -2% (-1.88%). Meanwhile, the real 5-year yield has declined by roughly 2.5% in the past two years from nearly 2% to now -0.60%.
Fundamental analysis can be backward looking and that is why it is so important to verify fundamentals through the lense of technical analysis. While there are numerous charts we could show we want to present a fresh look at some sector relationships which help confirm the strong fundamentals currently supporting the sector.
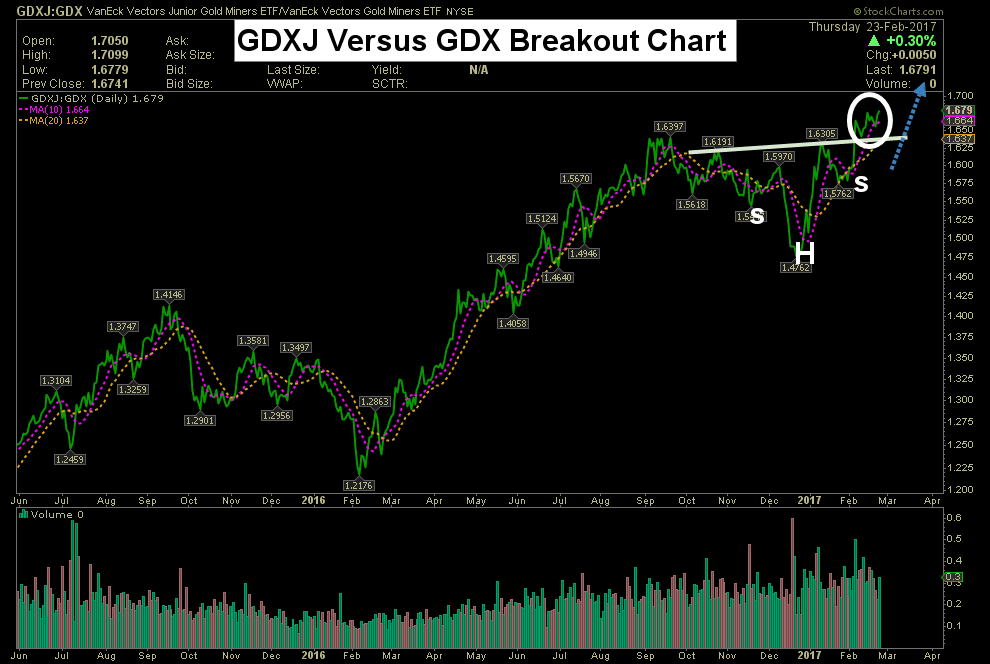
In the chart below we plot the gold stocks (both the seniors and juniors) against Gold and we plot the juniors against the seniors. During a healthy bull market in precious metals, the miners should show strength relative to the metals and secondarily, the riskier and more volatile stocks should also show relative strength. First, we note the GDX to Gold ratio appears poised to break its 10-year downtrend this year. Second, we see that the GDXJ to GDX ratio (juniors versus the seniors) is one month short of a 4-year high. 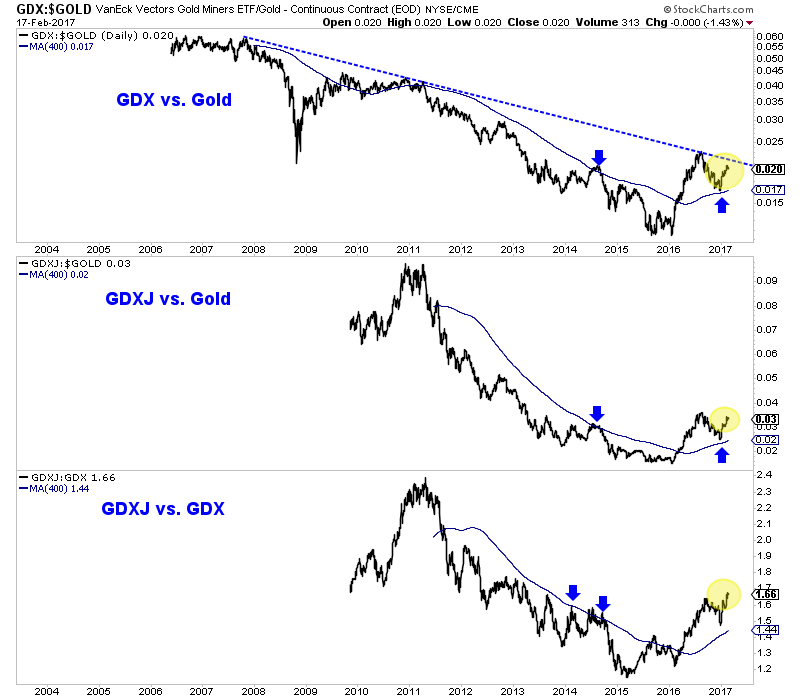
Ratio Charts
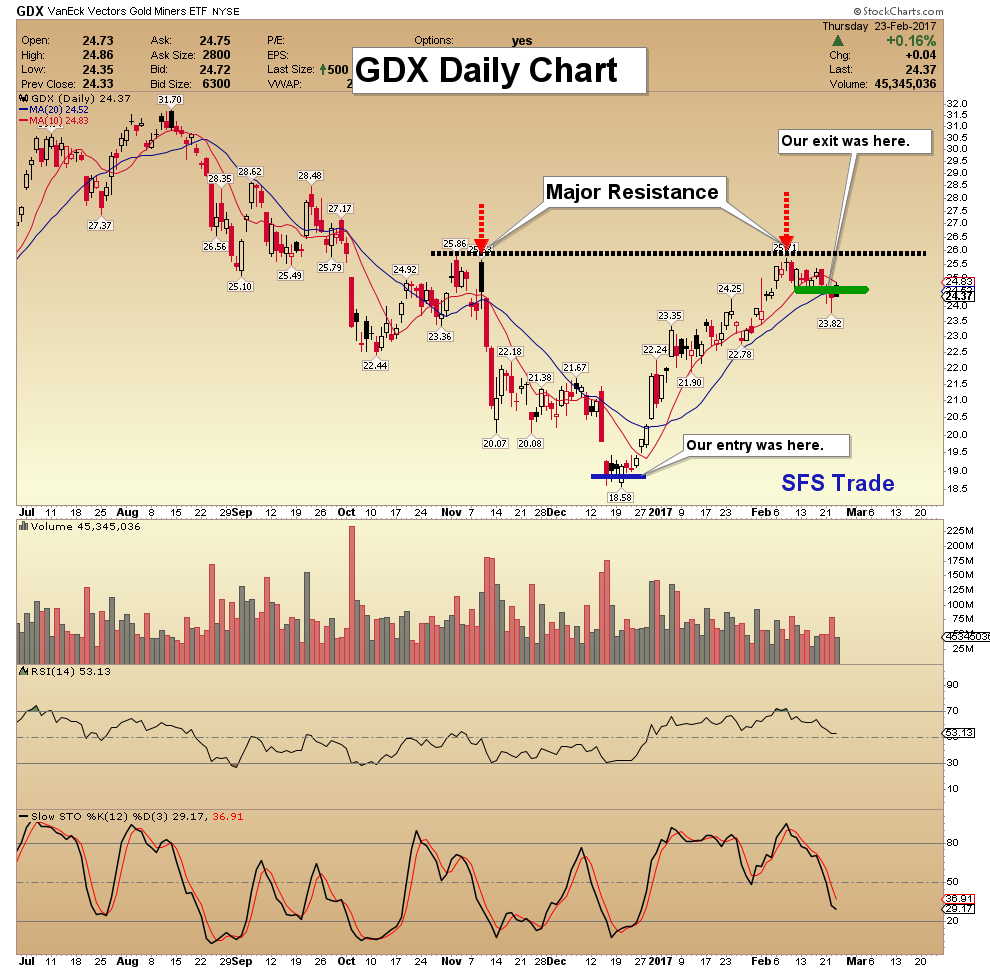
Turning to the short-term, we note that Gold successfully tested its support at $1220/oz while the miners decline on Friday suggests they may need more time to digest recent gains.
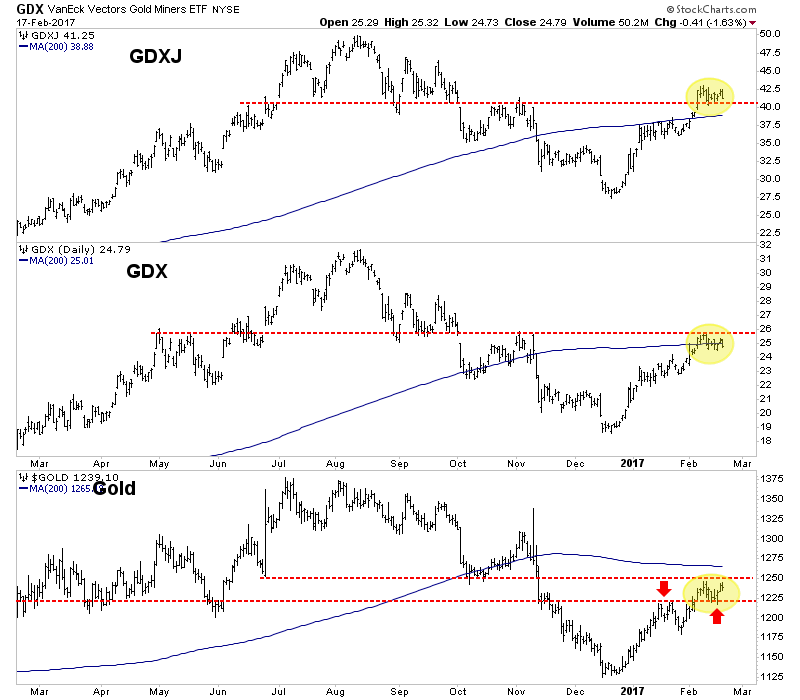
GDXJ, GDX, Gold
With negative real interest rates in place and the gold stocks trading well above their rising 400-day moving averages while showing relative strength against Gold, it is quite clear the gold stocks are in the early stages of a new bull market. It’s also difficult for us to argue that Gold and Silver are not in a bull market. The technical setup is potentially in place for the sector to make an explosive move higher over the next 9 to 18 months. Pullbacks in 2017 need to be bought due to the upside risk over the intermediate term.
Jordan Roy-Byrne CMT, MFTA

 Precious metals expert Michael Ballanger ponders the timelessness of Hunter S. Thompson’s “blistering attacks on the status quo” and their applicability to today’s political landscape.
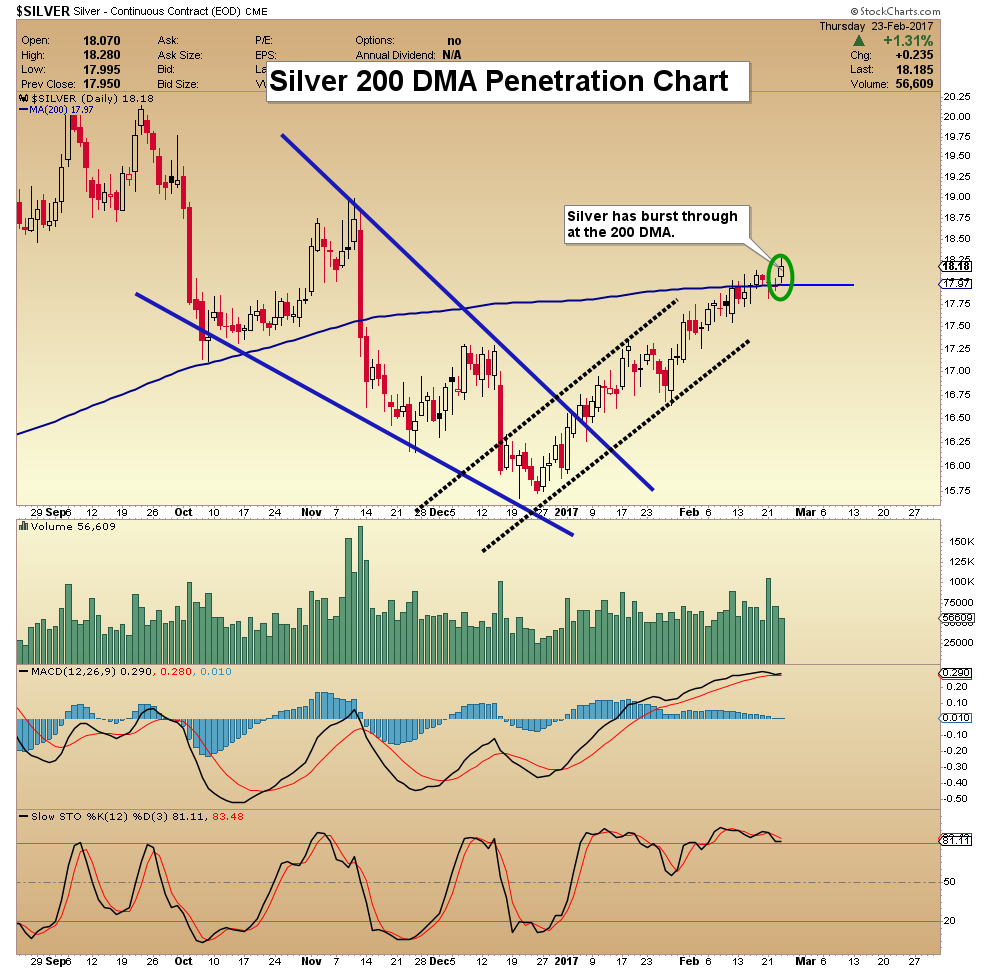
He also reminds us of the “incredibly bullish” fundamentals for silver and lays out the evidence for why this precious metal is on its way to $25/ounce by mid-year:

-
I know Mike is a very solid investor and respect his opinions very much. So if he says pay attention to this or that - I will.
~ Dale G.
-
I've started managing my own investments so view Michael's site as a one-stop shop from which to get information and perspectives.
~ Dave E.
-
Michael offers easy reading, honest, common sense information that anyone can use in a practical manner.
~ der_al.
-
A sane voice in a scrambled investment world.
~ Ed R.
Inside Edge Pro Contributors

Greg Weldon

Josef Schachter

Tyler Bollhorn

Ryan Irvine

Paul Beattie

Martin Straith

Patrick Ceresna

Mark Leibovit

James Thorne

Victor Adair