
Gold & Precious Metals
Last year, central bank policy and negative real interest rates drove the gold rally. This year, it seems to be uncertainty over Trump and other antiestablishment leaders, which is convincing the smart money to make wagers on the yellow metal, often seen as a safe haven during shaky times. So far in 2017, it’s up close to 7 percent, compared to the S&P 500’s 2.6 percent. In fact, if you compare this year’s price action to last year’s, they look remarkably the same, with a dip in December before the Federal Reserve raised rates. Although past performance is no guarantee of future results, gold could gain another $100 an ounce this year if it continues to follow the same trajectory.

Among those who are bullish on the yellow metal is Stanley Druckenmiller, the legendary hedge fund manager who dumped his gold the same day he learned Trump had been elected. Before that, it was the number one holding in his family office account. Now he’s back, telling Bloomberg he “wanted to own some currency and no country wants its currency to strengthen. Gold was down a lot, so I bought it.”
Higher demand has been good for both junior and senior gold miners, which recently crossed above their 200-day moving averages.
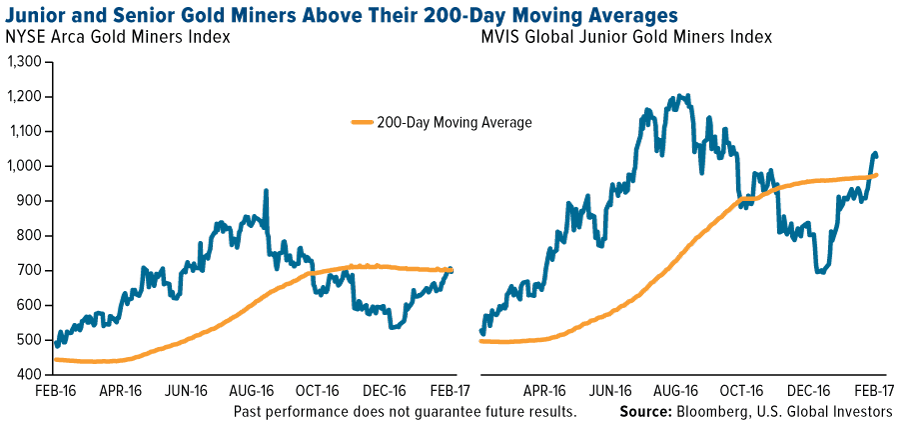
The NYSE Arca Gold Miners Index was up for an incredible seven straight days ended Monday, while the MVIS Global Junior Gold Miners has made positive gains in eight of the nine previous days.
Germany Brings Home More of Its Gold
Hedge fund managers aren’t the only ones whose demand for gold is strong. For the sixth straight year, central banks continued to be net importers of the metal in 2016, with China, Russia and Kazakhstan leading world consumption.

Although it might not have purchased any gold in 2016, the Deutsche Bundesbank, Germany’s central bank, ramped up its repatriation program, bringing home some 216 metric tons from vaults in New York, according to the Wall Street Journal. In 2011, former Fed Chair Ben Bernanke said central banks held gold simply because it’s tradition. I think the reason goes much deeper than that. Gold is money—it has been ever since the first gold currency appeared in China more than 3,000 years ago—and Germany’s efforts are proof of that.

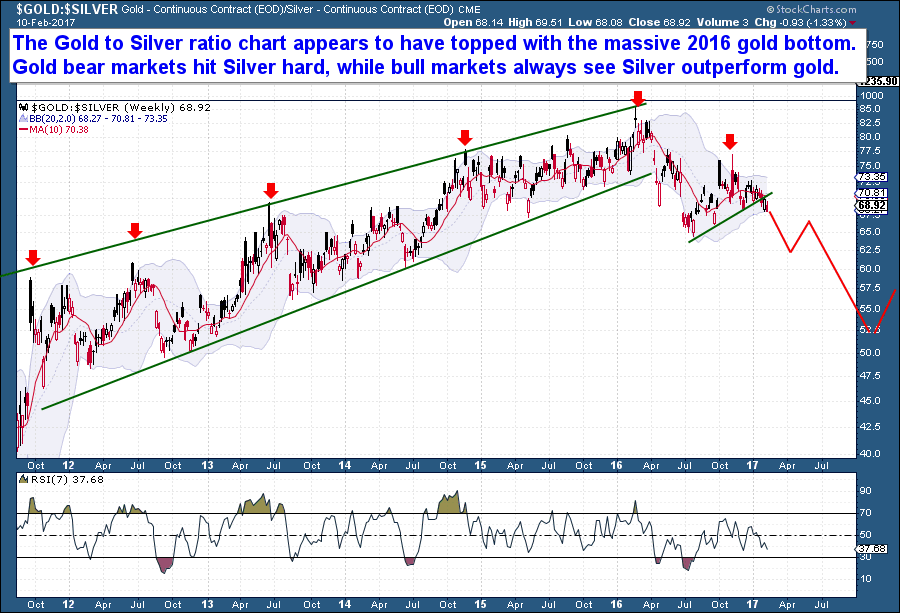
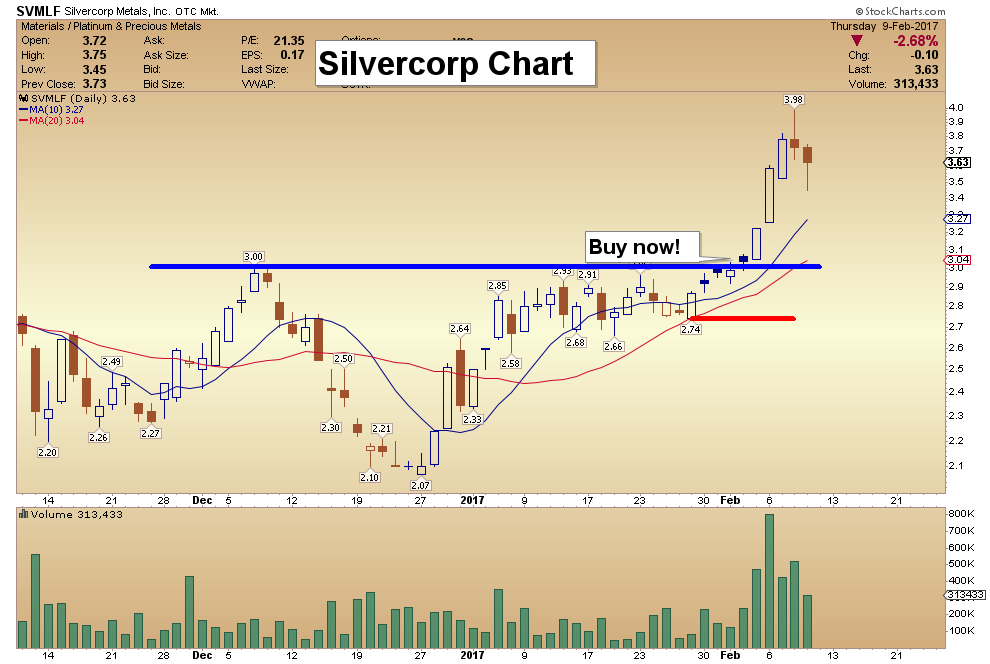
One aspect of the precious metals market today that I like is the Gold Silver Ratio. It appears to have topped, right along with the 2016 gold bottom, and for all gold bull followers out there this is certainly a welcomed development. Precious metals bear markets always hit silver hard, while bull markets always see Silver outperform gold. As a result, the Gold Silver Ratio rises during bear markets and then falls during bull markets.
On the chart below, the long rising channel represents the precious metals bear market when gold/silver were both sold aggressively. Each peak in the ratio, as seen with the red arrows, correspond with major Cycle price lows. Meaning that as gold sold and collapsed into each yearly low, Silver as a ratio was hammered further.
But that trend has reversed, and silver has for the first time in five years outperformed gold. The chart shows the Gold Silver Ratio has turned lower, meaning that with the last big gold selloff, Silver actually outperformed gold, on a relative basis. It’s not proof of a bear market low, but we do know that every precious metals bull market saw silver dramatically outperform gold. In every case, the Gold Silver ratio turn lower as the entire metals complex went higher. From my perspective, it would appear that the ratio has broken lower and that a new downtrend has been established.
 Despite the near record increase in U.S. oil inventories last week – an increase of 13.8 million barrels – oil prices traded up on February 8 and 9 as traders pinned their hopes on a surprise drawdown in gasoline stocks, which provided some evidence of stronger-than-expected demand.
The abnormal crude stock increase took inventories close to 80-year record levels at 508 million barrels, and is another bit of damming evidence that should worry oil bulls. But the oil markets were not deterred. In fact, that has been a defining characteristic of the market in recent weeks – optimism even in the face of some pretty worrying signals about the trajectory of the market “adjustment” process.
More signs of optimism abound.
….related:

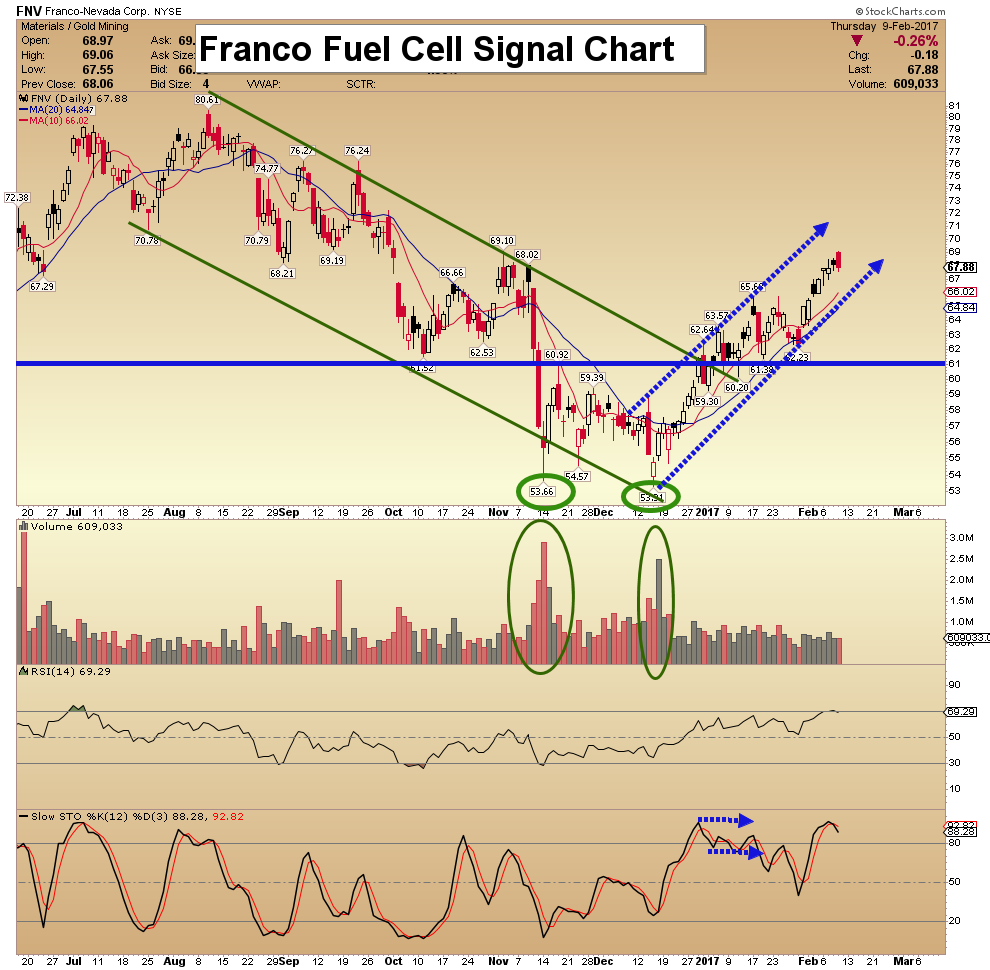
Here are today’s videos and charts (double click to enlarge):
Gold, Silver, & T-Bonds Key Charts Video Analysis


SFS Key Charts & Tactics Video Analysis

SF Juniors Key Charts & Tactics Video Analysis


SF Trader Time Key Charts Video Analysis

Morris
The SuperForce Proprietary SURGE index SIGNALS:
25 Surge Index Buy or 25 Surge Index Sell: Solid Power.
50 Surge Index Buy or 50 Surge Index Sell: Stronger Power.
75 Surge Index Buy or 75 Surge Index Sell: Maximum Power.
100 Surge Index Buy or 100 Surge Index Sell: “Over The Top” Power.
Stay alert for our surge signals, sent by email to subscribers, for both the daily charts on Super Force Signals at www.superforcesignals.com and for the 60 minute charts at www.superforce60.com
About Super Force Signals:
Our Surge Index Signals are created thru our proprietary blend of the highest quality technical analysis and many years of successful business building. We are two business owners with excellent synergy. We understand risk and reward. Our subscribers are generally successfully business owners, people like yourself with speculative funds, looking for serious management of your risk and reward in the market.
Frank Johnson: Executive Editor, Macro Risk Manager.
Morris Hubbartt: Chief Market Analyst, Trading Risk Specialist.
website: www.superforcesignals.com
email: trading@superforcesignals.com
email: trading@superforce60.com
SFS Web Services
1170 Bay Street, Suite #143
Toronto, Ontario, M5S 2B4
Canada

-
I know Mike is a very solid investor and respect his opinions very much. So if he says pay attention to this or that - I will.
~ Dale G.
-
I've started managing my own investments so view Michael's site as a one-stop shop from which to get information and perspectives.
~ Dave E.
-
Michael offers easy reading, honest, common sense information that anyone can use in a practical manner.
~ der_al.
-
A sane voice in a scrambled investment world.
~ Ed R.
Inside Edge Pro Contributors

Greg Weldon

Josef Schachter

Tyler Bollhorn

Ryan Irvine

Paul Beattie

Martin Straith

Patrick Ceresna

Mark Leibovit

James Thorne

Victor Adair