Gold & Precious Metals

Silver Market Set Up For Much Higher Price Move Than Gold

When the paper markets finally collapse, the silver market is set up for much higher price gains than gold.  Why?  Because the fundamentals show that precious metals investment demand has put a great deal more pressure on the silver supply than gold… and by a long shot.

There are three crucial reasons why the silver price will outperform the gold price when the highly inflated paper markets disintegrate under the weight of massive debt and derivatives.  While many precious metals investors are frustrated by the ability of the Fed and Central Banks to continue to prop up the markets, the longer they postpone the day of reckoning, the worse the collapse.

The first reason I wrote about in my article, Critically High U.S. Silver Supply Reliance In Jeopardy When Paper Markets Crack:

US-Net-Import-Reliance-Percentage-Of-Consumption-2015

the United States silver net import reliance as a percentage of total consumption, was 72%, versus 36% for copper and a negative 48% for gold.

This chart shows that the U.S. relied upon 72% of its domestic silver demand from foreign sources in 2015.  Thus, U.S. silver supply reliance (72%) is double that of copper (36%), while U.S. gold demand enjoyed a 48% surplus versus its domestic supply.

The second reason the silver price will surge higher than the gold price is due to the amount of physical silver, in total ounces, purchased by investors versus gold:

From 2010 to 2016, investors purchased a total of 1,505 million oz (Moz) of silver bar and coin compared to only 284 Moz of physical gold.  Thus, precious metals investors purchased five times more silver ounces, than gold ounces during this seven year time period.

Of course, the total value of physical gold investment was much higher than silver during this time period, but this tremendous amount of silver bar and coin demand has impacted the silver market much greater than the gold market.

This brings me to the third reason.  Due to the huge amount of silver bar and coin demand since 2010, the silver market suffered a net deficit of 801 Moz.  However, the 284 Moz of gold bar and coin demand did not impact the gold market the same way.  According to the World Gold Council, the gold market enjoyed a small 7.5 Moz net surplus during this time period:

While it is true that World Gold Council may be underestimating Chinese physical gold demand, and its impact on the annual surplus of deficit figures, a 7.5 Moz surplus is only 3% of the 284 Moz total gold bar and coin demand figure 2010-2016.   However, the 801 Moz net silver deficit is more than 50% of total silver bar and coin demand during that same time period.

Which means, physical silver investment demand is causing much more stress on the silver market than it is on gold.  While the silver market has been able to supplement the annual deficits with old silver coin stocks or large bars that were liquidated during the 1990’s, this is not an endless supply.

According to the data I obtained from the GFMS Team at Thompson Reuters, invested dumped a net 580 Moz of silver bar and coin on the market between 1995-1999.  Now compare that to the past five years (2012-2016) as investors purchased a net 1,152 Moz (1.15 billion oz) of silver bar and coin.

And here is the CLINCHER.  From 1985 to 2007, the total net silver bar and coin demand was a NEGATIVE 95 Moz.  Which means investors sold a net 95 Moz of silver bar and coin in that 23 year period.  However, investors purchased a net 1,785 Moz of silver bar and coin from 2008 to 2016.  This is a huge TREND CHANGE.

After the U.S. financial and economic meltdown in 2007, investors continue to purchase a record amount of silver bar and coin.  This has put severe stress on the silver market as the total net deficit since 2008 surpassed 1,155 Moz.

While the silver market will continue to supplement the ongoing annual deficits with old silver stocks, this supply is not endless.  Furthermore, the days of the TRUMP STOCK MARKET RALLY are numbered.  The last time the stock market crashed 2,000 points in the beginning of 2016, investors flocked into gold and silver in a BIG WAY.

In conclusion, the fundamentals in the silver market are setting up for a much higher price spike than gold due to the three reasons stated in the article.  The timing of these event is hard to forecast as it is difficult to pinpoint when the Fed and Central Banks lose control of their massive market intervention.  My work is not meant to provide a short term outlook on the precious metals, rather it offers fundamentals that will win out over the medium to longer term.

Precious metals investors need to look at buying and holding gold and silver the same way an individual puts money away each month in their 401K, pension plan or retirement account.  The difference between the precious metals investor acquiring PHYSICAL METAL compared to individual acquiring PAPER ASSETS or DIGITS, is one is real wealth, while the other is an IOU.

Those who transition out of PAPER-DIGIT IOU’s and into physical gold and silver before the FAT LADY SINGS, will be rewarded with much better options.

To understand why the markets may be heading for big trouble, check out my article, A Large Crack Appeared In The Global Market… And No One Noticed.

Check back for new articles and updates at the SRSrocco Report.

A Global Money Printing Competition

Feb 7, 2017

  1. With each passing day, both the technical price action and the news flow are getting more positive for gold.
  2. Double-click to enlarge this daily bars gold chart.2017feb7gold1
  3. Another great week for the world’s ultimate asset is clearly underway. A beautiful technical uptrend is now in play.
  4. Gold has also surged through resistance at $1220 and is making a beeline towards my $1250 target zone.
  5. Please  click here now. Double-click to enlarge. The US dollar has broken down from a substantial head and shoulders top formation against the Swiss franc.
  6. A small rally back towards the neckline of the pattern is likely, but the overall technical picture for the dollar is very negative.
  7. Please  click here now. Double-click to enlarge this key dollar versus yen chart.
  8. Both the yen and the franc are safe haven fiat currencies, and the “risk-on” dollar’s price action against both of them is truly horrific. That’s great news for gold, which is the ultimate safe haven.
  9. Please  click here now. Will President Trump order Janet Yellen to engage in outright money printing to devalue the dollar?
  10. I think he’ll do it, and here’s why: America’s demographics are drastically different from the demographics that were in place when Ronald Reagan got elected with a similar “Make America Great” mantra.
  11. America is now an ageing society, and both the citizens and the government are maniacally obsessed with debt. 
  12. Also, the business up cycle is nearing an end, and while immigration changes make most citizens happy, that’s not going to re-create a 1950’s society with a 15% GDP growth rate. 
  13. Sadly, Trump’s only practical tools to reduce the huge debt burden on the backs of both citizens and government are money printing and gold revaluation.  
  14. Please  click here now. FOREX reserves in China may be about to become a very powerful gold price driver.
  15. To combat the disintegration of its FOREX reserves, China may have to float the yuan, or engage in significant money printing.
  16. Please  click here now. Double-click to enlarge this spectacular daily bars GDX chart.
  17. Gold stocks are roaring higher because of Trump’s dollar bashing and even more because of the end of global deflation. 
  18. GDX itself is sporting a beautiful momentum-oriented crossover buy signal on my 14,7,7 Stochastics oscillator.
  19. I suggested that gold stock enthusiasts should be on the lookout for that signal, and now it is in play. 
  20. GDX should run to $26, and perhaps to $27.50, as gold marches from $1220 towards $1250.
  21. For even better technical news about most gold stocks, please  click here now. Double-click to enlarge. Regardless of whether GDX makes it to $27.50 or not on this rally, the coming pullback is simply going to create a beautiful right shoulder of a large inverse head and shoulders bottom pattern!
  22. The target of the pattern is the $32 area, and I think GDX has a very good chance of surpassing that high.
  23. I suggested that 2017 would be all that gold stock investors could ever ask for, and that is certainly playing out in textbook fashion. Rallies are strong. Pullbacks are orderly and modest. 
  24. US dollar bulls will likely be hit hard by Donald Trump’s dollar devaluation team. Governments around the world may be poised to enter not just a fiat devaluation competition, but a money printing competition. There are no winners in such a competition, except for gold, silver, and associated stocks! 

Thanks! 

Cheers
st 

Feb 7, 2017
Stewart Thomson  
Graceland Updates
website: www.gracelandupdates.com
email for questions: stewart@gracelandupdates.com 
email to request the free reports: freereports@gracelandupdates.com

Graceland Updates Subscription Service: Note we are privacy oriented. We accept cheques. And credit cards thru PayPal only on our website. For your protection we don’t see your credit card information. Only PayPal does.

Subscribe via major credit cards at Graceland Updates – or make checks payable to: “Stewart Thomson” Mail to: Stewart Thomson / 1276 Lakeview Drive / Oakville, Ontario L6H 2M8 / Canada

Stewart Thomson is a retired Merrill Lynch broker. Stewart writes the Graceland Updates daily between 4am-7am. They are sent out around 8am. The newsletter is attractively priced and the format is a unique numbered point form; giving clarity to each point and saving valuable reading time.

Risks, Disclaimers, Legal
Stewart Thomson is no longer an investment advisor. The information provided by Stewart and Graceland Updates is for general information purposes only. Before taking any action on any investment, it is imperative that you consult with multiple properly licensed, experienced and qualifed investment advisors and get numerous opinions before taking any action. Your minimum risk on any investment in the world is 100% loss of all your money. You may be taking or preparing to take leveraged positions in investments and not know it, exposing yourself to unlimited risks. This is highly concerning if you are an investor in any derivatives products. There is an approx $700 trillion OTC Derivatives Iceberg with a tiny portion written off officially. The bottom line:

Are You Prepared?

With precious metals and mining shares rallying as Bob Moriarty predicted at the end of December, after the sector reached the worst sentiment in 29 years, we thought it would be a good time get Mr. Moriarty’s latest thoughts on things. A wide ranging discussion ensued which included Bob’s thoughts on President Trump, a few individual stock picks, and even some timeless investment wisdom. Without further ado here is Energy & Gold’s first conversation of 2017 with 321gold editor & founder Bob Moriarty.

….continue reading HERE

Gold and Reflation

In recent years, deflation was considered one of the biggest threats to the global economy. These fears are vanishing. As deflation becomes the thing of the past (there was even the end of deflation in Japan at the end of 2016), reflation is now attracting the attention of investors. What does it mean? According to the most popular definition, reflation is an increase in economic activity and inflation, usually caused by using inflationary measures to reverse deflationary trends. We simply take reflation to be acceleration in the rate of inflation, i.e. the opposite of disinflation, which is a decrease in the rate of inflation.

Is the inflation rate increasing in the world economy? Well, let’s look at the chart below. As one can see, inflation has recently risen both in the U.S. and the euro area. In the former, the annual inflation rate has increased from 0 percent in September 2015 to 2.1 percent in December 2016. In the euro area, the acceleration has come a bit later due to stronger deflationary forces, but the inflation rate has risen from -0.24 percent in April 2016 to 1.1 percent in December 2016. In particular, the consumer prices rose 1.7 percent in December in Germany, the euro area’s growth engine. This was the fastest pace since July 2013.

Chart 1: The CPI rate year-over-year for the U.S. (blue line) and the euro area (red line) over the last ten years.
43616 a

Inflation expectations also have risen significantly since the summer of 2016, as one can see in the chart below.

Chart 2: The monthly averages of U.S. spot inflation expectations derived from 10-year Treasuries (red line) and the forward inflation expectations derived from 5-year and 10-year Treasuries (blue line) over the last ten years.
US Inflation Expectations

What are the drivers of the current reflation? First, global economic growth and industrial production have accelerated. According to the Fulcrum’s latest estimations, the global growth rate jumped to 4.4 percent in December 2016, the fastest pace since April 2011. Similarly, the Goldman Sachs Global Leading Indicator has reached its highest point since December 2010. Even the World Bank said that the growth forecast in 2017 showed “unusually strong pick up in global growth”. And U.S. manufacturing rose in December at its fastest pace in two years, as the chart below shows. Manufacturing also jumped in the U.K. and in the euro area in the fourth quarter of 2016, further improving in China as well.

Chart 3: US ISM Manufacturing Purchasing Managers Index over the last ten years.
US ISM Manufacturing Index

Second, commodity prices have rebounded. The price of oil has doubled, rising from the bottom $26.11 in February 2016 to $53.75 at the end of year, while copper prices have jumped about 15 percent since November 2016. It may be an important signal, as copper is considered a leading indicator of the global economy.

Chart 4: The monthly average of the price of oil (red line, left axis, WTI, price per barrel) and the price of copper (blue line, right axis, price per ton) over the last five years.
Oil and Copper Prices

To sum up, reflation is really happening. Economic growth has accelerated, which increased the demand for commodities. The rise in commodity prices has fueled the uptick in the headline inflation data. But the current macroeconomic environment and market sentiment are negative for gold prices. The yellow metal shines during economic slowdowns when investors are in a gloomy mood. This was the case at the beginning of 2016 when China was in the doldrums and markets were concerned about prospects for the global economy. Now, investors have adopted a much more optimistic stance as reflation is unfolding. As real interest rates rose, and risk aversion diminished, gold’s appeal tarnished. Therefore, if the reflation is lasting, the fundamental outlook for gold should be bearish. On the other hand, if it turns out to be another unstable short-term spike in global activity, then gold may rally again. It is difficult to determine with certainty the character of the global uptick in economic activity, but the current indicators are improving in a way not seen since the end of the financial crisis. The Trump rally may be short-lived, but reflation actually started before the U.S. presidential election (see the charts above). It implies that reflation could stay with us, even if the Trumponomics fails, which would be negative news for the gold bulls. They also hope that inflation will boost the price of gold, but the inflationary pressure does not pose a threat for the global economy so far. However, there is, of course, the risk of inflation getting out of control – in that scenario, gold may shine, although investors should remember that it is not a perfect inflation-hedge.

Thank you.

….related: Embry – A Jaw-Dropping 8.6 Million Ounces Of Paper Gold Longs Just Blew Up At The Comex!

Long Liquidation Looks Bullish for Gold

Rudi Fronk and Jim Anthony, cofounders of Seabridge Gold, examine the gold COMEX data and find it supports a bottom in the gold correction.

Fronk1-31-17cover

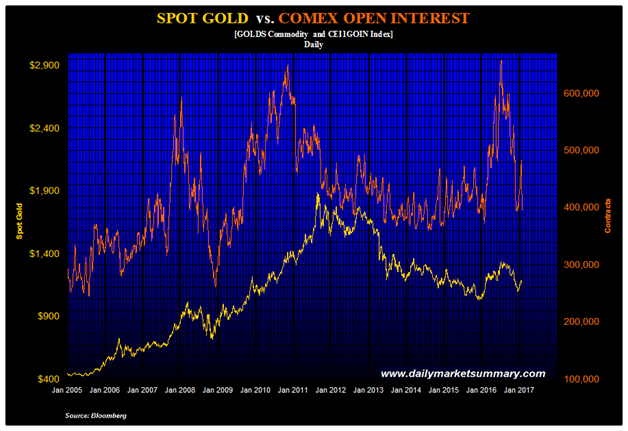
Last week we thought that we had seen the bottom in the gold correction. More evidence of that came Monday with the release of Friday trading data from COMEX. Last week, as the gold price began to fall towards its 50 day moving average where corrections usually end or breakdowns can begin, COMEX Speculators blew an enormous number of contracts out the window.

At the close last Monday, the Open Interest on COMEX was 483,408 contracts, a total which had grown quickly as the gold price advanced from the December low of $1124. At the Friday close, the Open Interest had fallen to just 395,599 contracts, a reduction of an enormous 87,809 contracts or 18.1% in just four trading days. Clearly, a large number of players panicked and liquidated BUT the price never even touched the 50 dma at $1178.

What happened? Was it fear of this week’s Fed meeting (statement this Wednesday)? Or the employment report this coming Friday? We don’t know. But it was the fastest, most aggressive liquidation we have seen in years. And it did not break gold. We think that’s likely bullish.

Related Articles


Want to read more Gold Report articles like this? Sign up for our free e-newsletter, and you’ll learn when new articles have been published. To see a list of recent articles and interviews with industry analysts and commentators, visit our Streetwise Interviews page.

Disclosures:
1) Statements and opinions expressed are the opinions of Rudi Fronk and Jim Anthony and not of Streetwise Reports or its officers. The authors are wholly responsible for the validity of the statements. Streetwise Reports was not involved in any aspect of the content preparation. The authors were not paid by Streetwise Reports LLC for this article. Streetwise Reports was not paid by the authors to publish or syndicate this article. 
2) Seabridge Gold is a sponsor of Streetwise Reports. Streetwise Reports does not accept stock in exchange for its services. The information provided above is for informational purposes only and is not a recommendation to buy or sell any security.
3) This article does not constitute investment advice. Each reader is encouraged to consult with his or her individual financial professional and any action a reader takes as a result of information presented here is his or her own responsibility. By opening this page, each reader accepts and agrees to Streetwise Reports’ terms of use and full legal disclaimer. This article is not a solicitation for investment. Streetwise Reports does not render general or specific investment advice and the information on Streetwise Reports should not be considered a recommendation to buy or sell any security. Streetwise Reports does not endorse or recommend the business, products, services or securities of any company mentioned on Streetwise Reports.
4) From time to time, Streetwise Reports LLC and its directors, officers, employees or members of their families, as well as persons interviewed for articles and interviews on the site, may have a long or short position in securities mentioned. Directors, officers, employees or members of their families are prohibited from making purchases and/or sales of those securities in the open market or otherwise during the up-to-four-week interval from the time of the interview/article until after it publishes.

Chart provided by the authors.