
Gold & Precious Metals

As it is quite often said (but just as often forgotten when things get volatile), no market can move up or down in a straight line. There have to be corrections along the way as some traders cash in their profits, others get scared out of their positions etc. The question is – where (at what price) is such a reversal likely to take place. Focusing on news and fundamental analysis alone will not provide you with an answer here, simply because the markets are not logical in the short term, but emotional (it is also the case in the medium term, but to a smaller extent). Consequently, we need to apply technical tools to determine what is the most likely level at which the price will reverse. One of the most useful tools in doing that are the Fibonacci retracements. Out of those retracements, there are 3 classic ones that are very useful for precious metals, currencies and other markets: 38.2%, 50%, and 61.8%. The reason we are writing about the above is that the important 61.8% retracement was just reached in many important markets and the implications are also important. Let’s take a look at the charts for more details (charts courtesy of http://stockcharts.com).

The above chart shows the Japanese yen, which has been moving in tune with gold, especially this year. The decline in yen started when it reached the 38.2% Fibonacci retracement based on the long-term decline (thus confirming the usefulness of the Fibonacci retracements on this market) and it now reached a 61.8% retracement, without a bigger correction since the decline started. This makes a temporary upswing here very likely. Since yen and gold moved in tune, the above also has bullish implications for gold in the short run.
While we’re discussing the Japanese currency, let’s also look at the Japanese stock market, which has been moving in the opposite way to gold.

We saw a breakout in the value of Nikkei 225, but it never moved back to the previously broken declining line and we haven’t seen a bigger correction since the rally started in June. With the 61.8% retracement being reached, it’s quite likely that the Nikkei will correct, and thus a short-term rally in gold seems rather likely.

Gold moved to its 61.8% Fibonacci retracement ($1,172) as well and it even attempted to break below it on Thursday. The breakdown was not successful as, at the moment of writing these words, gold is already back above $1,175. Invalidations of breakdowns are bullish phenomena and this one doesn’t appear to be much different.
Besides, mining stocks once again refused to move below previous lows.
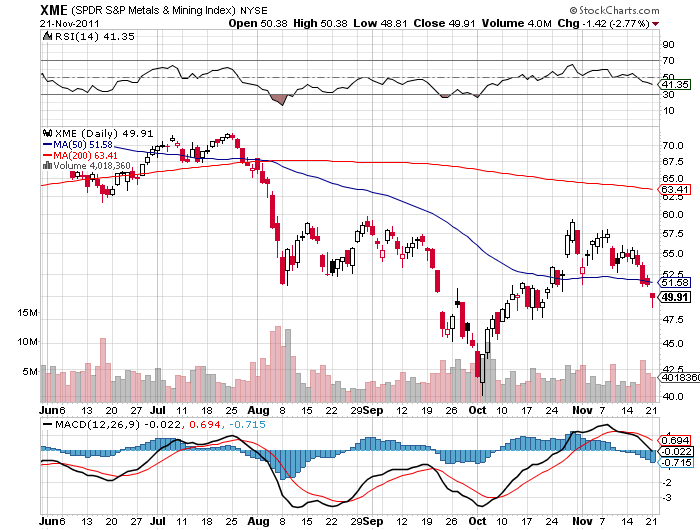
Gold stocks and silver stocks remain below their previous lows and also within the trading channel – there was no breakout, despite a move lower in gold. The strength of the miners is also a bullish sign for the short term (and only for the short term).
Moreover, the USD Index could still correct in the short term and what we wrote about it yesterday, remains up-to-date:
The USD Index moved higher, but the daily rally didn’t change anything. The correction that we’ve seen recently is still quite small and it doesn’t appear to be enough to cool down the traders’ emotions. Please note that the rally that we saw in October was smaller than the November one and it was followed by a much more significant corrective downswing than what we’ve seen so far. Consequently, it would be natural to expect the corrective downswing to be equal or bigger than what we saw in late October and early November.
Moreover, the last several trading days formed a bearish head-and-shoulders pattern in the USD Index. The implications are bearish and the target – based on the size of the head – is at about 99.50. Still the other support levels suggest that the bottom will be formed higher, so we are not viewing 99.50 as our official prediction, even though it also could stop the decline once it is seen.
Summing up, even though the medium-term trend in the precious metals market remains down (as multiple bearish indications for the medium term remain in place), it appears that a combination of bullish factors (support levels were reached in gold once again, silver and mining stocks showed strength; a long-term resistance level was almost reached in the USD; the 61.8% Fibonacci retracements were reached in the Japanese yen and Nikkei) makes the short-term outlook bullish. It appears that we will see an upswing in the precious metals sector within a week or so.
The above estimations are based on the information that we have available today (Dec. 2, 2016). We will be monitoring the market for opportunities and report to our subscribers accordingly. If you’d like to join them, we invite you to subscribe to our Gold & Silver Trading Alerts today. If you’re not ready to subscribe today, we invite you to sign up to our free gold mailing list – you’ll receive our Gold & Silver Trading Alerts for the first 7 days as a starting bonus.
Thank you.
Przemyslaw Radomski, CFA
Founder, Editor-in-chief, Gold & Silver Fund Manager
Sunshine Profits – Free Signup
* * * * *
All essays, research and information found above represent analyses and opinions of Przemyslaw Radomski, CFA and Sunshine Profits’ associates only. As such, it may prove wrong and be a subject to change without notice. Opinions and analyses were based on data available to authors of respective essays at the time of writing. Although the information provided above is based on careful research and sources that are believed to be accurate, Przemyslaw Radomski, CFA and his associates do not guarantee the accuracy or thoroughness of the data or information reported. The opinions published above are neither an offer nor a recommendation to purchase or sell any securities. Mr. Radomski is not a Registered Securities Advisor. By reading Przemyslaw Radomski’s, CFA reports you fully agree that he will not be held responsible or liable for any decisions you make regarding any information provided in these reports. Investing, trading and speculation in any financial markets may involve high risk of loss. Przemyslaw Radomski, CFA, Sunshine Profits’ employees and affiliates as well as members of their families may have a short or long position in any securities, including those mentioned in any of the reports or essays, and may make additional purchases and/or sales of those securities without notice.
 People never intend to bring disasters upon themselves.
But they sometimes put themselves in situations in which disaster is the only way out.
The War Between the States was supposed to be quick and decisive.
The glorious histories of the war were already written – at least in the minds of the combatants – by the time of the First Battle of Bull Run.
There would be a few heroic charges; Napoleon’s Marshal Ney would have nothing on the dashing Confederate generals in their gray and red tunics.
Mounted on their fine Tennessee horses, waving their swords and shouting encouragement to their cavalry, they would sweep the enemy from the field… send him fleeing back across the Potomac… and the war would be over.
But even authors often don’t know how their stories will turn out.
Events and personalities take over. Between the first chapter and the final one, there are twists and turns that few expect. The hero turns out to have a fatal flaw. Circumstances weren’t what they thought. The enemy had surprises.
And then, at the end, the great victory turns into a nightmare defeat.
No Surrender
Once war is underway, the warriors stop thinking about peace. Instead, they focus on winning the war.
Then they can’t stop…
The coming disaster is financial… and economic. The authorities are determined to win a war: a war against markets.
With $35 trillion in excess debt in the U.S. alone, they figure they can’t afford to lose. They’re right. But they can’t win, either.
The big monetary guns blast away. Janet Yellen threatens to make peace with the credit markets. But it is just an idle war rumor. She can’t make peace; she can only surrender. Unconditionally.
And if the feds abandon their artificially low interest rates, it will be impossible to finance so much debt. The war will be lost.
And now, the people turn their lonely eyes to Field Marshal Trump… and turn their hopes to fiscal stimulus – deficit spending, in other words.
Monetary stimulus works by lowering the cost of the fake money. In a free-market economy, borrowers compete for scarce savings and discover honest interest rates. In a Fed-managed economy, at war with free markets, central-bank Ph.D.s set interest rates by committee, offering ersatz savings at artificially low prices.
People don’t know the new money is phony. They don’t care that no one earned it and no one saved it… and that there is nothing behind it other than swamp gas. It looks like the real thing. It acts like the real thing.
But if monetary policy is a kind of precision bombing, fiscal stimulus is more like a full frontal assault.
Money enters the economy like Sherman’s cavalry entering Atlanta. Fiscal stimulus goes more directly into the hands of the people. So, it tends to raise consumer prices more than monetary stimulus, which hangs around Wall Street, raising only financial asset prices.
But the underlying aim for each is the same: Put more fake money into the system. And so is the purpose: Prevent the market from correcting the fake money the feds put into the system the last time.
More Money, More Debt
That’s how a credit money system works: More money means more debt.
As the debt builds up, the system needs more money… aka more debt… just to keep it from losing the war. But in order to add more money, someone has to be able to go further into debt.
Households and businesses are tapped out. They are already at “peak debt,” with little collateral and little capacity to borrow more or use the borrowed funds effectively.
That leaves only the feds. They are the only ones who can still borrow substantial sums of money. No one has to worry about not being paid back by the government; after all, the feds have a printing press.
So, the feds are preparing a major offensive. And investors are writing their books. All with happy endings.
In January, their hero, Donald J. Trump, will present a program of tax cuts and spending increases. Commentators will tell us how the tax cuts may “pay for themselves” as they spur additional economic activity.
They will say the increased infrastructure “investments” will make the economy more productive. They will mention that we need more inflation as a way to fight our growing debt load!
Higher federal spending will put people to work in the shipyards and malls. It will cause prices to go up, reducing the weight of debt. People will spend more and owe less!
But wait… What goes wrong?
Tune in next week to find out…
Regards,
Bill
Market Insight
BY NICK GIAMBRUNO, SENIOR ANALYST, CRISIS INVESTING
I walked through Piazzale Loreto during a recent trip to Italy, which is suffering its worst economic downturn since 1945. And I realized that Italians are angrier now than they’ve been since the reign of Benito Mussolini.
Italy has had no productive growth since 1999. Real GDP per person is smaller than it was at the turn of the century.
That’s almost two decades of economic stagnation. By any measure, the Italian economy is in a deep depression. And things will probably get much worse.
It’s no surprise Italians are in a revolutionary mood…
The Five Star Movement (M5S) is Italy’s new populist political party. It’s anti-globalist, anti-euro, and vehemently anti-establishment. It doesn’t neatly fall into the left–right political paradigm.
M5S has become the most popular political party in Italy. It blames the country’s chronic lack of growth on the euro currency. A large plurality of Italians agrees.
M5S has promised to hold a vote to leave the euro and reinstate Italy’s old currency, the lira, as soon as it’s in power. That could be very soon.
Given the chance, Italians probably would vote to return to the lira. If that happens, it would awaken a monetary volcano.
The Financial Times recently put it this way:
An Italian exit from the single currency would trigger the total collapse of the eurozone within a very short period.
It would probably lead to the most violent economic shock in history, dwarfing the Lehman Brothers bankruptcy in 2008 and the 1929 Wall Street crash.
If the Financial Times is even partially right, it means a stock market crash of historic proportions could be imminent. It could devastate anyone with a brokerage account.
Here’s how it could all happen…
On December 4, Italian Prime Minister Matteo Renzi’s current pro-EU government is holding a referendum on changing Italy’s constitution.
In effect, a “Yes” vote is a vote of approval for Renzi’s government.
A “No” vote is a chance for the average Italian to give the finger to EU bureaucrats in Brussels.
Given the intense anger Italians feel right now, it’s very likely they’ll do just that.
According to the latest polls, the “No” camp has 54% support and all of the momentum. Even prominent members of Renzi’s own party are defecting to the “No” side.
If the December 4 referendum fails, Renzi has promised to resign. Even if he doesn’t, the loss would politically castrate him. In all likelihood, his government would collapse. (Italian governments have a short shelf life. There have been 63 since 1945. That’s almost a rate of a new government each year.)
One way or another, M5S will come to power. It’s just a matter of when. If Renzi’s December 4 referendum fails—and it looks like it will—M5S will likely take over within months.
Once it’s in power, M5S will hold a referendum on leaving the euro and returning to the lira. Italians will likely vote to leave.
Italy is the third-largest member of the eurozone. If it leaves, it will have the psychological effect of yelling “Fire!” in a crowded theater. Other countries—notably France—will quickly head for the exit and return to their national currencies.
Think of the euro as the economic glue holding the EU together. Without it, economic ties weaken, and the whole EU project unravels.
The EU is the world’s largest economy. If it collapses, it would trigger an unprecedented global stock market crash. That’s how important Italy’s December 4 referendum is. It would be the first domino to fall.
|
Almost no one else is talking about this. That’s why I just spent several weeks in Italy, taking the pulse of the country.
Italy’s December 4 referendum could make or break your wealth this year. If it fails, the EU, which has the world’s largest economy, will likely fall apart… triggering an epic stock market crash.
It could either wipe out a big part of your savings… or be the fortune-building opportunity of a lifetime.
Best,
 |
Nick Giambruno
Senior Analyst, Crisis Investing
“History shows the only place for interest rates to go from here is higher.”
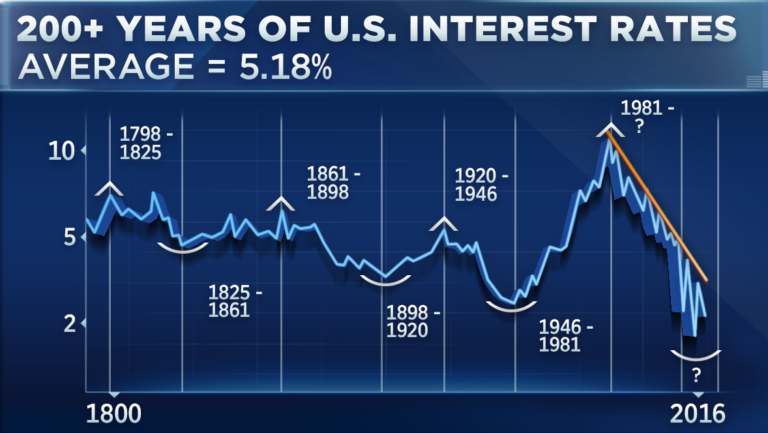
Examine the above chart of interest rates for 200 years.
- Rates rise and fall in long cycles, 20 to 40 years from a peak to a trough.
- Important highs occurred in 1920 and 1981.
- Important lows occurred in 1946 and probably 2016.
- Current rates are the lowest in 200 years. Some analysts have said the lowest in 5,000 years.
Examine the chart of annual silver prices since 1913 on a log scale. The upward trend in silver prices is clear and will continue as long as debt is increasing in our fiat currency system.
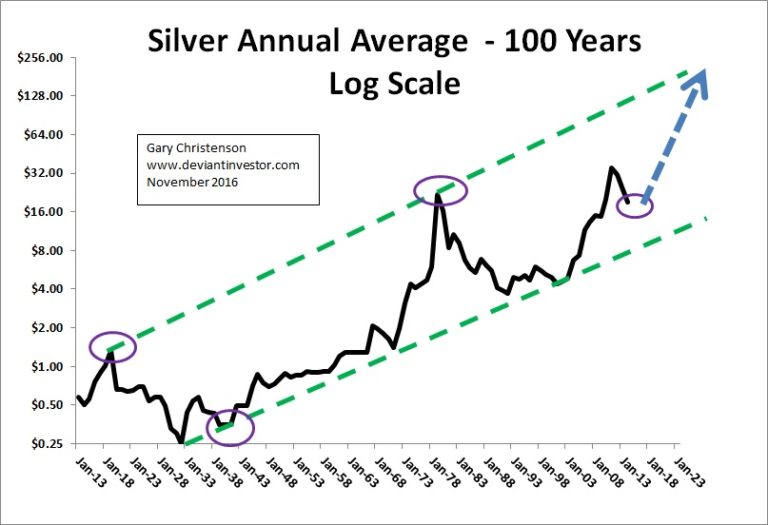
INTEREST RATES AND SILVER PRICES:
Refer back to the 200 year chart of interest rates and the 100 year chart of silver prices. Note the correlation between interest rate highs and silver price highs and similar lows (ovals).
Highs: Interest rates 1920 – silver 1919
Highs: Interest rates 1981 – silver 1980
Lows: Interest rates 1946 – silver 1932 and 1941
Lows: Interest rates 2016 – silver 2015
Interest rates rose approximately 35 years from 1946 – 1981 and fell for 35 years from 1981 – 2016. Silver prices could rise for several decades, along with interest rates, as the dollar is devalued further, silver is aggressively used for industrial applications, investment demand increases, and perhaps … the world is forced to return to a monetary system tied more closely to gold or silver.
RISING INTEREST RATES:
We also know that interest rates are the “cost of money” and have been steadily pushed lower for 35 years by government and central bank actions. Further, the bond market rises as interest rates fall (good times for Wall Street) and falls as interest rates rise. Higher rates mean the $200 trillion or so of debt is more costly to service – we know it will never be paid back in current dollars – but interest to service the debt is more onerous. Budgets are squeezed, projects are curtailed, weak businesses go bankrupt, stock buy-backs are reduced and all those derivatives that are tied to interest rates — well, it won’t be good for many of them…
The Resolution:
- Let it all crash. Admit the governments of the world have no intention of repaying the debt (at least since 2008), let the depression begin, destroy economies, governments, businesses, and millions of lives including the politicians and central bankers who created unsustainable systems and encouraged deficit spending.
or
-
Monetize debt, fire up the printing presses, launch the Bernanke helicopters, and blame someone for the inflationary consequences later.
What politician, banker, Wall Street CEO, central banker, or corporation CEO will choose the crash option? Hence expect the inflation option. For review:
In 1913 a dollar bought almost 1/20 ounce of gold, 8 gallons of gasoline, and 14 loaves of bread.
Today we all know the devalued dollar buys much less. In round numbers our politicians and central bankers have devalued the dollar by perhaps 98%. Expect the devaluation of all fiat currencies to accelerate.
During the 8 long years of the Obama administration total official U.S. government debt has approximately doubled, from about $10 trillion to about $20 trillion. Expect more debt, lots more debt. LOTS MORE DEBT!
What does this suggest about silver prices?
- More debt means more dollars are in circulation and that means erratically higher prices for most items including bread, energy, health care and silver.
- Bond monetization, “printing” dollars, and helicopter money will suggest to everyone – eventually – that the dollar is not a reliable store of value and has not been since 1913. When that realization is finally common knowledge, people will act to protect their wealth and purchasing power. Silver and gold will perform better than crashing bonds, over-valued stocks and promises from politicians.
- Silver and gold are insurance against crashing markets, central bank and government manipulations, devaluing currencies, collapsing “Ponzi” schemes in debt and currency markets, and more.
- The dollar has lost about 98% of its value in 100 years. Silver and gold have, on average, retained their value. Expect their current low prices to spike higher as fiat currency declines toward its intrinsic value.
HYPERINFLATIONS:
Many hyperinflations have occurred in the past 100 years. Example: Argentina has devalued against the U.S. dollar by 10 trillion to one since about 1950. The continued devaluation of the U. S. dollar, loss of reserve currency status, and coming massive “stimulus” spending could result in hyperinflation in the United States. Silver will reach incredible prices in such a disastrous situation. Few if any will be pleased with the consequences of hyperinflation, but owning silver will help mitigate the trauma.
Expect interest rates and silver prices to rise, along with debt, accelerating currency devaluations, and economic craziness until a massive reset occurs.
Gary Christenson
The Deviant Investor


-
I know Mike is a very solid investor and respect his opinions very much. So if he says pay attention to this or that - I will.
~ Dale G.
-
I've started managing my own investments so view Michael's site as a one-stop shop from which to get information and perspectives.
~ Dave E.
-
Michael offers easy reading, honest, common sense information that anyone can use in a practical manner.
~ der_al.
-
A sane voice in a scrambled investment world.
~ Ed R.
Inside Edge Pro Contributors

Greg Weldon

Josef Schachter

Tyler Bollhorn

Ryan Irvine

Paul Beattie

Martin Straith

Patrick Ceresna

Mark Leibovit

James Thorne

Victor Adair