
Gold & Precious Metals

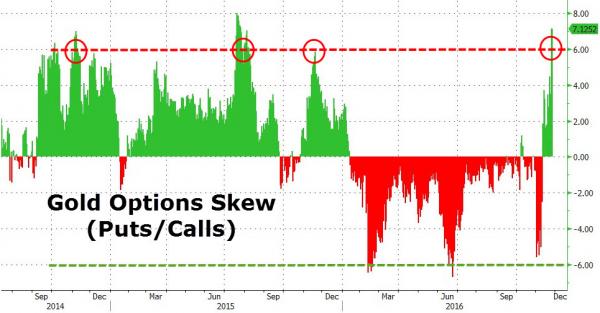
After a year of almost uninterrupted bullish bias in precious metals options markets, gold skews (the ‘price’ of put protection over calls) has exploded to its highest (most bearish) leves since July 2015.
As Bloomberg reports, bearish options hedging against a 10 percent price drop in the biggest gold exchange-traded fund cost the most since July 2015 relative to calls betting on a 10 percent jump.
If you’re serious about making money from investing in the financial markets, you need to be able to read the crowd… and go against it.
Let me give you an example… Currently one of the consensus views is that the Gold rally is over and gold is dead as an investment.
Right off the bat, you know this sentiment is at an extreme. Despite its recent sell-off, Gold is still crushing stocks in terms of performance year to date.

This is a massive “tell”: people believe Gold is doing very badly when in reality it’s nearly doubling stocks’ performance year to date.
Another “tell” is technical in nature. Investor sentiment is acting as though Gold is dead… when in reality Gold is both oversold and about to stage a bullish crossover (when the 50-wma breaks above the 200-wma).

Put another way, Gold is due for a snapback bounce at the very least… at the exact same time that it’s about to stage a massively bullish long-term signal.
This is a textbook recipe for a “rip your face off” rally.
Again, with Gold today we’ve got:
- Terrible sentiment.
- An oversold security.
- A massively bullish long-term buy signal about to trigger.
You can ignore this all you like. But all of the above suggest Gold will be much higher in the coming weeks.
Best Regards
Graham Summers – Phoenix Capital Research
….related:
Posted Nov. 22, 2016, 11:54 AM
In yesterday’s alert we wrote that staying on the sidelines appeared to be a good idea for the next several days as the short-term outlook became more bullish, even though the medium-term outlook became more bearish (due to the USD’s breakout). Actually, at the moment when our yesterday’s alert was sent, gold’s and silver’s prices were below the entry prices, so the position was closed at a profit.
In yesterday’s session, not much changed – the USD declined a bit, while the opposite was the case with gold, silver and mining stocks. Nothing extraordinary took place.
However, today’s pre-market trading is more interesting. The USD Index is basically flat, but silver jumped up almost $0.30, showing strength. Gold is up as well. The above relative price moves confirm that the precious metals sector really wants to move higher in the short term, and that until it does, daily declines will be limited. Let’s take a look at the USD Index chart (charts courtesy of http://stockcharts.com).
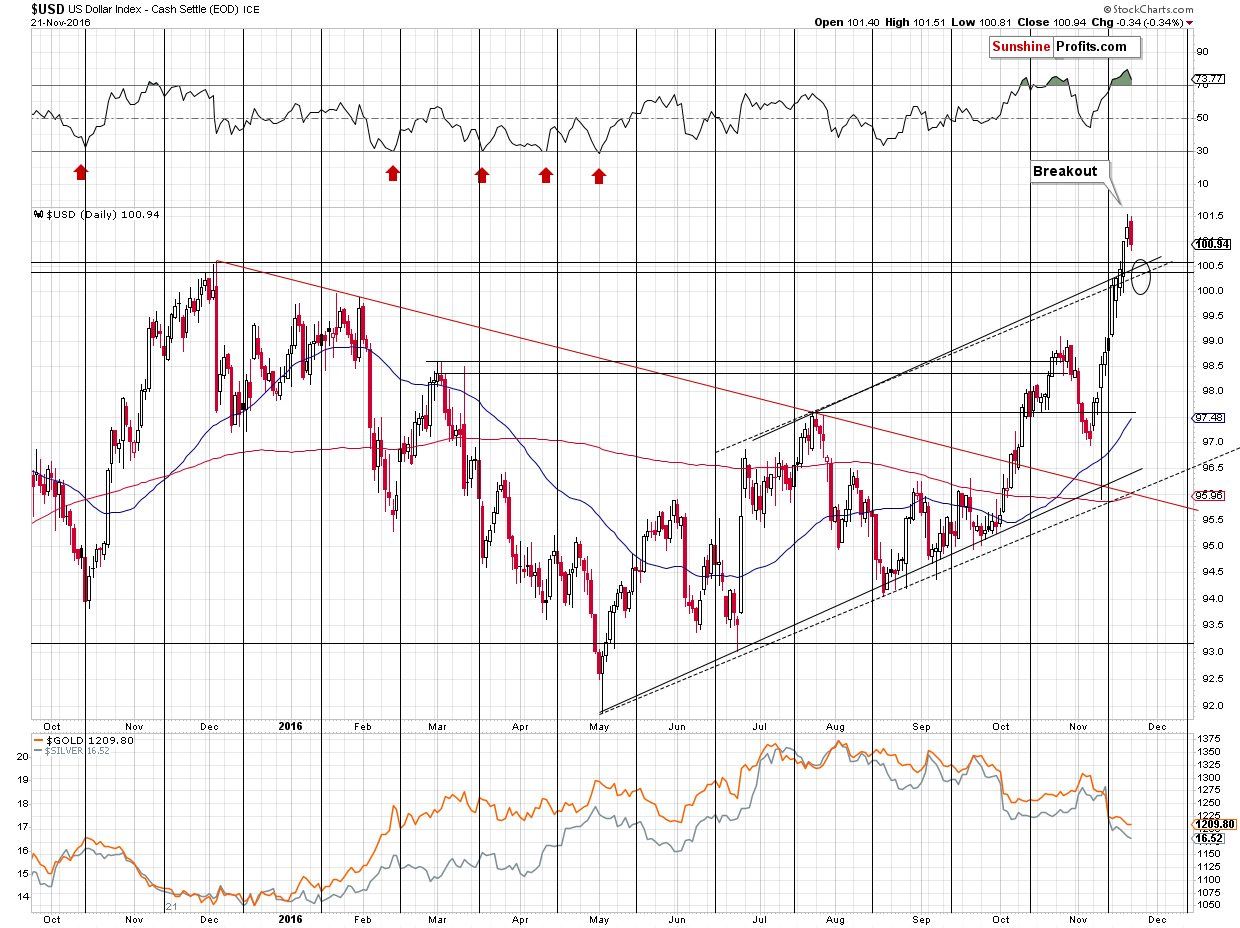
What’s likely to happen next? The USD Index is likely to verify the breakout above the previous highs. The support levels are between 100 (an extremely round number) and 100.60 (intra-day December 2015 high), which is a quite wide area, so the specific target is unclear, so it doesn’t seem that we can base our entry point in metals and miners on the USD Index alone. We can, however, look for confirmations from the precious metals themselves once the USD is within the target area.
Two very important confirmations would be: the miners’ underperformance and silver’s very short-term outperformance. Another thing would be gold moving a bit above its 300-day moving average (for instance to $1,250).

In addition to moving to the previous 2016 lows, gold moved to the 300-day moving average and the declining red support line – the upper border of the previous trading channel. Consequently, it’s no wonder that we saw a pause here. Does the above imply that a big turnaround will be seen shortly? Not necessarily. The analogy to 2013 remains in place, so we could see some strength, but it’s likely to be limited. In the case of gold, we can expect a rally that is similar to the rally that took place at the end of 2012 and in early 2013. Back then gold moved a bit above the 300-day moving average and to a round number ($1,700). At this time, an analogous move, would take gold to about $1,250. $1,300 could also be seen, but we don’t view it as likely – the move higher would be too big to be similar to what happened in early 2013 and it doesn’t seem that the USD Index would decline significantly enough, to trigger such a big rally in gold.
While we’re at gold’s long-term chart, let’s take a moment to once again briefly go through the “why isn’t the bottom already in” question. In short, because the gold market was not hated enough back in late 2015. Major tops and major bottoms are formed when everyone and their brother gets on a given side of the market. At the top, everyone wants to buy. At the bottom, everyone wants to sell and thinks that the price will fall much further. We’ve been monitoring surveys, predictions, headlines, website traffic, popularity of gold-related search terms in search engines and it doesn’t seem that gold is really hated enough for this to be the final bottom. Naturally, local tops and bottoms need to take place every now and then regardless of the bigger trend, as no market can move up or down in a straight line. There were local bottoms in 2013, in 2014 and in 2015. Why would the December 2015 bottom be THE bottom if it weren’t accompanied by extreme pessimism?
Some may say that the size of the rally that followed confirms that it was indeed the final bottom. We disagree – there were 2 very good reasons for this temporary upswing to be bigger than the previous ones – the NIRP remarks that were not followed by any NIRP-related action and the Brexit surprise (Brexit hasn’t really happened up to this day). If these events hadn’t happened, gold’s rally would have probably been no different than the previous local rallies that we saw in 2013, 2014 and earlier in 2015.
So, if the final bottom is not yet in, then where is gold likely to bottom? This is where technical levels come into play. We have two target areas – one is close to the $1,000 level and the second one is close to the $900 level. These targets will be updated as we move closer to them, but that’s what appears most likely at this moment. Why the former? A combination of a declining medium-term support line and $1,000 as a very round number provides good support. Why the second? There is one reason, but an extremely important one – the 61.8% Fibonacci retracement level. The Fibonacci retracement levels have proven to be a very useful tool in case of the precious metals market and the 61.8% retracement is one of the most important, classic ones. The other 2 (out of 3): the 38.2% retracement and the 50% retracement were already broken, so now the 61.8% retracement becomes a natural, very important target. The important thing is that as long as this level is not broken decisively and the breakdown is not confirmed, from the technical point of view, the entire 2011 – 2016/2017 decline will simply be a big correction after the 2000 – 2011 rally, and not a beginning of another bear market.
Summing up, we are likely to have good technical and fundamental reasons to think that gold will move much higher in the coming years, but we also have good technical reasons to think that gold will move lower in the following months. As far as the short term is concerned, it still seems that we could see higher prices, with $1,250 as a target for a top in gold as the USD Index verifies its recent breakout. It seems likely that the above would create a good opportunity to re-enter speculative short positions and further increase our profits, however, it’s too early to say so today.
The above estimations are based on the information that we have available today (Nov. 22, 2016). We will be monitoring the market for opportunities and report to our subscribers accordingly. If you’d like to join them, please use this link to subscribe now.
Thank you.
Sincerely,
Przemyslaw Radomski, CFA
Founder, Editor-in-chief, Gold & Silver Fund Manager

While we expected additional weakness in Gold and gold stocks (weeks ago) we did not quite expect the kind of selling the sector experienced in the wake of Donald Trump’s election victory. The market reacted by sending bond yields dramatically higher which resulted in stronger real interest rates, which is fundamentally negative for precious metals. This has created significant technical damage in the sector and has potentially thrown the 2016 bull off course.
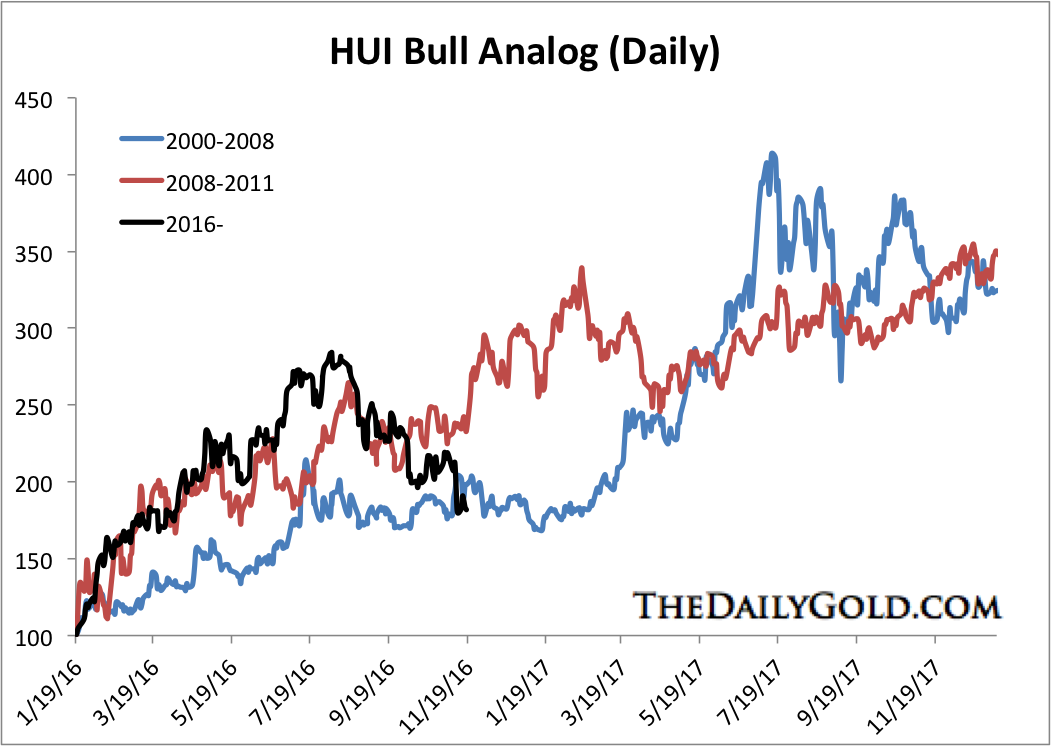
Our first chart shows how and when this bull market went off course. Below we compare the current rebound in Gold to some of those from the past. As you can see, the 2016 rebound was well on course until the second half of September. That is when historical bull markets pushed higher. Unfortunately, Gold broke lower and has continued to trade lower. It has diverged from its bull market course.

Our next chart pertains to the bull market in gold stocks and specifically the HUI Gold Bugs Index. The chart shows that this needs to be an important low for the bull market to remain intact. While I expect a rebound very soon, I have some doubts that the low will hold.
Next we compare the current correction in the HUI to past bull market corrections. Like the last analog, this one shows the gold stocks need to begin a big rebound for their bull market to remain intact. Both analogs show that the gold stocks cannot go lower from here if they are to remain in a bull market.
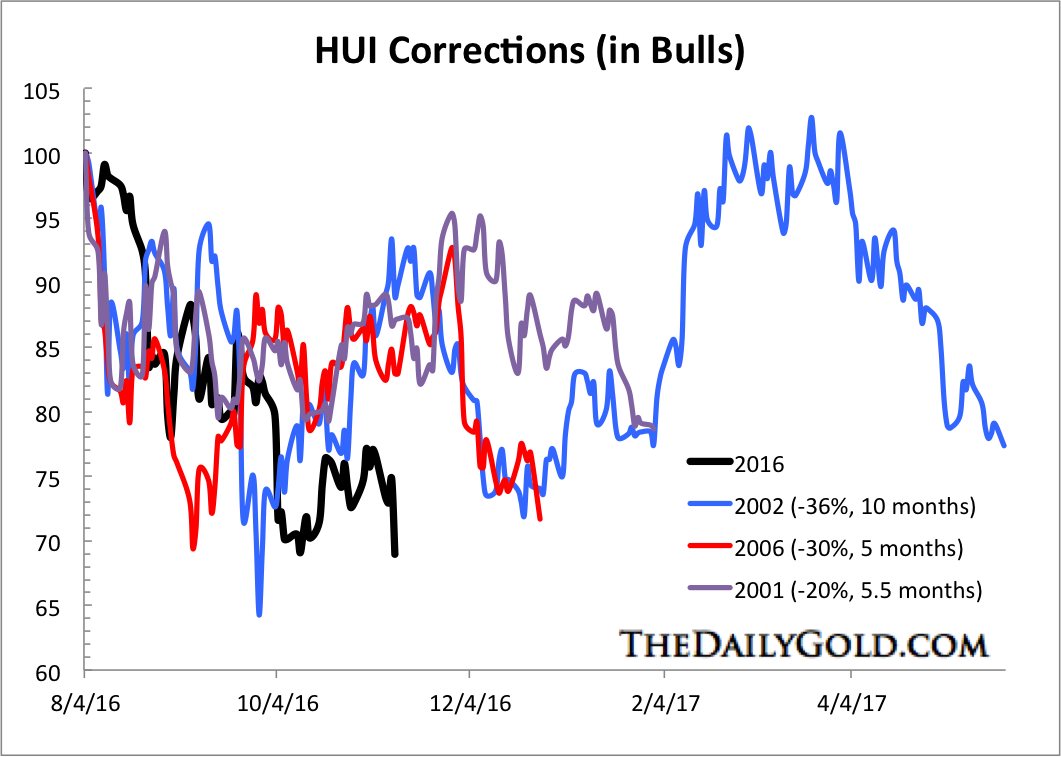
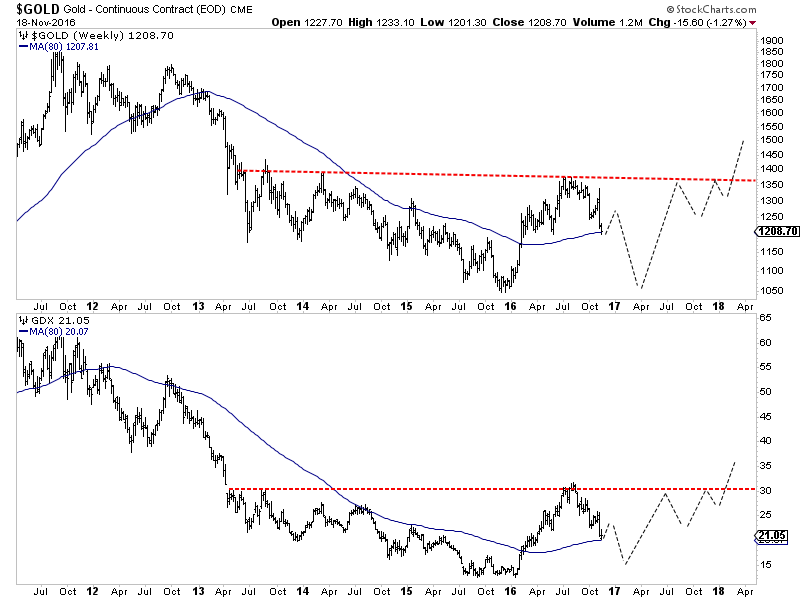
Both history and current price action argue that Gold and gold stocks are at risk of a big decline if they lose the current lows. If Gold loses $1200/oz then it could drop quickly to $1080/oz or even $1050/oz, the major low. The same can be said for GDX which bounced from its 62% retracement and 80-week moving average at $20. Below I have sketched out how this bearish scenario could play out. Note, this sketch is purely subjective and subject to change.
Unless Gold and gold stocks hold current levels and form an important low then the 2016 bull market has gone off course. At present, the evidence favors the bearish scenario which has the sector trading lower in the months ahead. We could chalk this up to a fundamental change (which I consider to be temporary) coupled with the potential for a spike in the US Dollar. Investors are advised to de-risk their portfolios during the coming rebound and prepare for a better buying opportunity at the end of winter.
….related:
Speculators Are Finally Bailing Out Of Gold – And That’s A Good Thing

-
I know Mike is a very solid investor and respect his opinions very much. So if he says pay attention to this or that - I will.
~ Dale G.
-
I've started managing my own investments so view Michael's site as a one-stop shop from which to get information and perspectives.
~ Dave E.
-
Michael offers easy reading, honest, common sense information that anyone can use in a practical manner.
~ der_al.
-
A sane voice in a scrambled investment world.
~ Ed R.
Inside Edge Pro Contributors

Greg Weldon

Josef Schachter

Tyler Bollhorn

Ryan Irvine

Paul Beattie

Martin Straith

Patrick Ceresna

Mark Leibovit

James Thorne

Victor Adair