
Gold & Precious Metals
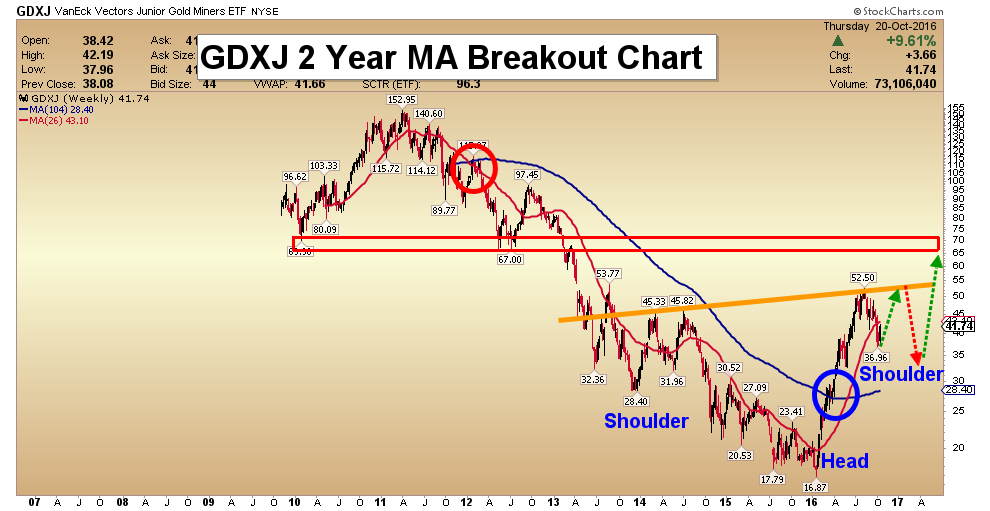
Back in September we looked at a possible morphing Diamond on the GDXJ in which the dashed trendlines were showing the original Diamond. When it started to morph into the bigger Diamond I added the two red circles that showed the false breakouts from the original dashed Diamond. As you can see the last two weeks produced a rally that so far has failed below the apex of the morphing Diamond. From a Chartology perspective the Diamond is a reversal pattern as it has five reversal points.

Below is a longer term daily line chart for the GDXJ which shows how it is situated at the top of the big impulse move up out of the January low. The brown shaded support and resistance zone comes in between 29.75 and 32.50. It may be possible that the Diamond could be the reversal pattern at the first reversal point in a much bigger consolidation pattern.

In the very big picture the neckline symmetry line comes in around the 33.75 area on the long term monthly chart, which would be in the ball park of the brown shaded support and resistance zone. Symmetry suggests the right shoulder still needs a lot more work compared to the left shoulder.

Below is a daily chart for the GOEX, which is the old GLDX gold explores etf, which shows a Diamond reversal pattern in place with a small expanding rising wedge forming as a possible halfway pattern. The price objective for the expanding rising wedge comes in around the 29.56 area. The 50% retrace of the first impulse leg is at 30.15.
As you can see the indicators below the chart all have a positive cross. If the expanding falling wedge plays out to the downside it would be nice to see a positive divergence on the RSI at the top of the chart.
The breakout below the bottom rail of the Diamond consolidation pattern only took about four days or so to reach the low. If we see a similar move down to the price objective, that will shake many PM investors to the core. This looks like a good time to raise a little cash if one is a shorter term trader. For the intermediate to longer term investors sitting tight still looks like the best approach. Once we get the first reversal point in place, at the bottom of the new trading range, that will suggest the low for the rest of the bull market is in place. Surviving this first reaction low will test your mental fortitude if it plays out.


Today’s videos and charts (double click to enlarge):
Gold & Silver Bullion Video Analysis
Bonds, Currency, and Stock Markets Video Analysis
Precious Metal ETFs Video Analysis
SF60 Key Charts Video Analysis
SF Trader Time Key Charts Video Analysis
Morris
The SuperForce Proprietary SURGE index SIGNALS:
25 Surge Index Buy or 25 Surge Index Sell: Solid Power.
50 Surge Index Buy or 50 Surge Index Sell: Stronger Power.
75 Surge Index Buy or 75 Surge Index Sell: Maximum Power.
100 Surge Index Buy or 100 Surge Index Sell: “Over The Top” Power.
Stay alert for our surge signals, sent by email to subscribers, for both the daily charts on Super Force Signals at www.superforcesignals.com and for the 60 minute charts at www.superforce60.com
About Super Force Signals:
Our Surge Index Signals are created thru our proprietary blend of the highest quality technical analysis and many years of successful business building. We are two business owners with excellent synergy. We understand risk and reward. Our subscribers are generally successfully business owners, people like yourself with speculative funds, looking for serious management of your risk and reward in the market.
Frank Johnson: Executive Editor, Macro Risk Manager.
Morris Hubbartt: Chief Market Analyst, Trading Risk Specialist.
website: www.superforcesignals.com
email: trading@superforcesignals.com
email: trading@superforce60.com
The latest Commitment of Traders report shows that speculative positions decreased. What does it mean for the gold market?
In the April edition of the Market Overview, we wrote that the Commitments of Traders Report is one of the most important publications on the gold market, as it breaks down the open interest number into categories of traders, showing the trade positions of market participant groups in the gold market. Let’s analyze the recent changes in traders’ positions.
Chart 1: The price of gold (yellow line, right axis, London P.M. fixing), the net position of money managers (green line, left axis) and the net position of producers (red line, left axis) over the last 12 months.
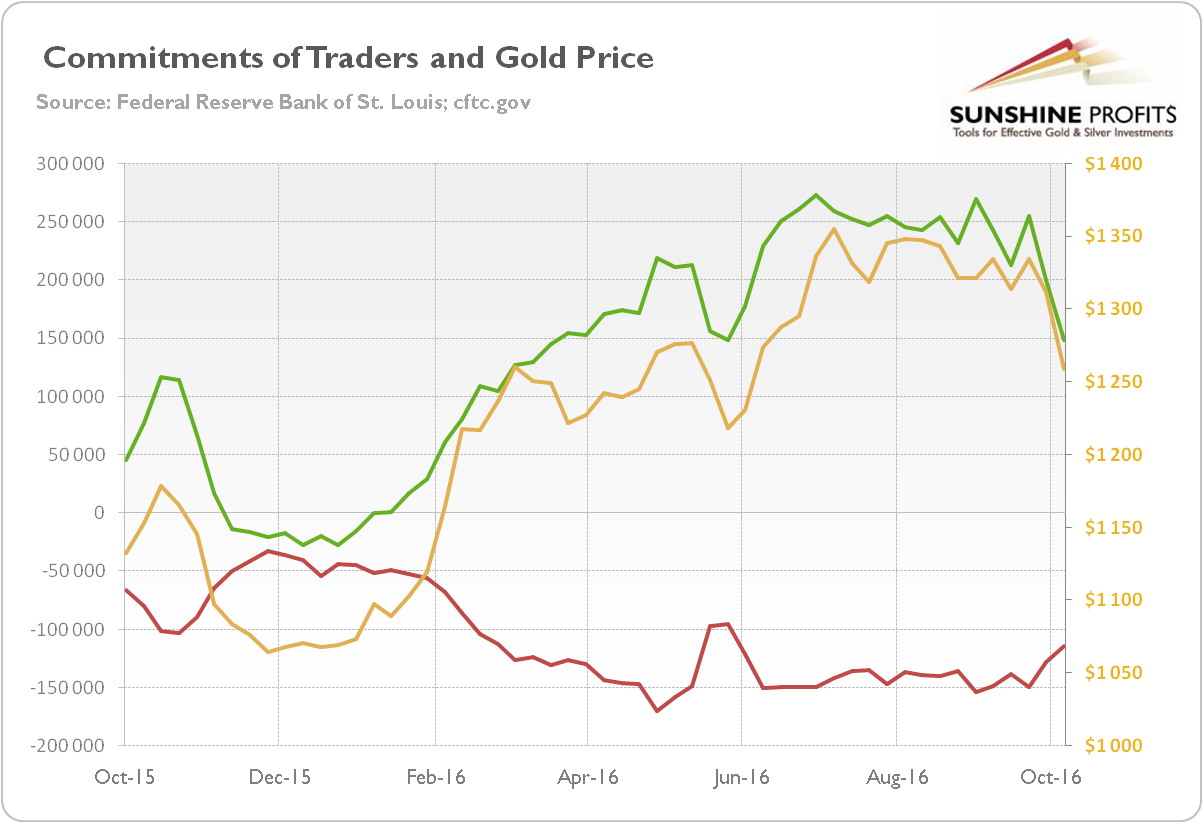
As one can see in the chart above, money managers (green line) tended to follow gold prices, while producers (red line) moved in the opposite direction to gold prices. The 2016 rally in gold was partially caused by the fast rise in net long positions of speculative traders. The chart also shows that these investors really tend to be most bullish just prior to significant price tops (and most bearish before the significant price bottoms).
What is crucial here is that money managers decreased their position from over 255,000 to about 149,000 net long contracts over the last two weeks. Although further declines are clearly possible, speculative positions are now at much more healthier levels.
The take-home message is that speculative traders (money managers) significantly reduced their net long position. The end of speculative fever may be good news for the gold market in the long-term. However, it is rather too early to call the bottom, as we should see some stabilization in net long positions first. We have to wait for Friday’s release of the Commitment of Traders report – but investors should always remember that there is a three day lag between the report and the actual positioning of traders (the report is issued on Friday, but contains Tuesday’s data).
If you enjoyed the above analysis, we invite you to check out our other services. We focus on fundamental analysis in our monthly Market Overview reports and we provide daily Gold & Silver Trading Alerts with clear buy and sell signals. If you’re not ready to subscribe yet and are not on our mailing list yet, we urge you to join our gold newsletter today. It’s free and if you don’t like it, you can easily unsubscribe.
Disclaimer: Please note that the aim of the above analysis is to discuss the likely long-term impact of the featured phenomenon on the price of gold and this analysis does not indicate (nor does it aim to do so) whether gold is likely to move higher or lower in the short- or medium term. In order to determine the latter, many additional factors need to be considered (i.e. sentiment, chart patterns, cycles, indicators, ratios, self-similar patterns and more) and we are taking them into account (and discussing the short- and medium-term outlook) in our trading alerts.
Thank you.
Arkadiusz Sieron
Sunshine Profits‘ Gold News Monitor
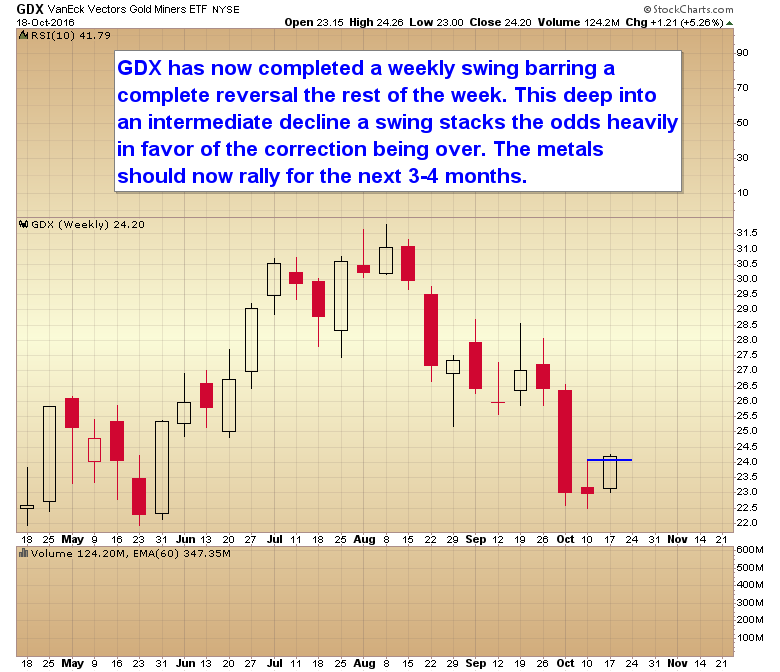
….related: Chart of the Day – GDX

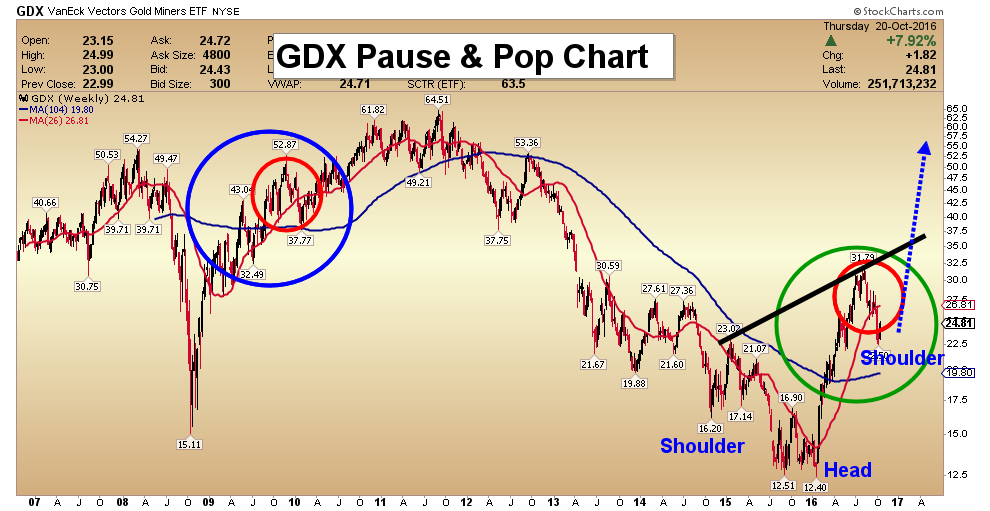
GDX has now completed a weekly swing barring a complete reversal the rest of the week. This deep into an intermediate decline a swing stacks the odds heavily in favor of the correction being over. The metals should now rally for the next 3-4 months.

-
I know Mike is a very solid investor and respect his opinions very much. So if he says pay attention to this or that - I will.
~ Dale G.
-
I've started managing my own investments so view Michael's site as a one-stop shop from which to get information and perspectives.
~ Dave E.
-
Michael offers easy reading, honest, common sense information that anyone can use in a practical manner.
~ der_al.
-
A sane voice in a scrambled investment world.
~ Ed R.
Inside Edge Pro Contributors

Greg Weldon

Josef Schachter

Tyler Bollhorn

Ryan Irvine

Paul Beattie

Martin Straith

Patrick Ceresna

Mark Leibovit

James Thorne

Victor Adair