
Gold & Precious Metals
There were some hopes that a non-move by the Fed would end the current correction in precious metals and spark a move to new highs. Unfortunately, the Federal Reserve cannot override the supply and demand component of the market. Gold and gold stocks popped higher but less than two days later the sector (and specifically the miners) has given those gains back. That tells us plenty of sellers remain and this sector needs more time and perhaps lower prices before this correction ends.
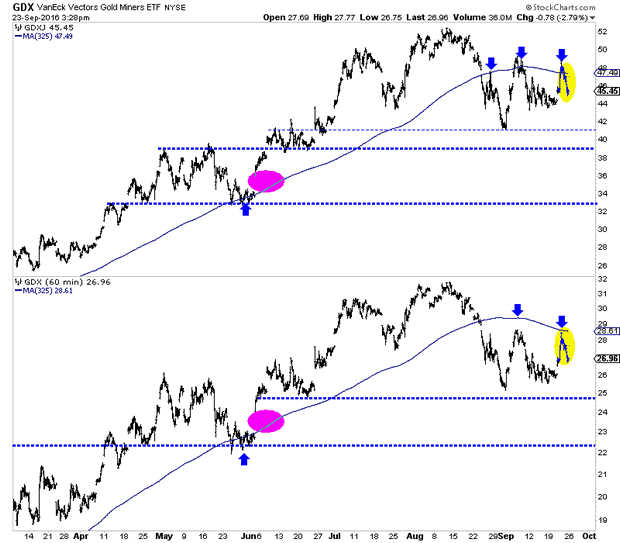
The hourly charts, seen below show the miners selling off after testing their 50-day moving averages. GDX showed a bit more strength on this pop as it reached its 50-dma before retreating. GDXJ nearly touched $49, which is within 10% of the recent high before reversing those gains quickly. The miners could test recent lows before retesting their 50-day moving averages.
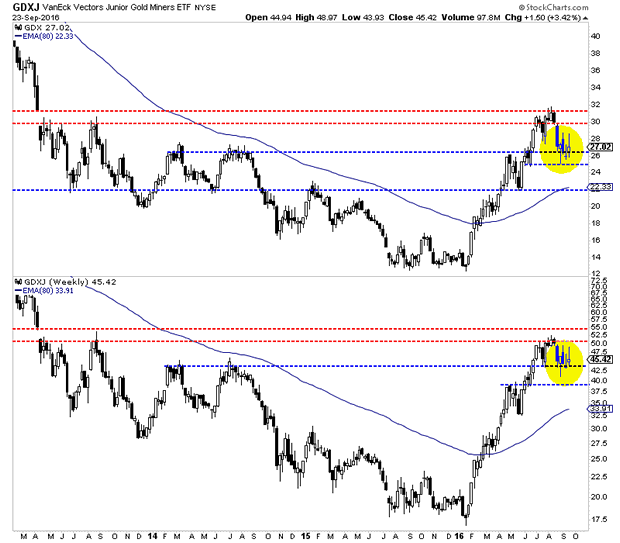
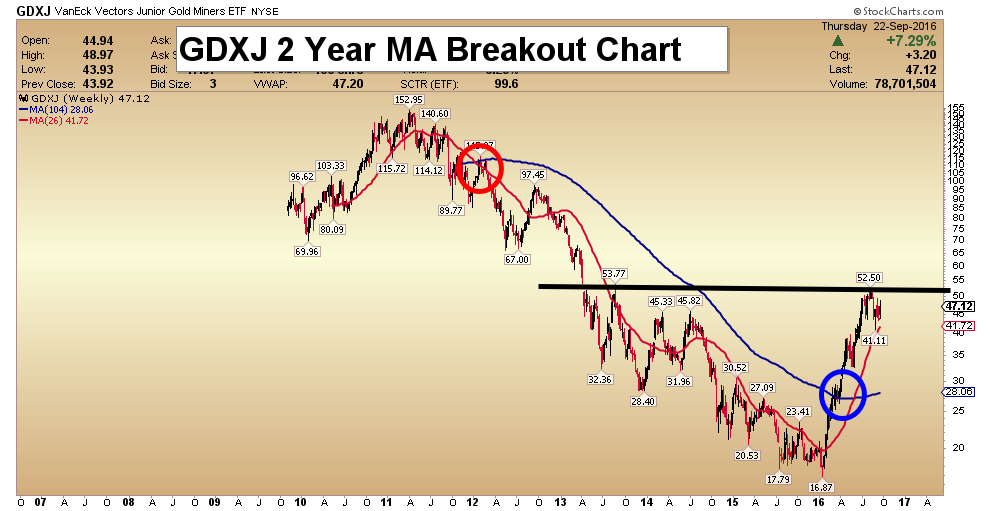
The weekly charts indicate the correction can be deemed bearish consolidation. The candles from the past three weeks have not been remotely bullish. The miners had one solid down week followed by two weeks in which the market failed to hold its gains. GDX (top) has key support at $25 while GDXJ (bottom) is trying to hold above $44. Weekly closes below $26 and $44 could usher in more losses in the short-term.
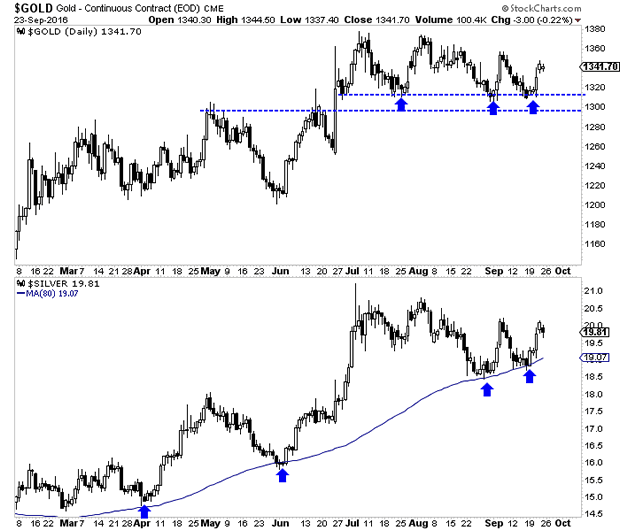
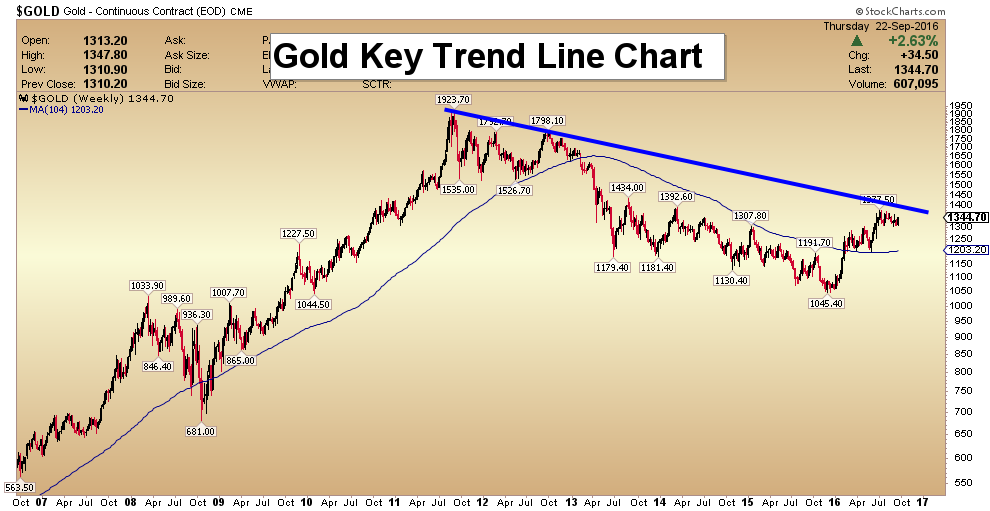
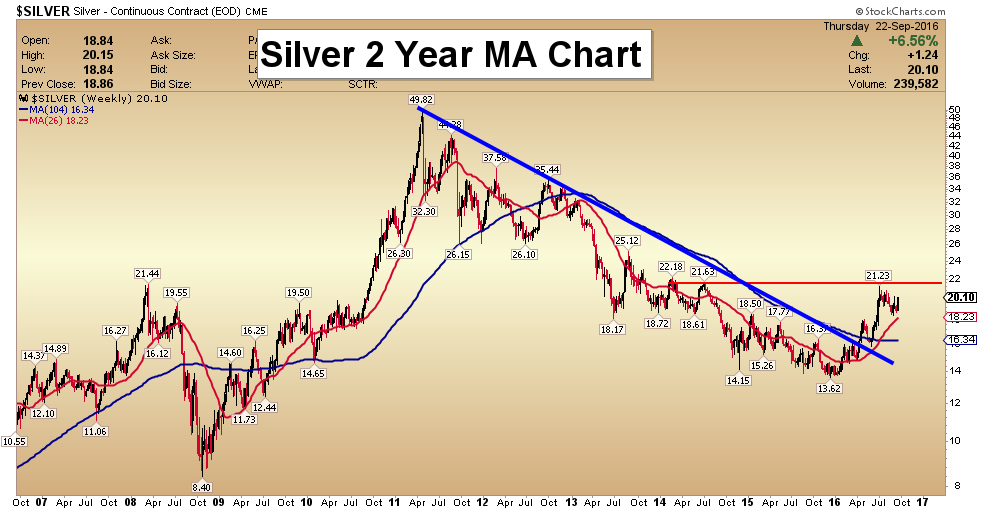
Turning to the metals, we find more encouraging signs as Gold and Silver have maintained support quite well. The daily candle charts for Gold and Silver can be seen below. For the third time in the past few months Gold was able to hold support at $1300-$1310. Meanwhile, Silver held its August low and has shown more strength than Gold recently. That is positive.
The precious metals sector remains in correction mode but the longer the sector can hold and digest recent gains without significant price deterioration then the more likely a bullish outcome becomes. The strength in the metals is a healthy sign but the relative weakness in the miners and failure to hold gains is a signal that the correction will definitely continue in terms of time. Traders and investors should wait for either this market to become oversold or the correction to mature. In the meantime, focus on the opportunities scattered amongst individual companies rather than the sector itself.
Jordan’s premium service
….related: Gold Stocks: The Money Stick Play

Here are today’s videos and charts (double click to enlarge):
Gold & Silver Bullion Video Analysis
Precious Metal ETFs Video Analysis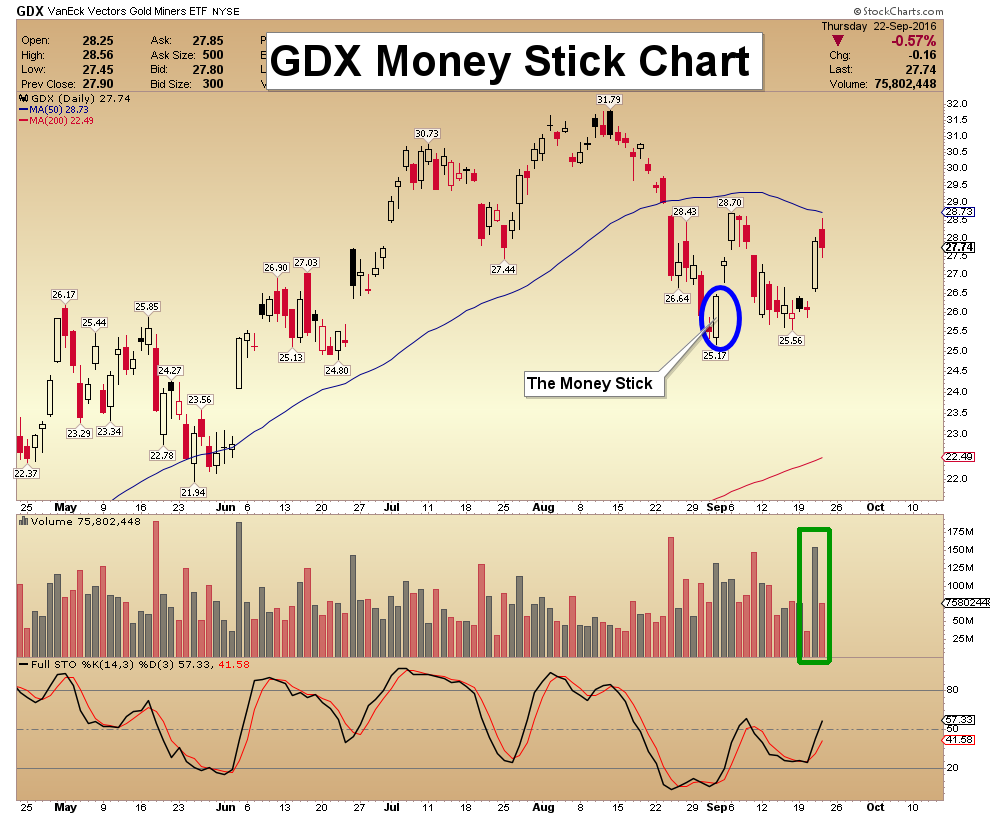
SF60 Key Charts Video Analysis
SF Juniors Key Charts Video Analysis
Thanks,
Morris
About Super Force Signals:
Our Surge Index Signals are created thru our proprietary blend of the highest quality technical analysis and many years of successful business building. We are two business owners with excellent synergy. We understand risk and reward. Our subscribers are generally successfully business owners, people like yourself with speculative funds, looking for serious management of your risk and reward in the market.
website: www.superforcesignals.com
related:
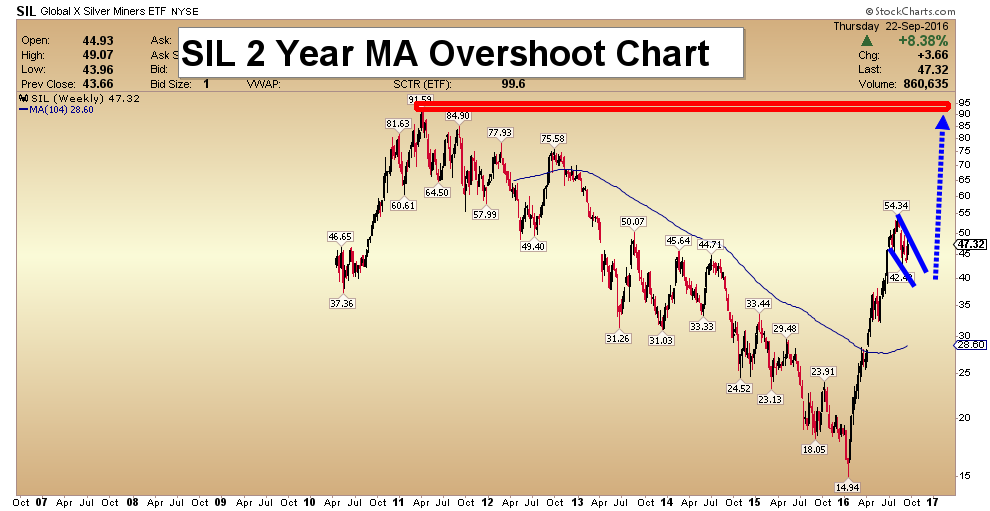
Silver Price Forecast: Higher Silver Prices For Many Years To Come

In a previous article, I highlighted how a Head and Shoulders Bottoming pattern on the silver chart suggested that the silver rally since the beginning of 2016 is likely to continue.
This pattern has now matured nicely, thanks to the retrace to the breakout area. Below, is a silver chart (all charts from tradingview.com), with that pattern and the retrace to the breakout area highlighted:

On the chart, I have highlighted the breakout as well as the retrace to it. Interestingly, there is now a flag formation. A breakout at the top of the flag will be the beginnings of an explosive rally. There is of course still a possibility of a return to the retrace area before that happens.
The next leg up will be far more intense than the rally since the beginning of the year. This is because the above pattern is at the trigger point, of a larger pattern on the silver chart previously pointed out.
The current season is ideal for silver and gold rallies, and this increases the likelihood that the above patterns will resolve soon. Furthermore, we are also in stock market crash season, which could be the greatest driver for the coming silver rally, since significant nominal peaks in the price of silver tend to come after significant nominal peaks in the Dow (I have written about this extensively).
The two most significant nominal peaks of the Dow were in 1929 and 1973. Silver made a significant peak in 1935, about six years after the Dow’s major peak in 1929. Again, in 1980, silver made a significant peak, about seven years after the Dow’s major peak in 1973.
If the Dow is currently forming a very significant top, then we could possibly expect a major peak in silver, towards the end of this decade, to early next decade. This means we are likely to have rising silver prices for many years to come.
Go here for a Silver Fractal Analysis Report
Warm regards,
Hubert Moolman
…related:
Miners Can Double or Triple Within Nine Months
 First published Sat Sep 17 for members: Yes, you heard me right. The miners are setting up in a pattern which can see them double within the next nine months. So, let me explain.
But, before I get into that explanation, I want to preface this write up by saying that I put a lot of thought into where I believe we are in this complex, and will try to convey my thoughts with as much detail as possible. So, it may take several readings to understand what I am saying, since I am providing you with all the information I have been considering before I came to my conclusions at the end of the write up.
With the current action we have been experiencing over the last month, it seems as though the GDX has completed 5 waves off its January lows, which I have classified as wave i. That means that the current pullback is likely a wave ii, with the alternative being wave 2 of iii (noted in yellow). And, since my biggest complaint about this market in 2016 has been that we have not had a clearly defined 2nd wave pullback, the market may be providing me with a “gift.” You see, once we have a clearly defined i-ii structure in place, our Fibonacci Pinball method will be set up to provide rather accurate guideposts once this correction runs its course, and we break out to higher highs.
Within a 2nd wave, the market will usually drop to the .382 retracement of the prior 5 wave structure in the a-wave of the 2ndwave. Thus far, what we are counting as the a-wave of this wave ii has come up a bit short of the .382 retracement, which is located at 24.38. Now, when the market comes short of a Fibonacci target, we often see the (b) wave of the following wave structure striking the appropriate target. That means that the (b) wave of the b-wave can very well strike that target before we see a (c) wave rally.
Moreover, this assumes that the market will see a standard b-wave structure. Normally, under most circumstances, the market will provide a well-defined (a)(b)(c) structure within a larger degree b-wave structure. Thus far, we have not seen that, as we have only seen one corrective rally, which is why I have still been giving the market the opportunity to develop the standard structure, which would provide us with a (c) wave rally.
But, keep in mind that these are simply the “standards,” which means, by definition, there will be outliers at times. And, since this larger corrective structure, when complete, suggests that we “should” see at least the 22 region (.500 retracement) as a target for the entire wave ii, one should treat any rally in a (c) wave of a b-wave as an opportunity to hedge their portfolio, rather than attempting to trade that structure to the upside in an aggressive fashion.
Ultimately, it would take a break down below the .382 retracement of 24.38 to provide more certainty that the market is heading directly down to the 22 region to complete the c-wave of wave ii sooner rather than later. So, you may consider me foolish, but I have to abide by standards, and am still looking for that rally to complete a “standard” b-wave, which needs a (c) wave rally to commence quite soon. Moreover, Dr. Cari Bourette, of MarketMood.net, is also expecting higher in the upcoming week based upon her gold market sentiment analysis. In fact, she even has the potential for the entire correction to imminently complete.
Now, as far as the c-wave is concerned, the most common target for the c-wave is the 1.00 extension off the top of the b-wave, where a=c. And, if the b-wave is now in place, then the a=c overlaps right at the .500 retracement in the 22 region. That is what we call “confluence.” The second most common target is where the c-wave is equal to 1.382 times the size of the a-wave, off the top of the b-wave. And, that overlaps with the .618 retracement of wave I in the 19.80 region. Yes, this is another point of “confluence.” All of this suggests that, as it stands now, the maximum I would be comfortable with is the 19.80 region for wave ii. Anything below that region increases the potential that the lows in the market have not yet been seen.
This is where the larger degree projections to the upside come in. Assuming that the 19.80 region holds as support, it suggests that the minimum target for wave iii in the 1.618 projection of waves i and ii is in the 51 region. Again, this assumes that we drop no further than the 19.80 region, and also strike the standard target for a wave iii on the upside. However, since it is quite possible that we hold the 22 region, and since the metals complex often strikes extensions beyond the 1.618 for its 3rd waves, it would suggest that the wave iii of a larger degree wave (1) would likely target the 55-60 region.
Furthermore, since wave i took approximately 6 months, and wave iii is often stronger than a wave i, it would suggest that wave iii can also complete within 6 months, and potentially earlier once wave ii completes. And, assuming that wave ii can still take us another several weeks to another month or so, we should easily be able to double, and maybe even triple in the GDX within the next nine months, as long as we hold the 19.80 region for wave ii.
This also suggests that within 12-15 months, we can challenge and potentially even slightly exceed the 2011 highs in the GDX to complete the larger degree wave (1), which should kick off a multi-month wave (2) pullback. This would also provide an extraordinarily high probability signal that a multi-decade bull market in this complex is underway.
As far as the underlying metals themselves, they seem to be within a slightly more accelerated bullish path, but which can still take them back towards their 2011 highs within the next year as well. While the GDX seems to be in a i-ii structure, the count I have been following in the GLD and silver is a i-ii, 1-2 structure. While the GDX is still within its machinations for its wave ii, I have the same relative count for the wave 2 of wave iii in GLD and silver, in other words, still likely needing more of the correction to fill in.
Therefore, the way it looks at the moment, the wave 2 of iii correction in the metals does not yet look complete. As with the GDX, while we may see an immediate continuation lower to complete the c-wave of wave 2, I believe the silver chart may be suggesting we see a rally before that c-wave down takes hold. As you can see from the attached 144-minute chart, every time we have had this positive divergent set up on the silver 144-minute chart MACD, it has portended the commencement of a strong rally. This has been the case for each and every rally we have experienced in 2016. Will it fail this time? This I cannot answer, as I only deal in probabilities and not certainties. And, each and every time we have had this set up in 2016, we have seen a rally.
In conclusion, due to the “standards” we ordinarily see in the market, the silver 144-minute chart signal, and Dr. Bourette’s market sentiment analysis, I am still going to look for another rally to take hold as long as the GDX is over 24.38. Moreover, I am going to assume that rally is going to be the (c) wave within a b-wave corrective rally, setting us up for one more drop in the c-wave of wave ii.
Alternatively, should the next rally see GDX and silver break out to new highs over their August highs, and the GLD break out over 132, before seeing that c-wave down, then I will assume the correction has completed, will stop out of all my hedges, and expect that we are on our way into the heart of a 3rd wave rally in the metals complex.
See charts illustrating the wave counts on the GDX, GLD and Silver (YI) at https://www.elliottwavetrader.net/scharts/Charts-on-GDX-GLD-Silver-YI-201609181373.html.
Avi Gilburt is a widely followed Elliott Wave technical analyst and author of ElliottWaveTrader.net (www.elliottwavetrader.net), a live Trading Room featuring his intraday market analysis (including emini S&P 500, metals, oil, USD & VXX), interactive member-analyst forum, and detailed library of Elliott Wave education.
In previous articles, we have examined the gold’s performance in different election cycle years. Now, we deepen our analysis and investigate the behavior of the shiny metal in each presidential cycle in more detail. We analyze how gold performed under each President and which governing party (or whether the new President is an incumbent or a newcomer) affects the gold market the most.
The first cycle ran from 1973 to 1976, when Richard Nixon (who in 1971 closed a gold window), and later, after the Watergate scandal, Gerald Ford were in office. As the gold standard was abandoned, while inflation and uncertainty surged, it was a good period for the shiny metal, which rallied 114.27 percent.
The next presidential term was even better for gold, which skyrocketed 392.50 percent under Jimmy Carter in 1977-1980 due to the rampant inflation and weak greenback. Carter was definitely the best president for the price of gold. However, gold’s move in the post-election year was much stronger after Nixon’s nomination, and the annual returns gradually deteriorated over the term, while the dynamics after Carter’s nomination was the opposite (weak reaction and improving returns over the term).
The Ronald Reagan’s era was not positive for gold, as the improving domestic economy pushed the shiny metal down 41.29 percent during his first term and only 21.09 up during the second term. In both cycles, the post-election year was the worst for gold. The same applied to George H. W. Bush’s presidency. The first year after the nomination was the weakest for the yellow metal, which lost 21.27 percent overall during the term.
After George H. W. Bush, Democratic Bill Clinton took the office for two terms, but gold remained in a bear market. It gained only 12.77 percent during the first four years and lost 28.04 percent over Clinton’s second term, as the U.S. dollar was strong. It is notable that the post-election year in the first election won by Clinton was the second-best for the shiny metal in that cycle.
The George W. Bush’s presidency was definitely supportive for gold, which surged 46.60 percent over the first term and 113.11 percent over the second due to rising fiscal deficits. However, the post-election years were the weakest in both election cycles.
The first term of Barack Obama continued to be positive for the yellow metal, which rallied 91.40 percent due to worries about the post-recession economy. In that cycle, the post-election year was not the worst, but the second worst. During Obama’s second term, gold plunged 26.82 percent. The table below summarizes gold’s behavior in each presidential election cycle.
Table 1: Gold’s performance in presidential election cycles between 1973 and 2016
What are the conclusions for our analysis of gold’s behavior during the post-1971 presidential election cycles? First, including the first half of 2016, there were eleven presidential election cycles since the 1970s when gold started to be freely traded. Gold increased during seven of them and usually (in eight cases) experienced the worst performance over the cycle in the post-election year.
Second, there were six Republican presidential terms and five Democratic. The latter were far better for gold, as it gained, on average, 88.36 percent over Democratic presidencies and only 38.75 percent over Republican presidencies. Although it makes some sense, as Republican governments are a bit more focused on curbing inflation and fiscal deficits, the process was very sensitive to Carter’s presidency under which gold skyrocketed.
Third, when a newcomer became the president gold behaved much better (100.40 percent) than in case of incumbents’ victories (28.72 percent) in the whole cycle, but worse in the post-election year (1.28 percent versus 3.47 percent, respectively). But when we separate Republicans and Democrats, we see different outcomes. Gold performed stronger under Republican incumbents than under Republican newcomers or Democrat incumbents, both in the whole election cycle and in the post-election year. Again, due to Carter’s presidency, Democrat newcomers were, after Republican incumbents, the best for gold in the post-election years. Fourth, gold gained more over cycles when presidents had support in Congress (184.07 percent versus 19.43 than when the Congress was dominated by the second party). However, we doubt whether it was an important factor in the gold price dynamics. The analysis is based on very little data and it is not easy, as sometimes presidents had support for half of their presidency or support of the House of Representatives or Senate, only).
The bottom line is that the long-term analysis of gold’s behavior in presidential election cycles is inconclusive. Gold marked its best time under Carter’s presidency, but otherwise it went up and down under both Republicans and Democrats, incumbents or newcomers. It seems that the gold’s performance depends much more on the broader economic context, including monetary policy, rather than who leads the government. It shined when the U.S. economy was in stagflation both under Nixon/Ford and Carter. And the yellow metal was weak when the U.S. economy strengthened, no matter whether it was under the Republican Reagan or the Democrat Clinton. It suggests that the choice between Donald Trump and Hillary Clinton may be not as important for the gold market as is commonly believed. Certainly, Trump would be an unprecedented president due to his unpredictability and populism, thus gold may get a boost if he wins. However, investors should remember that the post-election year is usually the weakest year in the presidential election cycle.
If you enjoyed the above analysis and would you like to know more about the consequences of the U.S. presidential elections for the gold market, we invite you to read the September Market Overview report. If you’re interested in the detailed price analysis and price projections with targets, we invite you to sign up for our Gold & Silver Trading Alerts. If you’re not ready to subscribe at this time, we invite you to sign up for our gold newsletter and stay up-to-date with our latest free articles. It’s free and you can unsubscribe anytime.
Thank you.
Arkadiusz Sieron
Sunshine Profits‘ Gold News Monitor and Market Overview Editor

-
I know Mike is a very solid investor and respect his opinions very much. So if he says pay attention to this or that - I will.
~ Dale G.
-
I've started managing my own investments so view Michael's site as a one-stop shop from which to get information and perspectives.
~ Dave E.
-
Michael offers easy reading, honest, common sense information that anyone can use in a practical manner.
~ der_al.
-
A sane voice in a scrambled investment world.
~ Ed R.
Inside Edge Pro Contributors

Greg Weldon

Josef Schachter

Tyler Bollhorn

Ryan Irvine

Paul Beattie

Martin Straith

Patrick Ceresna

Mark Leibovit

James Thorne

Victor Adair