
Gold & Precious Metals

Executive ability is deciding quickly and getting somebody else to do the work.
John G. Pollard
Many individuals sit back and look wistfully at the 1st stage of the Gold Bull Market they missed. It is interesting that people focus on what they lost but not what they might miss. Since Gold topped out in 2011, many sectors took off; one could have deployed a portion of one’s funds in any of these sectors and walked away with healthy gains. Instead, the classic Gold bug clung to Gold and let all these opportunities slide away.
Never live in regret, life is much too valuable for that. There is always another bull market, why focus on one market only. Many people fixate on the precious metals markets because many hard money experts continue to come out with gloom or doom scenarios. Never listen to anyone giving you a script that is painted with strokes of Panic. No one can function properly once he or she succumbs to panic; reason goes out the window, and nonsense takes over.
There is a way that Gold bugs and hard money experts can have their cake and their pie, but that would entail a change in perspective. If you can do this then, the process is rather simple. We will provide these details shortly; please bear with us.
Precious metals will trend higher one day but why fixate on that day only, what about today, and all the other opportunities you might be sacrificing because you have restricted your vision. If you cling to a particular outlook, you have reduced your line of sight by a significant margin. This is why Gold bugs openly state that they will not support “Fiat”, and they will rather embrace Gold and Silver than the stock market which is funded by worthless paper. To which we respond “oh really” well then what are these bugs doing when they buy Gold; are they not hoping that Gold soars in value and what will it rise in value, oh yes, worthless dollars.
If you cling to one perspective, you cannot see the full picture. How about looking at the picture from every angle. You are Gold bug or hard money fan; here is how you can have your cake and your pie
Why not embrace the equities bull, use the worthless money to get more cheap money and then use some of this paper to buy the Gold and Silver you crave; this perspective is lost to the on many because all they see is Gold and nothing else. Had they embraced this point of view, they would have been embraced the equities bull and multiplied the worthless paper (money) they had. Then, they could have used some of this worthless money to buy real money (Gold), and maybe then they would not be so obsessed with the Gold Markets. The Gold they obtained would technically be free as they used paper profits generated by embracing assets they typically would not; this extra paper was used to bankroll the purchase of new bullion. In effect, they would be pulling a page out of the central banker’s books. A perception depends on the angle of observance; alter the angle and you modify the perception.
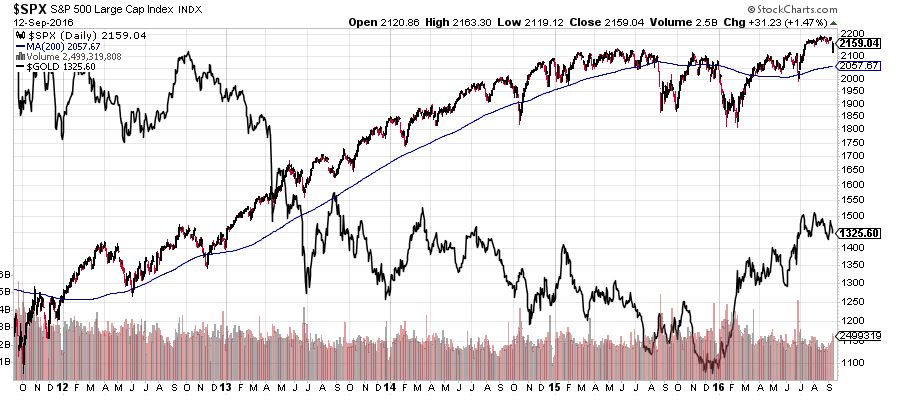
This chart illustrates how Gold performed vs. the SP500 over the past five years; in comparison, Gold has taken a beating and is now making a modest comeback. This took place in the face of the greatest money printing efforts from central bankers in the history of this planet. What happened to the hard money argument that Gold will rise as the money supply soared. Instead the opposite took place, the more money central bankers created, the more Gold fell.
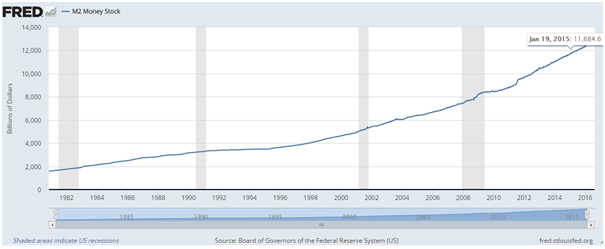
This chart clearly illustrates that since 1980, Gold has not fared as well as it should have. Look at how the money stock has increased. The price of Gold should have continued to trend upwards, and it should be north of $2500. Instead, it cannot even trade to $1400. There is a reason for this; central bankers have managed to recreate reality. By brainwashing the masses and creating new definitions for inflation, they have convinced the masses that Gold is an old relic not worth focusing on, but that is a story for another day.
This is why it is important not to be belong to any group and why it is more important to concentrate on the trend. Don’t fall in love with Gold; it is just another investment; it will trend up for some time, then pull back and correct firmly and then trend up again. Nothing trends up forever, well, stupidity being the only exception.
Once again, the point we are trying to make is that you should not live in regret; the 1stphase of the Gold bull is over, but the next phase will be even stronger. We have a high-end target of $5000 for Gold and to be honest with you, we hope it does not trade to $5000, and we are wrong. Inflation will be quite significant if Gold hits $5000, so those fools hoping for Gold $25,000 or $50,000 have no idea how terrible things would be if Gold traded to those targets. If, Gold ever trades to $50,000, the world as you know it will be over. Chaos will be the order of the day. We will be facing a situation that will be even worse than the Greate Depression. Luckily most of these guys are full of hot air, and it is more likely Central bankers will embrace Gold before Gold trades to those targets.
Conclusion
Forget the noise, focus on the trend. Experts are there to confuse and not enlighten one. We have never claimed to be experts, at most we will settle for the title of advanced students of the Market. The market is a complex beast, and there is always something new you can learn. Those that refuse to accept this are usually punished severely.
Moreover, don’t forget, you can have your cake and your pie. Use worthless paper to make more paper and then use some of this paper to buy (Real Money) Gold and or Silver bullion. In such crazy times, it would be prudent for everyone to have a portion of his or her funds in Gold and Silver bullion. If you have no position in bullion, use strong pullbacks to open new positions.
Ability is a poor man’s wealth.
M. Wren
….related: Gold and Gold Stocks Correction Continues
The failure of Gold and gold stocks to sustain recent gains coupled with a strong selloff to close the week dashes any hope that the correction ended last week. The charts and probabilities argue that the sector remains in a larger correction and perhaps has started the C portion of a typical A-B-C (down-up-down) correction.
This week started out strong for the miners but that strength faded and was completely reversed with Friday’s selloff. GDX and GDXJ closed down 3%-4% for the week and left nasty bearish candles on the weekly charts. GDXJ, which made a low of $41 last week could test at least $39 while GDX, which tested a low of $25 last week has downside potential to $22.
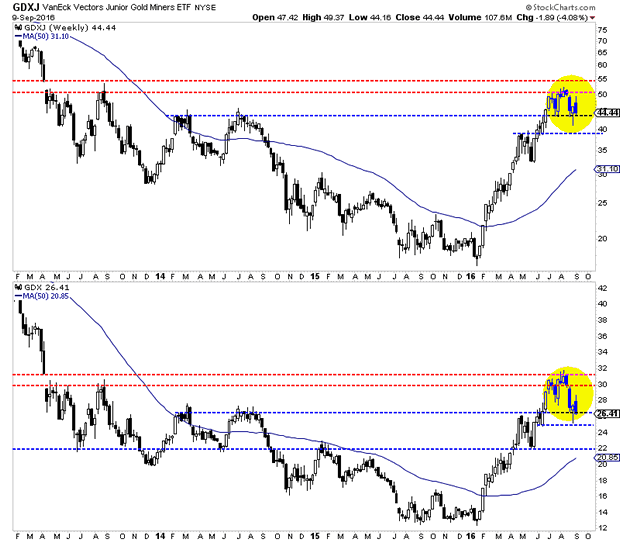
Before I get to Gold, here is an important note on GDX. During bull market corrections, GDM, the parent index of GDX often found support at its 400-day exponential moving average. This happened seven times during 2002-2003, 2006 and 2009-2010. The 400-day exponential moving average for GDX is currently at $22 and rising slowly. Hence, I consider $22-$23 as a potential bottom for GDX.
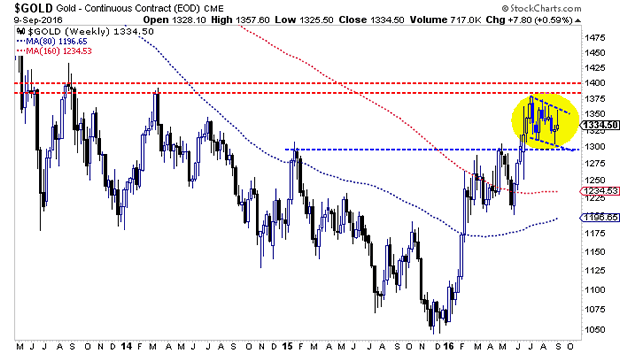
Turning to Gold, we note that Gold failed at the $1355-$1360 resistance earlier in the week. That coupled with Friday’s decline increases the odds that Gold will head lower to the bottom of its channel near $1300. Gold closed at $1334. It has support at $1300-$1310 and $1275-$1280.
The negative reversal in miners and metals at the end of this week (and their failure to hold the rebound) signals that a larger and longer correction is playing out and more downside potential is directly ahead. GDX closed at $26.41. It has a very strong confluence of support around $22 which includes its 200-day moving average, its 400-day exponential moving average (noted above) and the 50% retracement of the entire rebound. Do not be surprised if this target is reached quickly, such as in days and not weeks. Remember that fishing line type declines (think of the trajectory of a fishing line) are a buying opportunity.
…related:
Switzerland and Norway Begin to Massively Accumulate Precious Metals Mining Shares

 Events are moving behind the scenes. For decades, Western Central bankers have told the masses that gold is a barbarous relic. They have encouraged us to shed its protection and move into the sanctity of their highly corrupt and highly manipulated fiat assets.
During this time period, our Western Central bankers have offloaded our countries’ hard earned wealth, shipping massive quantities of precious metals to far off lands in the East, never to be seen again – despite what they may think. Our wealth is being sold out from under our feet.
Yet, as I have reported on recently, a shift is occurring. Call it what you will – I call it panic. Many Western Central bankers are trying to accumulate metals in stealthy ways, behind the scenes and unbeknownst to the masses, whom they wish to keep trapped in fiat money.
….related:

-
I know Mike is a very solid investor and respect his opinions very much. So if he says pay attention to this or that - I will.
~ Dale G.
-
I've started managing my own investments so view Michael's site as a one-stop shop from which to get information and perspectives.
~ Dave E.
-
Michael offers easy reading, honest, common sense information that anyone can use in a practical manner.
~ der_al.
-
A sane voice in a scrambled investment world.
~ Ed R.
Inside Edge Pro Contributors

Greg Weldon

Josef Schachter

Tyler Bollhorn

Ryan Irvine

Paul Beattie

Martin Straith

Patrick Ceresna

Mark Leibovit

James Thorne

Victor Adair