
Gold & Precious Metals
Today’s videos and charts (double click to enlarge):
Gold & Silver Bullion Video Analysis
Precious Metal ETFs Video Analysis
US Bonds, Dollar, & Global Stock Markets Video Analysis
SF60 Swing Trades Video Analysis
Thanks,
Morris
About Super Force Signals:
Our Surge Index Signals are created thru our proprietary blend of the highest quality technical analysis and many years of successful business building. We are two business owners with excellent synergy. We understand risk and reward. Our subscribers are generally successfully business owners, people like yourself with speculative funds, looking for serious management of your risk and reward in the market.

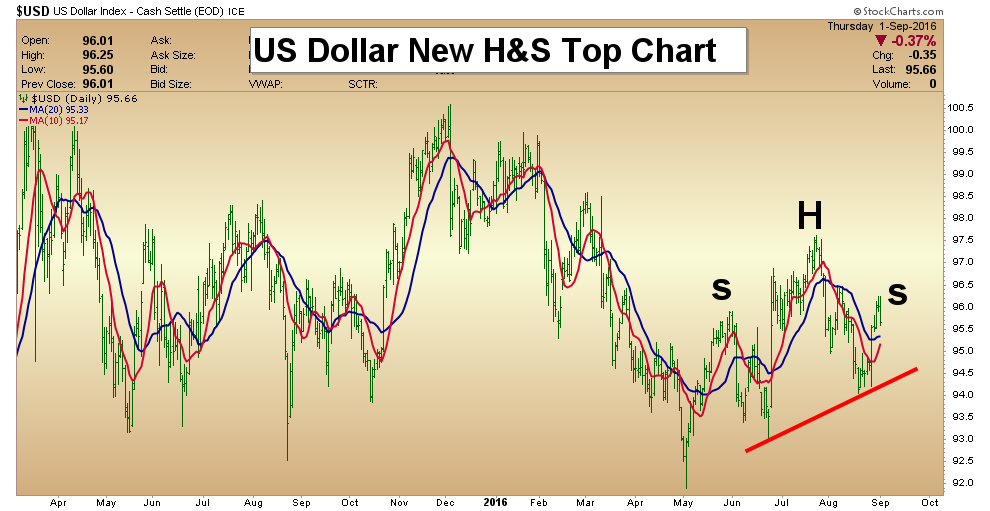
 Obviously, the precious metals have become fixated once again with what the Fed may be about to do. How we can replay this movie over and over again is a question I cannot answer. In the investment world that I grew up in the market only tended to discount something once, or maybe twice, but not n number times, where n is some larger number.
related:
Martin Armstrong:
Sovereign Debt Crisis – Banking Crisis – Derivative Clearinghouse Risk
Technical observations of RossClark@shaw.ca
Seven of the nine gold miners with market capitalizations over 10 billion Cad$ have generated TD Sequential 9 Sell Setups during this year’s rally. The most common reaction is a correction back to the 20-month exponential moving average. Longer-term investors should be patient.
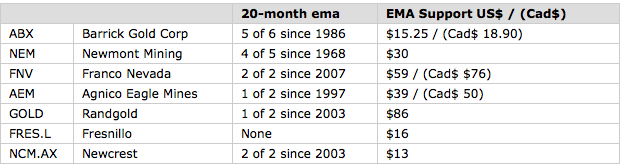
Barrick

Newmont

Franco Nevada

iShares TSX Global Gold Index ETF (XGD.TO)

….related from Jordan Roy-Byrne:
Last week we projected 5% to 10% downside in the gold stocks. Well, not to butter my own bread but GDX and GDXJ both lost 9% on the week. That being said, I believed that the weakness would be limited and miners could rebound to new highs in September. While that possibility remains, there is a chance this correction could go a bit deeper and perhaps last longer.
The weekly candle charts below show that the miners are correcting after failing to break into a “thin zone” of resistance. GDX has broken below its July lows and corrected as much as 16%. It has support at $25-$26 and that includes the Brexit gap. Also, the 38% retracement of its entire rebound is just below $25. Meanwhile, GDXJ has yet to break its July low in the $43s. It has corrected as much as 17% but could end up testing $39-$41. The 38% retracement of its entire rebound is a hair below $39.
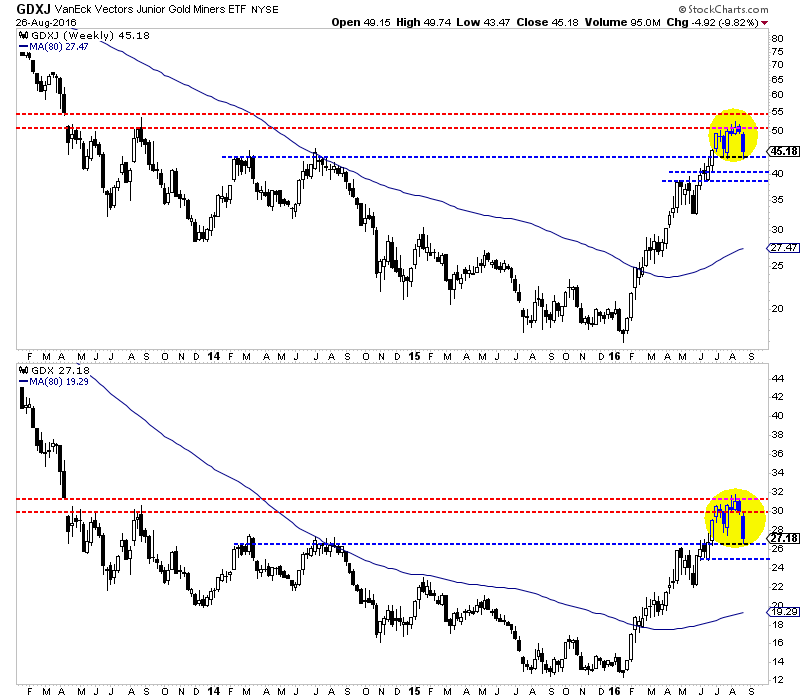
GDXJ, GDX Weekly Candles
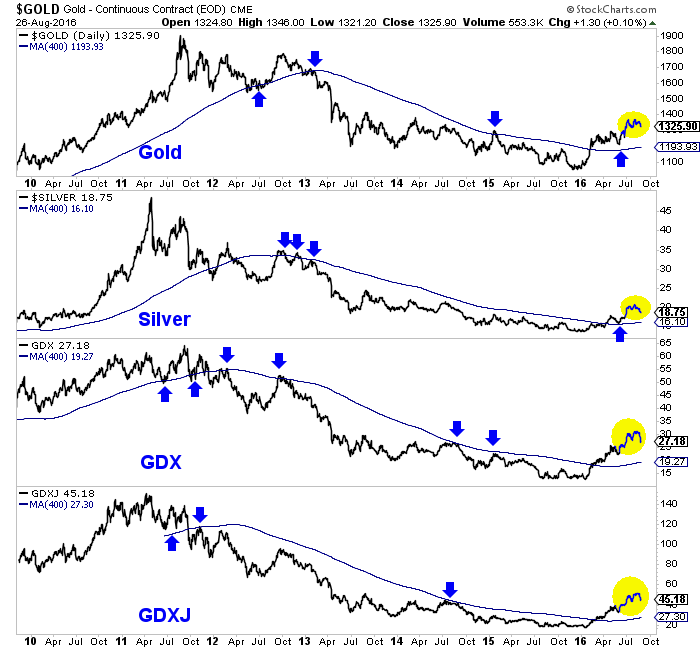
Whether the correction lasts longer or evolves into a long consolidation, precious metals will remain in a bull market. It is hard to argue against the chart below. We plot Gold, Silver, GDX and GDXJ along with the 400-day moving average which is an excellent indicator of the primary trend. The sector sits comfortably above the 400-day moving averages which are sloping upward for the first time in years.
While we expected this correction, we did not anticipate there would be a chance for a larger correction. If you believe we are in a new bull market, as I do, then the path to financial success is buying and holding and buying weakness. (Our guidance for selling, we’ll get to another time). If I were holding too much cash or missed the epic rebound, I would be taking advantage of further weakness. Buying 20% to 25% weakness in a bull market (especially one that is only months old) will likely payoff in the long run.
Jordan Roy-Byrne, CMT, MFTA
related:

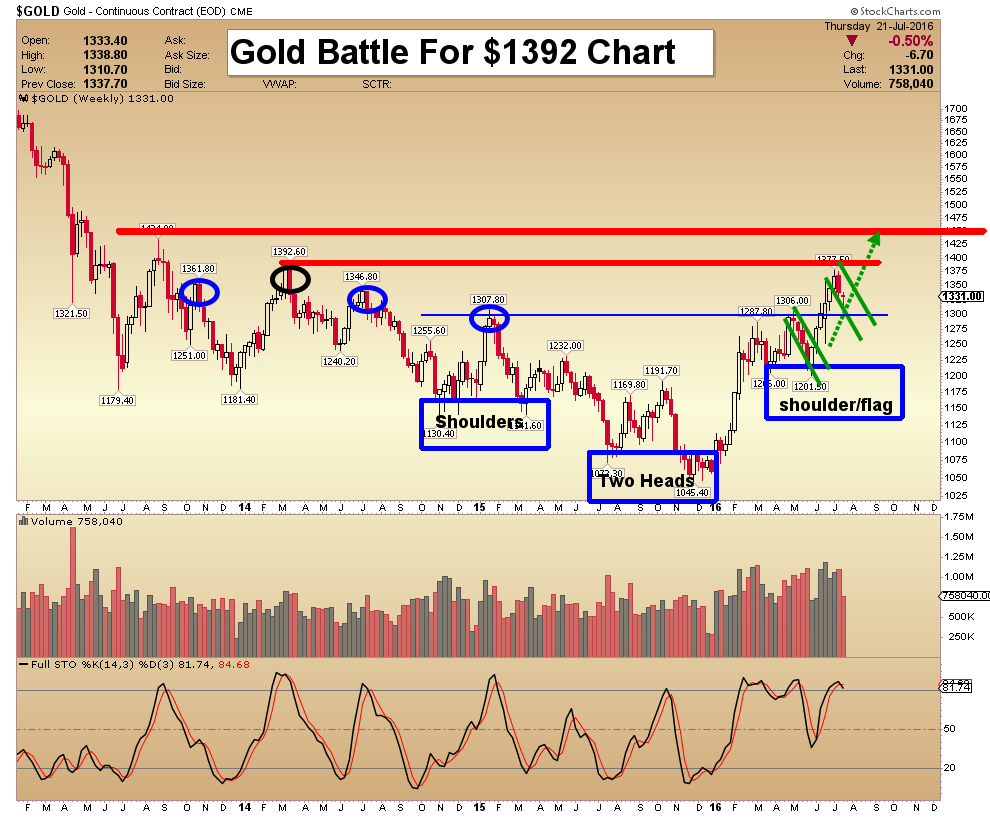
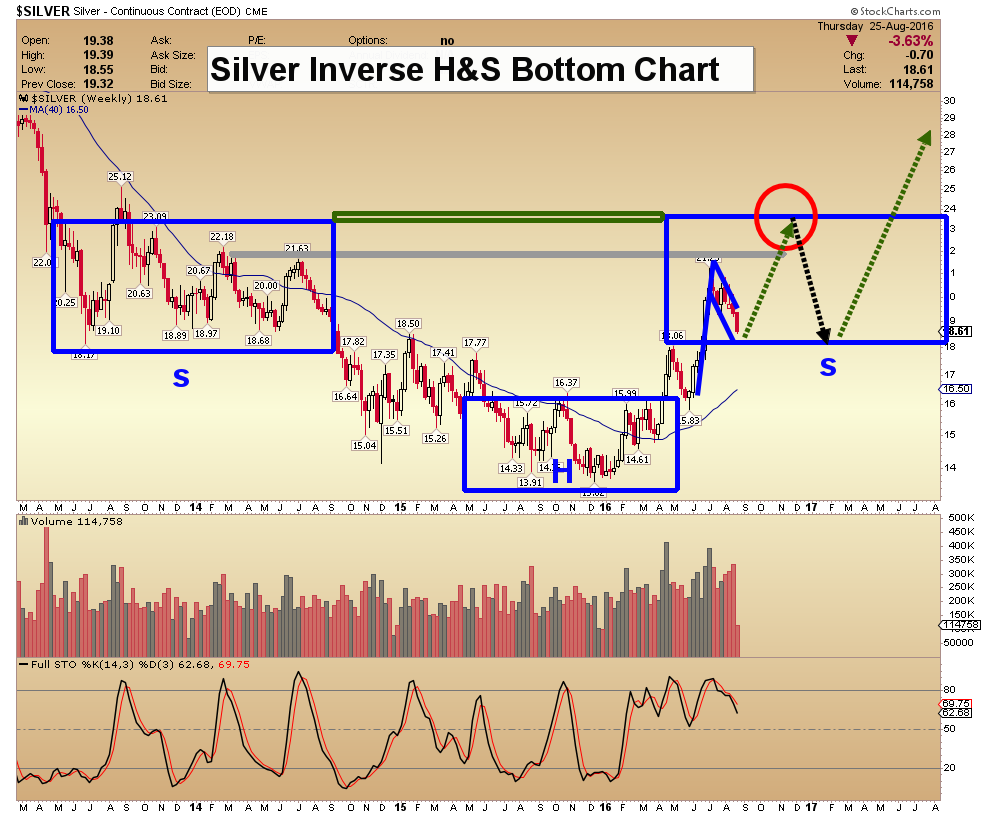
Today’s videos and charts (double click to enlarge) include Gold’s Battle for $1392 and Silver Inverse Head & Shoulders Bottom Chart:
Gold & Silver Bullion Video Analysis
Precious Metal ETFs Video Analysis
SF60 Swing Trades Video Analysis
Thanks
Morris
website: www.superforcesignals.com
related: Gold & Silver Trading Alert: Suspicious Reversal in Gold

-
I know Mike is a very solid investor and respect his opinions very much. So if he says pay attention to this or that - I will.
~ Dale G.
-
I've started managing my own investments so view Michael's site as a one-stop shop from which to get information and perspectives.
~ Dave E.
-
Michael offers easy reading, honest, common sense information that anyone can use in a practical manner.
~ der_al.
-
A sane voice in a scrambled investment world.
~ Ed R.
Inside Edge Pro Contributors

Greg Weldon

Josef Schachter

Tyler Bollhorn

Ryan Irvine

Paul Beattie

Martin Straith

Patrick Ceresna

Mark Leibovit

James Thorne

Victor Adair