
Current Affairs
Despite the global hardships of the COVID-19 pandemic, the world’s ultra high net worth (UHNW) population increased by 2.4% in 2020, reaching an all-time high of 521,653.
In this chart, we’ve used data from The Wealth Report 2021 by Knight Frank to list the 20 countries with the most UHNW individuals.

Each week Josef Schachter will give you his insights into global events, price forecasts and the fundamentals of the energy sector. Josef offers a twice monthly Black Gold newsletter covering the general energy market and 27 energy and energy service companies with regular updates. He holds quarterly subscriber webinars and provides Action BUY and SELL Alerts for paid subscribers. Learn more.
EIA Weekly Data: The EIA data on Wednesday March 17th was bearish for prices as both crude inventories rose and Gasoline demand waned. Commercial Crude inventories rose by 2.4Mb compared to a forecast of 2.1Mb and would have been higher by 1.5Mb if not for net crude imports falling by 219Kb/d. US production was flat at 10.9Mb/d,and is 2.2Mb/d below last year’s 13.1Mb/d of production. In the coming weeks this could recover another 1.1Mb/d to reach 12.0Mb/d as rig activity remains strong and some of the weather related production shut-ins come back on line. Private operators are driving the growth in production at the current time as large public companies are under pressure to pay down debt and provide shareholder returns.
Refinery Utilization recovered 7.1 points to 76.1% from 69.0% but remains below last year’s 86.4%. Overall Commercial Crude inventories are 47.1Mb above last year or up by 10.4% to 500.8Mb. This is the build problem we have been warning about. Inventories should continue to build until we start the summer driving season. This could add 40-60Mb of additional stocks in storage. Total Product consumed rose a modest 261Kb/d to 18.93Mb/d. Gasoline demand fell 264Kb/d to 8.44Mb/d. Gasoline inventories rose as a result of the greater refinery activity, by 0.5Mb. Jet Fuel consumption rose by 161Kb/d to 1.01Mb/d as the spring break travel season started. A post-pandemic high of 1.34M people travelled by air last Friday according to the US Transportation Security Administration (TSA). Overall US consumption of all products is 12% below a year ago, Gasoline demand is down by 13% and Jet Fuel demand down by 42%. Inventories at Cushing fell 600Kb to 48.2Mb and are up from 38.4Mb a year ago.
Baker Hughes Rig Data: The data for the week ended March 12th showed the US rig count off by one rig (one rig up in the prior week). Canada had a decline of 25 rigs (22 rigs lower last week) as we have ended the winter drilling season and breakup season has started. Canadian activity is 34% below last year when 175 rigs were working. In the US there were 402 rigs active, but that is down 49% from 792 rigs working a year ago. The US oil rig count fell by one rig. The Permian saw an increase of one rig to 212 rigs working and activity is 49% below last year’s level of 418 rigs working. The rig count for oil in Canada fell by 22 rigs to 58 rigs working and is down 50% from 115 rigs working last year. The natural gas rig count fell by three rigs to 58 rigs active and is down from 60 rigs working at this time last year.
Conclusion:
Crude oil prices have fallen nearly US$4/b from the high two weeks ago of US$67.98/b after the Saudi announcement of extending their official 1.0Mb/d production cut through April. This positive lift to crude has now been reversed as it appears that there has been significant OPEC cheating (Iran, Iraq, Libya, Nigeria and Venezuela) at the same time as the US brought back on 1.2Mb/d (from 9.7Mb/d to 10.9Mb/d). In the coming weeks we expect to see further US production additions and if there is OPEC cheating, as remains likely, world inventories will grow in Q2/21 and prices will have reason to retreat meaningfully. Today WTI is down due to the inventory build, concern about one of the vaccines’ efficacy in Europe, Germany’s exponential growth in infections from the more problematic mutations, and a bearish forecast by the IEA. WTI is now trading at US$63.93/b, down $0.87/b on the day.
Iran in the meantime is selling more oil into China and has plans to increase sales to India in the coming months as they see the Biden administration wanting a nuclear deal and willing to ignore Iran’s cheating on sanctions. The buyers love the lower prices ($3-5/b below Brent) that Iran is offering and as well payment terms are very generous with refiners not paying for the crude until after it is processed. Iran had been shipping indirectly to China on average 306Kb/d in 2020 but this rose to 600Kb/d in January 2021, to 850Kb/d in February and to 856Kb/d in March, according to Reuters and Chinese customs data. OPEC’s next meeting is on April 1st to discuss production levels for May.
Technically the support levels for WTI crude are now US$63.13/b (not much below where we are now) and then US$58.60/b. Energy and energy service stocks are overbought and have been chased by hot momentum money and quarterly window dressing as we near the end of Q1/21. We remain in the bear camp now. The most vulnerable companies are energy and energy service companies with high debt loads, high operating costs, declining production, current balance sheet debt maturities of some materiality within the next 12 months and those that produce heavier crude barrels. Results for many companies for Q4/20 have been released and were not strong enough to justify current lofty stock price levels. If crude prices retreat these stocks could get battered. Commercial hedgers have added to their short crude positions and now are short 1.72BB, and net short 644Mb. They clearly expect to be able to buy back their short positions at much lower price levels. Speculative holders are long 586Mb, up 30Mb over the last week.
We got a 100% SELL signal since January 14, 2021. Subscribers of our regular SER service were notified of this on January 14, 2021 and were informed of 14 stocks and the prices at which we think should be harvested. We sent out a second SELL Alert on February 5th and added four additional ideas for harvesting. The next few months could see significant downside for the energy sector. The topping process for the general stock market is ongoing and some event will prick this bubble. Rising interest rates appear to be the most likely reason as the US 10-Year Treasury yield has increased to a new 2021 high of 1.69% (up 5 BP today) more than triple the 0.52% of last August.
Last week we got a second 100% Bullishness signal which is the first time in our career that we have seen back to back clear SELL signals in any one year. The danger is clear.
Energy Stock Market: The S&P/TSX Energy Index now trades at 121 and is part of a lengthy, extended, and broadening topping process from the peak at 128. The S&P/TSX Energy Index is likely to fall substantially in the coming months. A breach of 117.81 should initiate the sharp decline. A more important support level to plunge through is 107.66.
I will be on MoneyTalks radio on the Corus (Global) network with Michael Campbell this Saturday March 20th at 10AM MT. If interested in our discussion on the risks in the general stock market and the energy market specifically, please listen in. We are planning to add coverage of pipeline and infrastructure stocks as well as some special situations that will benefit from a strong economy in Western Canada once this current corrective phase is over.
Subscribe to the Schachter Energy Report and receive access to our two monthly reports, all archived Webinars, Action Alerts, TOP PICK recommendations when the next BUY or SELL signal occurs, as well as our Quality Scoring System review of the 27 companies that we cover. We go over the markets in much more detail and highlight individual companies’ financial results in our reports. If you are interested in the energy industry this should be of interest to you.
To get access to our research go to https://bit.ly/34iKcRt to subscribe.

The Fed-dy Bears’ Picnic
“If you go down in the bonds today; You’re sure of a big surprise
If you go down in the bonds today; You’d better go in disguise!
For every bear that ever there was will gather there for certain
Because today’s the day the Fed-dy Bears have their picnic
Picnic time for Fed-dy Bears; The little Fed-dy Bears are having a lovely time today
Watch them, catch them unawares; And see them picnic on their holiday
See them gaily gad about; They love to play and shout; They never have any cares
At 6 o’clock this trading fad-dy; Will put its books to bed; Because they’re tired little Fed-dy Bears
Every Fed-dy Bear who’s been good is sure of a treat today
There’s lots of marvellous things to tweet and wonderful games to play
Beneath the trees where *everyone* sees; They’ll hide and seek as long as they please
‘Cause that’s the way the Fed-dy Bears have their picnic”
We have a long wait ahead of us for a critical Fed meeting and one has to kill the time as productively as one can: I apologize for nothing. Yes, we can focus on weak US retail sales and industrial production data yesterday, which is bond bullish; we can focus on the risk-off North Korea leader’s sister stating “We take this opportunity to warn the new US administration trying hard to give off gun powder smell in our land” (which was not about flatulence); or the latest suggestion that US officials will bring up Hong Kong and Taiwan when they meet Chinese officials in Alaska tomorrow, which is hardly risk on. You can even mention that Germany seems to have the same negotiating tactic with the US over Nordstream2 as North Korea does with its nukes: just keep building and expect the Americans to eventually live with it.
But the long and the short of it is that it’s all about the Fed, and if they display any sign at all of shifting the dot plot towards rate hikes from as early as 2023. That’s especially true given the possibility this will be a period following not just the USD1.9 trillion stimulus package, but a USD2.0-2.5 trillion infrastructure bill too – in which case one would suppose the underlying pressure for higher rates would be strong…if things still work the way the textbook says they are supposed to re: liquidity > investment > wages > inflation. Which they clearly don’t right now.
One of the big headlines is that following a UK court loss, Uber are reclassifying their 70,000 British drivers as workers rather than self-employed capitalists en route to global transport domination. This entitles them to benefits, which would be a pay rise in kind. Is this the harbinger of labour winning vs. capital? Consider that Uber are claiming this only covers time spent driving, so waiting around for a fare doesn’t count towards pay: does that sound like a strongly-unionised working environment? As the grandson of a cabbie, it sounds like being a taxi-driver. (Uber will potentially have issues with VAT payments due to the government: but that’s another story.)
Back to the Fed. As I’ve already noted recently, it would be odd if they tried to flag inflation concerns given the Treasury are arguing these are “small” and “manageable”: surely they won’t want to show any policy disconnect? As such, and like the RBA just did, the risks appear that most members still won’t flag rate hikes by 2023 despite the recent upturn on overall data, on the US vaccination effort, in commodity prices, and in fiscal stimulus.
In which case, while short end bond yields would of course stay low, the risks are also that long yields react further to all this “running hot”. So, yes, it could be picnic time for Fed-dy bears. Could this look like the 2013 Taper Tantrum, where US 10s jumped 136bp (to 3.06%)? Could it even look like the 1994 Bond Massacre, where US 10s leaped 245bp trough to peak (to 8.05%)? However, before one gets ‘Uber-excited’, the fact that one peak was 8.05% and another was 3.06% shows you just what happened to the US structurally in the two decades in-between. It’s going to take a lot of US infrastructural changes, in many senses of the term, to get us back towards anything close to 2013 US yield levels, let alone 1994.
Nonetheless, in the meantime the rest of the world has followed that general yield collapse and new-normal path, and hence even a moderate move higher in yields could be painful – and not just to bonds. Yes, there are US stocks to worry about. But also note the headline ‘China braces for “turmoil in financial markets” following new US stimulus’. Of course, it’s not the only one. Key EM are now having to actively think about raising rates despite still being in the throes of the Covid epidemic. The higher US bond yields go, the more capital could flow back to the US and USD. That’s one form of turmoil – and very 2013.
Yet even if the Fed does not provide a picnic for bond bears today, via some form of curve action to match the dot plot, we still get turmoil anyway. How well are EM (and DM) set up for a much weaker USD (and yet higher commodity prices), for example?
It was to be expected, if deeply ironic, that Chinese officials oppose a US fiscal deficit of over 15% of GDP; the promise of massive infrastructure spending; all backed by a pliant central bank; with aims of social stability; and suggestions of protectionism to lock this liquidity in; and hopes the currency moves lower. Takes one to know one? But rather than accept the expected flood of hot capital inflows –pushing up CNY, blowing bubbles, and seeing jobs exported along with manufacturing– suggestions are they will encourage more capital to flow straight back out again. In which case, it’s more of a Fed-dy bulls picnic globally. But somebody is going to end up with an over-valued currency, hitting exports, and assets, hitting financial stability.
There are many other ways this can play out too, depending in large part on how the US reacts – but all of them suggest the risk of significant market and geopolitical volatility, to which today could well be a key milestone.
But that’s enough for now. I am a tired little Fed-dy bear, and today will likely be no picnic.

TikTok wants to keep tracking iPhone users with state-backed workaround
Some of China’s biggest technology companies, including ByteDance and Tencent, are testing a tool to bypass Apple’s new privacy rules and continue tracking iPhone users without their consent to serve them targeted mobile advertisements.
Apple is expected in the coming weeks to roll out changes it announced last June to iPhones that it says will give users more privacy. Until now, apps have been able to rely on Apple’s IDFA system to see who clicks on ads and which apps are downloaded.
In the future, they will have to ask permission to gather tracking data, a change that is expected to deal a multibillion-dollar bombshell to the online advertising industry and has been fought by Facebook, since most users are expected to decline to be tracked.
In response, the state-backed China Advertising Association, which has 2,000 members, has launched a new way to track and identify iPhone users called CAID, which is being widely tested by tech companies and advertisers in the country.

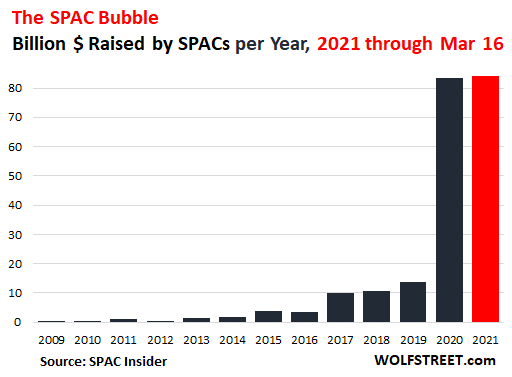
SPACs Are Lining Up as the Next WTF Chart of the Year
Who’s going to be the sucker? Even the SEC, which has been asleep through all this, warns retail investors. But in the current mega-bubble craze, no one gives a hoot about anything anymore.
SPACs – Special Purpose Acquisition Companies, or more descriptively, “blank check companies” that have no operations – have accomplished a huge feat that fits seamlessly into the current mega-bubble craze.
So far this year, as of today, 260 SPACs went public and raised $84 billion with their IPOs, according to data provided by SPACInsider. This is a big moment because it exceeded the total amount raised during the entire year 2020 of $83 billion, which itself had been six times as large as the prior full-year record in 2019. At this pace, SPACs are forming the next WTF chart of the year:


-
I know Mike is a very solid investor and respect his opinions very much. So if he says pay attention to this or that - I will.
~ Dale G.
-
I've started managing my own investments so view Michael's site as a one-stop shop from which to get information and perspectives.
~ Dave E.
-
Michael offers easy reading, honest, common sense information that anyone can use in a practical manner.
~ der_al.
-
A sane voice in a scrambled investment world.
~ Ed R.
Inside Edge Pro Contributors

Greg Weldon

Josef Schachter

Tyler Bollhorn

Ryan Irvine

Paul Beattie

Martin Straith

Patrick Ceresna

Mark Leibovit

James Thorne

Victor Adair