Stocks & Equities
- Powell was not concerned by higher yields early last week but he may change his tune on 4 March
- Brainard has already admitted that more recent price action has caught her attention
- We expect Powell to flag scope for a policy response if rising long-term yields threaten recovery
The key event for the market this week would usually be the US non-farm payroll report but focus is instead centred on Fed Chair Powell’s speech on 4 March. We doubt that he will signal near-term Fed policy action in response to the recent UST yield volatility. Given current yield levels and financial conditions, it is difficult to justify such a move without appearing to be driven solely by market developments. However, we see scope for Powell to flag potential for a Fed policy response if it starts to consider rising long-term yields a threat to the recovery. He is unlikely to mention options such as extending the duration of UST purchases or an Operation Twist, but we suspect this is the route the Fed would take, if action were needed.
In his 23-24 February congressional testimony, Powell gave no sign that he was worried about the rise in long-term UST yields. This was consistent with comments from other FOMC members. We suspect, however, that the price action on 25 February, when 10Y spiked to 1.60%, did cause concern. Fed Governor Brainard remarked on 2 March that “some of those moves last week and the speed of the moves caught my eye”. Moreover, she stated that she would be concerned if she saw “disorderly conditions or persistent tightening in financial conditions that could slow progress” toward the Fed’s full employment and 2% average inflation goals.
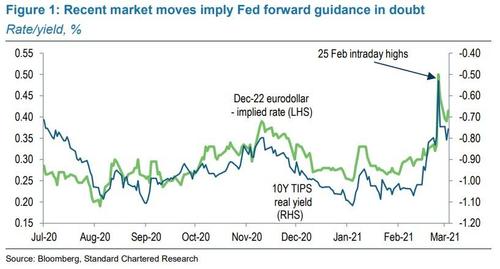
In terms of UST yields, we think Powell’s speech should support the calmer price action seen so far this week, as the market will likely conclude that 1.50-1.60% for the 10Y is, near-term at least, the top of the Fed’s comfort zone. Simply repeating the Fed’s current forward guidance and its view that near-term inflation will be transitory, however, runs the risk of allowing renewed yield upside (Figure 1).
Speed and composition of yield move may be key to Fed action
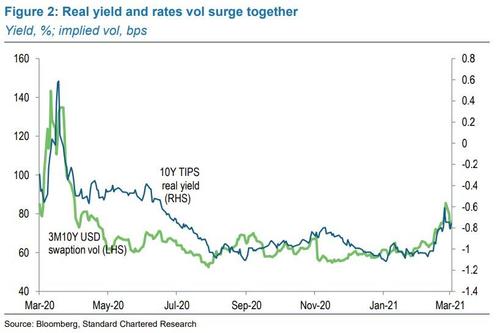
Until mid-February, the rise in UST yields and steepening of the curve since Q3-2020 was in keeping with the broader reflation trade across asset classes, and implied USD rates vol was extremely well behaved. The move in the 10Y UST yield from 0.5% last August to 1.20% was almost 100% explained by the rebuild in the breakeven inflation spread. The last fortnight, however, has seen the real yield component become the key driver of the 10Y UST yield and USD rates vol rose to its highest since the peak of the pandemic-related panic nearly a year ago (Figure 2).
Our interpretation of the move is that the UST market hit the limit of the reflation trade before expectations for growth and inflation strengthened sufficiently for investors to question how far the Fed’s dovish forward guidance would hold. In other words, the market started to price in an outlook buoyant enough to force the Fed to taper, and eventually to hike, earlier than its forward guidance suggests. Hence, the real yield, previously anchored by the Fed UST purchases, near-zero policy rate and forward guidance thereon, suddenly surged. At its intraday high on 25 February, it had risen by 50bps in the space of two weeks.
If Powell does change his tone in a similar fashion to Brainard, we doubt that he would dissect the recent price action from a real yield perspective as we have, for fear of implying that the Fed has an implicit real yield target. However, he could say that the Fed is closely watching inflation expectations as an early warning signal that higher long-end yields might threaten the recovery and progress toward the Fed’s 2% average inflation target (AIT). Having reached 2.25% in mid-February, at the height of the volatility last week, 10Y breakevens fell as low as 2.05% and the 5Y/10Y breakeven curve is now its most inverted ever. Hence, Powell could reasonably say that, while longer-term inflation expectations are still broadly anchored, the Fed would be concerned if they fell any further.
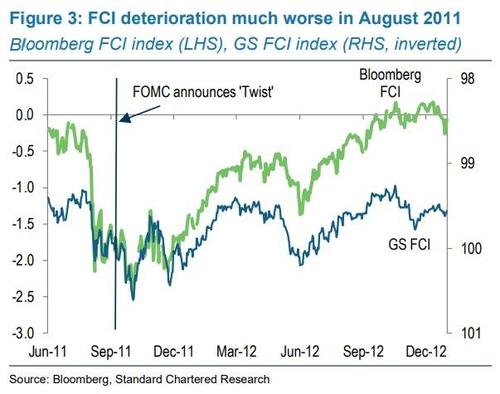
The short end of the yield curve has been suffering from excess liquidity and undesired downward yield pressures, while the long end has experienced undesired abrupt upward moves. It is tempting to see an Operation Twist or weighted-average maturity extension as solving both problems, but there is a major difficulty. Back in 2011, the FOMC move to Twist solved a monetary policy problem. Asset markets had sold off significantly in the aftermath of the debt ceiling crisis and financial conditions indices (FCI) had visibly tightened (Figure 3).
5Y5Y inflation breakevens had come off more than 70bps between end-July and early September.
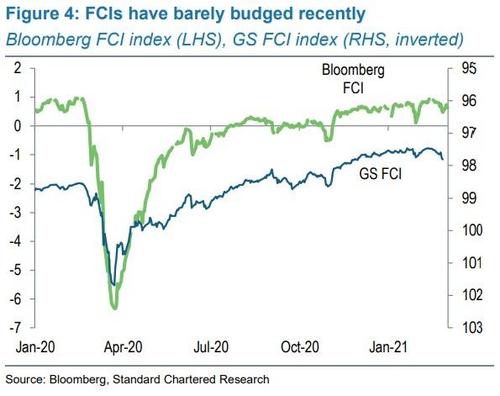
In contrast, financial conditions have barely budged in recent weeks from extremely accommodative levels and the move in breakevens has been much more modest (Figure 4).
We could see a renewed Operation Twist if economic and financial market conditions deteriorated, but the evidence for such deterioration is scant. As traumatic as recent weeks have been for fixed income investors and as much as the Fed would welcome higher short-term and lower long-term yields, the current yield curve issues do not look like monetary policy issues. Hence, we expect a warning of policy moves on further deterioration rather than immediate action.
Bitcoin recently hit the $50k milestone. If that feels pricey, how about a share of the largest US cryptocurrency exchange?
Presenting Coinbase (ticker: COIN). The company has been valued at $100B+ in private secondary trading, which would make its direct listing the largest tech debut since Facebook.
For comparison, its last funding round (2018) valued it at a slightly lower number… $8B.
The business of Coinbase
According to Coinbase’s S-1, the current financial system is an inefficient and costly patchwork of intermediaries. There’s a need for a new, digitally native financial system — AKA the crypto economy.
Coinbase has built an end-to-end infrastructure to enable a safe and user-friendly platform to buy, store, and use crypto assets:
- Cryptocurrency exchanges: There’s a regular and a pro version for more sophisticated investors.
- Wallet service: Where customers can safely store their cryptocurrencies.
- Coinbase commerce: Online retailers can use this software to accept cryptocurrency. Think Paypal, but for crypto.
- Coinbase card: A physical debit card allowing people to spend cryptocurrency in the physical word
Why the potential $100B valuation?
Coinbase is one of the largest global cryptocurrency exchanges. Its strengths include:
- Flywheel effects: As more products develop and more consumers join the platform, more retail users, institutions, and other partners (developers, merchants, etc.) will come to the site.
- Huge industry growth: The market cap of crypto assets went from $500m in 2012 to $782B by 2020 — 150% growth per year.
- Rapid revenue increase: Coinbase more than doubled its revenue in 2020 to ~$1.3B. There are 43m retail users, mostly from word-of-mouth marketing.
- Steady profitability: Unlike many high growth tech companies, Coinbase has been largely profitable in recent years — ending 2020 with $322m in net income.
A watershed moment for crypto at large
Beyond a lucrative exit for founder Brian Armstrong (who already made a cool $60m in 2020 alone), a strong IPO would be a large step for legitimizing the crypto.
Critics view the industry as risky and experimental at best, lawless and illicit at worst. Even tech behemoths like Square and Tesla are just starting to buy Bitcoin.
Successful or not, Coinbase’s IPO is going to make history. No pressure, mate.
(Read our full Coinbase breakdown here)
Each week Josef Schachter will give you his insights into global events, price forecasts and the fundamentals of the energy sector. Josef offers a twice monthly Black Gold newsletter covering the general energy market and 27 energy and energy service companies with regular updates. He holds quarterly subscriber webinars and provides Action BUY and SELL Alerts for paid subscribers. Learn more.
EIA Weekly Data: The EIA data on Wednesday March 3rd was clearly bearish. Commercial Inventories rose by a colossal 21.6Mb on the week compared to a forecasted decline of 735Kb. The biggest part of the difference was due to US production rising by 300Kb/d to 10.0Mb/d and net imports rising by 1.665Mb/d or by 11.6Mb on the week offset by lower Refinery Utilization and lower product components being made. Overall Commercial Inventories are 40.5Mb above last year or up by 9.1% to 484.6Mb. This is the build problem we have been warning about. It is just starting and will be a factor until we get into the summer driving season. Total Product demand rose a modest 72Kb/d. The best component was Gasoline Demand which rose 942Kb/d to 8.148Mb/d as driving picked up with better weather driving conditions. However this consumption level is down 11% from 9.186Mb/d consumed last year. Refinery Utilization fell 12.6 points to 56.0% from 68.6% as most of the Texas refinery industry was shut down and maintenance season is starting. Last year at this time Refinery Utilization was 86.9%. Because of this lower utilization Motor Gasoline Inventories fell 13.6Mb and Distillate Inventories fell by 9.7Mb. Inventories at Cushing rose 500Kb to 48.3Mb and are up from 37.2Mb a year ago.
Baker Hughes Rig Data: The data for the week ended February 26th showed the US rig count up by five rigs as the effects of the freezing weather in Texas subside. Canada had a decline of nine rigs as we are ending the winter drilling season and as the weather warms up, the break up season will start. Activity is 32% below last year when 240 rigs were working. In the US there were 402 rigs active, but that is down 49% from 790 rigs working a year ago. The US oil rig count rose by four rigs and there was a one rig increase for natural gas drilling. The Permian saw an increase of four rigs to 208 rigs working and activity is 49% below last year’s level of 411 rigs working. The rig count for oil in Canada fell by eight rigs to 92 rigs working and is down 44% from 163 rigs working last year. The natural gas rig count fell by one rig to 71 rigs active and is down from 77 rigs working at this time last year.
Conclusion:
We believe that there is a total of US$14-16/b of downside risk for WTI. WTI crude is down US$3/b over the last week, from the high of US$63.75/b to today’s US$60.69/b. Crude is lifting today due to product levels having sharp declines and a rumour as I am writing this that some in OPEC are recommending no increase in supplies in April. We are skeptical that such a deal will occur. Russia and many OPEC countries want to add more volumes as they need revenues desperately.
The top line commercial inventories should swing prices negative at some point after the OPEC meeting. A breach of US$58.60/b should start a rapid decline to the US$50-52/b area as the speculative horde retail money exits another losing trade. OPEC meets tomorrow March 4, 2021 to ease curbs and are likely to increase production 500Kb/d in April to lower Brent and WTI crude prices without impacting the nascent economic recovery or giving incentive to the US shale industry to increase production. Russia and Iraq are the most interested in seeing quotas raised with Russia alone wants to raise production by 250Kb/d. In addition, Saudi Arabia will be disclosing when they bring on their cut of 850,000 b/d that they removed in February. It was supposed to have been a 1.0Mb/d cut for February and March.
Technically the support level for WTI crude is US$58.60/b. Energy and energy service stocks are overbought and have been chased by hot momentum money. We are clearly in the bear camp now. The most vulnerable companies are energy and energy service companies with high debt loads, high operating costs, declining production, current balance sheet debt maturities of some materiality within the next 12 months and those that produce heavier crude barrels. Results for Q4/20 are being released and are not strong enough to justify current lofty stock price levels if crude prices retreat. Some oil companies still have very high debt loads and when oil prices retreat their debt/cash flow ratios will become more precarious. These will face the largest percent declines.
We have had a SELL signal since January 14, 2021. Subscribers of our regular SER service were notified of this on January 14, 2021 and were informed of 14 stocks and the prices at which we think they should be harvested. We sent out a second SELL Alert on February 5th and added four additional ideas for harvesting. The next few months could see significant downside for the energy sector. The topping process for the general stock market is ongoing and some surprise events will prick this bubble.
Energy Stock Market: The S&P/TSX Energy Index now trades at 115 and is part of a lengthy, extended, and broadening topping process. The S&P/TSX Energy Index is expected to fall substantially in the coming months. A breach of 103.60 should initiate the sharp decline.
Our Q1/21 120-minute recorded webinar took place on Thursday February 25th at 7PM MT. There were two investment presentation sections. The first covered the downside parameters we see for the stock market depending upon which of the many mania bubbles burst. The second section discussed how to build an energy portfolio for the new Energy Bull Market that we foresee lasting into 2025 after the coming market correction. The different approaches that conservative, growth and entrepreneurial investors should consider were discussed. Individual ideas for each investor approach were also covered.
We also have decided to expand our product and add coverage of the pipeline and infrastructure areas via a Level Two research product. This will occur over the coming months. Consideration of covering special situations that would benefit from a resurging western Canadian economy is also being considered as part of the expanded product offering.
If you want to listen to our webinar in the archive please go to our subscriber page and become a subscriber. For new subscribers, the quarterly choice gives you three months to see if the product meets your needs.
Subscribe to the Schachter Energy Report and receive access to our two monthly reports, all archived Webinars, Action Alerts, TOP PICK recommendations when the next BUY or SELL signal occurs, as well as our Quality Scoring System review of the 27 companies that we cover. We go over the markets in much more detail and highlight individual companies’ financial results in our reports. If you are interested in the energy industry this should be of interest to you.
To get access to our research go to https://bit.ly/3jjCPgH to subscribe.
Here’s a list of pandemic winners we are all familiar with: Amazon, Moderna, and Zoom.
After it reported earnings on Tuesday, we can safely add Target to the mix.
Over the full year ended Jan. 30, the retailer posted revenue of $93.6B — up 20% YoY and a greater increase than in its previous 11 years combined, per the Wall Street Journal.
In a major flex…
Target estimates $9B of those sales were taken from competitors
How did Target do so well during the pandemic vs. giants like Amazon and Walmart?
Here’s a great breakdown from WWD:
- Omnichannel options: Target has been investing in its digital business for years and — when the pandemic hit — shoppers could buy online, do delivery as well as in-store and curbside pickups (often through its easy-to-use app). In particular, pickups are very economical for stores with shoppers effectively providing “labor.”
- Diverse product mix: While shoppers nabbed essentials at the start of the pandemic, they’ve been spending more on discretionary items, especially during the holidays. Costco and Walmart are 60%+ groceries. Target is only 20% groceries and makes up the balance with apparel, home goods, and other discretionary items.
- Real estate: Unlike Walmart, which is known for its Supercenters, Target has focused on smaller store sizes. These 1.9k “small-retail” stores are conveniently located and serve as great local fulfillment centers for its ecommerce business. Target’s ubiquity is great for brand awareness, too.
- Exclusive and popular brands: Hot fashion and beauty brands used to fight over shelf space in department stores. These same brands now want in on Target to capitalize on the store’s foot traffic.
Speed: Target is utilizing all of its stores to boost same-day options (delivery or pickup), which is up 700% YoY.
That cushioned the blow of the pandemic, but raises some hard questions about what Canada got for all that spending.
The economy shrank 5.4% last year, Statistics Canada said Tuesday, the sharpest annual decline in the post-World War II era and the third straight year in which it underperformed the U.S. economy. That’s despite Canadians receiving C$20 ($16.55) in government transfers for every dollar of income lost, according to government data.
Treated to larger handouts, Canadians mostly hoarded them, potentially opening Trudeau’s government to criticism it has wasted money on programs that spread cash quickly but inefficiently. As one opposition lawmaker likes to put it: “The government spent the most to achieve the least.”


