
Real Estate
The city of Vancouver condo owners, especially investors have taken it on the chin recently. As mentioned in our last condo market update, Vancouver proper condo values were down to $861,000 in October. Then news broke, vacancy homes tax will triple to 3% for 2021. Fast forward a couple of weeks and the average sales price has dropped to $765,875. A $96,000 lost month over month. Doubtful the substantial decrease in prices resulted from the tax increase, which could be a sign of more losses to come during 2021.
From zenith to current prices the city of Vancouver condo values have lost more than $325,000 (-30%). To be fair as evidenced by the chart below the sales price of $1.1M occurred for one month only. In the name of fairness, let’s take prices that were tested multiple times, and call that the peak: $970,000 (top green line). Using that as a true market top the losses are still substantial. The resulting loss after 3 years of ownership is $205,000. Also important is now that Vancouver prices being at $765,875, implies all previous gains since 2017 have been erased. As prices during Jan 2017 were $774,227.
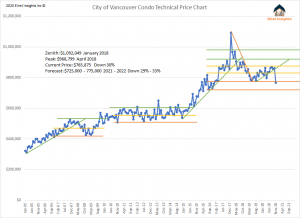
The established losses, has resulted in the average price entering into the low echelon Eitel Insights forecasted market cycle. As noted previously, we believe the market cycle would test as low as $725,000-$775,000. With prices dropping to $765,000, many markets inside of Vancouver proper, are ripe for purchase. Especially for those who are planning to owner occupy.
At current price levels, owner occupied purchasers who have been advised to wait by Eitel Insights can finally begin to hunt for purchases. With many areas inside of Vancouver entering into their forecasted market lows, signals excellent purchasing opportunities based on our analytical interpretation.
A 10% drop from peaks is considered a correction, a 20% is a recession, and 30% drop has no definition other than, “ouch”. From the zenith to current levels condo values have dropped 30%. The true peak of prices occurred during Feb and April 2018 at $970,000 (top green line) indicating a 21% loss. Any way you slice it the city of Vancouver’s condo market has hit recession levels.
Point of interest. After a significant trend line is broken as is the case for the city of Vancouver price chart, the market tends to become volatile for a short period. This could result in some wild swing in the price chart. These swings could result in prices temporarily returning to the middle threshold or hurl prices to the lowest edge of the market threshold. Over the longer term, the break of the uptrend will likely result in condo values selling in the lower half of the market cycle, until the market consolidates prices with a forecasted bottom between of $725K – $775K range.
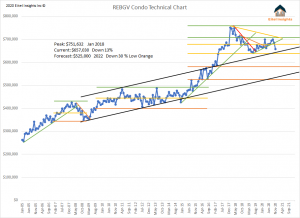
Greater Vancouver overall, broke its’ uptrend as well. Condo values dropped to $657,000 indicating a 13% drop from the peak in prices. As stated after a trend is broken, volatility is likely to ensue in the short term. This volatility could result in Greater Vancouver prices possibly rising back up in an attempt to regain position inside of the uptrend, or could send prices down to test the low yellow threshold which is the near term low of $635,000.
If prices do decrease to $635,000 in the short term, that would create a very important test to the upper echelon of the prolonged uptrend (top black uptrend). Prices will likely find near term support based on the prolonged trend. Once the upper threshold of the prolonged uptrend breaks the overall condo market will experience intense volatility.
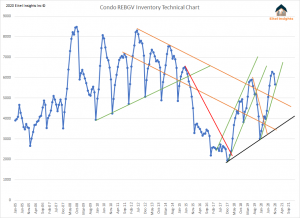
The overall condo inventory for Greater Vancouver during November was 5,669 active listings. At that level the data is challenging the yearly uptrend. It would be an odd occurrence if inventory increases during the month of December. However, during 2020, seemingly anything is possible.
During 2021 Eitel Insights anticipates inventory levels to surpass the 7,000 active listings a feat not accomplished since 2014. With the new additions from the completed presale, the notion of the total inventory surpassing 8,000 is a real possibility as well.
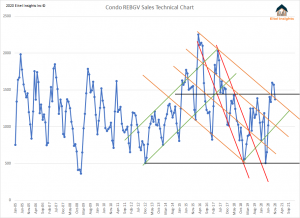
Sales dipped back into the established downtrend and low sales channel during November. The total sales were 1,373. There has been a clear cut difference between the detached and condo purchasing mentality that was born out of the Covid pandemic. The pulled forward demand never arrived in the condo market. The rise in data was merely the pent up demand experienced during the initial lock down. As more and more inventory is brought to the market at decreased price point, the notion of overpaying for a depreciating asset will result in buyers becoming hesitant to purchase. This will exacerbate the supply demand dynamics, which have been changing from the sellers favour to the buyer.
As the overall market indicates the Greater Vancouver condo market is in the middle of the projected market cycle and down 13%. While areas inside of Vancouver proper have dropped closer to 30%.
Individual markets inside of Greater Vancouver prices, and trends vary. To receive actionable intelligence for your personal or investment property become and Eitel Insights client.
Dane Eitel, Eitel Insights
Founder & Lead Analyst
604 813-1418
Watch Eitel Insights latest video:

L-Shaped Recovery for Air Lines. Staking their future on a vaccine.
American Airlines on Friday, and Delta Air Lines on Thursday, warned about once-again slowing bookings. The highly profitable business air travel segment remains essentially in zombie-status, but leisure travel perked up a little in recent months, and over Thanksgiving inched up further by a microscopic amount. But total travel remains woefully down from last year even during the best day, and is now heading lower again.
The number of passengers going through TSA checkpoints to enter the secured areas at US airports during the post-Thanksgiving week through Saturday, December 5, compared to the same weekday in the same week last year, showed the deterioration: between -64.2% and -69.2%. And what the airlines warned about is a decline of bookings from these already low levels.
The chart shows the total number of TSA checkpoint screenings in 2020 (red) and 2019 (green) for each day and the seven-day moving average (bold lines). The four spikes of over 1 million daily screenings over the Thanksgiving travel period (Friday Nov 20; Sunday Nov 22; Wednesday Nov 25; and Sunday Nov 29) were a pale imitation of last year’s spikes during that time, but on the best of these days, Nov 22, the year-over-year decline narrowed to -54.9%, which was the least worst collapse since the collapse of the airline business started in March: CLICK for complete article

The Past Week, In A Nutshell
What Happened: In light of hopes for a sustained economic rebound, U.S. broad market indices pushed to new all-time highs.
Remember This: “[T]he third wave is now hitting the economy harder than we thought and that the damage is likely to keep adding up in coming months, until we get vaccines widely deployed,” said Brad McMillan, chief investment officer for Commonwealth Financial Network.
“The two key factors in how bad it will get are whether infection growth crests and whether the federal government steps in with another round of stimulus.”
Technical
During much of the week, participants lacked the conviction to break through to new highs.
However, conditions markedly improved after Thursday’s long liquidation on Pfizer Inc news flushed out weak-handed participants, and responsive buyers surfaced. The quick recovery of the balance-area high suggested the news was immaterial.
During Friday’s regular trading, initiative buyers extended range — through the $3,682.00 balance-area high — separating and accepting value above the week-long balance-area.
Therefore, given the acceptance of higher prices, participants must monitor whether S&P 500 spends time trading above the $3,682.00 balance boundary. An initiative drive below that figure would portend a potential response at the $3,667.75 high-volume node. Auctioning further below that value would denote a clear change in conviction. The line in the sand is the $3,640 balance-area boundary. Auctioning below that figure puts the rally on hold.
All in all, though sentiment and positioning imply limited potential for upside, the S&P 500 remains in an uptrend after confirming a multi-month balance-break.
Fundamental
In a commentary, Nasdaq’s Phil Mackintosh discussed new proposed actions from the SEC…CLICK for complete article

“These politically correct language initiatives are misguided and harmful. They create highly entitled professional “victims” who expect to be free from any offense, and they engender a stifling atmosphere where all individuals walk on eggshells lest they might commit a linguistic capital crime.”
Gad Saad, author, The Parasitic Mind
The greatest validator for a successful startup’s technology is a customer.
For recently TSX-V listed Plurilock Security, they count the United States of America as one of the first to buy into their next-generation identity authentication technology.
This includes government contracts with the US Army and US Department of Defense. The company also announced this year its third contract with the US Department of Homeland Security to continue its development of authentication and anomaly detection tools. The true potential of Plurilock’s solution, based on behavioural biometrics and artificial intelligence (AI), is its ability to cross all borders, industry verticals and pre-existing commercial relationships.
“Our success with the U.S. federal government is really a reflection of our technology’s value. We didn’t have any government experience or relationships yet succeeded despite not being ingrained in this market which I think is even more impressive and powerful,” says Ian Paterson, CEO of Plurilock.
The U.S. federal government relationship is a great validator and made “people stand up and take note of what we’re doing,” adds Paterson. Plurilock’s solution is targeted to middle-market companies and larger, with a focus on financial services, health care, critical infrastructure and government sectors.
In September, Plurilock signed on a senior company in the financial services sector following an extensive series of proof-of-concept and testing deployments. Of note, the U.S.-based customer knocked on Plurilock’s door first. Plurilock is now expanding its sales and marketing resources to aggressively go after market share in the commercial space.
“We’ve seen a lot of traction in the financial services sector, specifically mid-sized institutions. It’s a mix of asset managers and regional banks. In the U.S., particularly for institutions in that 1,000 to 50,000 employee size, there is a real unmet need for innovative AI driven security products like ours. There are 3,000 institutions in the U.S. alone that are in our sweet spot.”
Plurilock’s next-generation technology solution focuses on identity and access management, a realm traditionally done with physical devices and PIN codes or passwords. Through behavioural capabilities, Plurilock’s products can authenticate people at the time of login as well as continuously throughout the day – always-on security.
Plurilock’s patent-protected technology is the result of more than 35,000 hours of university research by a team comprised of the foremost peer-reviewed experts in their field. The company went public in September to scale growth through expanded and dedicated sales/marketing resources and strategic acquisitions.
“Cybersecurity is a team sport. You can’t as a business buy one cyber security solution and be safe. Larger companies may have two dozen different end-point solutions and need a whole team of cybersecurity vendors in order to be secure,” says Paterson. “We are seeing a trend toward vendor consolidation. For Plurilock, we want to add products and services to round out our offering. We’re interested in building a big business here.”


-
I know Mike is a very solid investor and respect his opinions very much. So if he says pay attention to this or that - I will.
~ Dale G.
-
I've started managing my own investments so view Michael's site as a one-stop shop from which to get information and perspectives.
~ Dave E.
-
Michael offers easy reading, honest, common sense information that anyone can use in a practical manner.
~ der_al.
-
A sane voice in a scrambled investment world.
~ Ed R.
Inside Edge Pro Contributors

Greg Weldon

Josef Schachter

Tyler Bollhorn

Ryan Irvine

Paul Beattie

Martin Straith

Patrick Ceresna

Mark Leibovit

James Thorne

Victor Adair