
Asset protection
We have recently written a couple of posts about the “exuberance” that has invaded the market since the election. Such is often seen near short- to intermediate-term peaks in markets as investors go “all-in” without a net.
It was on December 5th, 1996, during a televised speech, that Fed Chairman Alan Greenspan stated:
“Clearly, sustained low inflation implies less uncertainty about the future, and lower risk premiums imply higher prices of stocks and other earning assets. We can see that in the inverse relationship exhibited by price/earnings ratios and the rate of inflation in the past. But how do we know when irrational exuberance has unduly escalated asset values, which then become subject to unexpected and prolonged contractions as they have in Japan over the past decade?”
It is an interesting point that the U.S. has sustained low rates of inflation combined with monetary and fiscal stimulus, which have lowered risk premiums, leading to an inflation of asset prices.

Nov. 24 is generating the second-highest daily price ever for Bitcoin, with November already its best month in terms of dollar gains.
Bitcoin (BTC) is currently having its second-highest trading day ever as BTC/USD is hitting a new multiyear high of $19,330.
Data from Cointelegraph Markets and TradingView provides a cause for celebration on Nov. 24 after Bitcoin suddenly tackled $19,000 resistance.
BTC price sees second-best day ever
Against a backdrop of rapid gains and the temptation of breaking all-time highs around $20,000, the achievement has not gone unnoticed on Bitcoin figures.
Ryan Selkis, founder of data resource Messari, noted that on only one day in its existence has Bitcoin traded above even $19,000.
By contrast, the largest cryptocurrency has now spent 283 days above $10,000 — including its longest-ever stint in 2020.
Meanwhile, Bitcoin has gained more in U.S. dollar terms than any month in its history, data shows. In a tweet on Nov. 24, quantitative analyst PlanB highlighted that the past three and a half weeks have been unlike any other period in Bitcoin’s lifetime…CLICK for complete article

Mortgage in arrears have increased 22% since Eitel Insights indicated a rise was imminent. That is only a tenth of the anticipated increase to occur over the upcoming years. Rising mortgages in arrears does not make the market go lower in and of itself. Rising numbers or delinquent mortgages is a symptom of the BC real estate market in decline and a weakened economy.
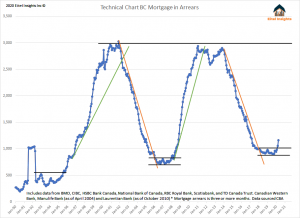
Evidenced by the chart, this is only the third time in four decades that delinquent mortgages were this low. In every instance previous once the data broke above the low resistance level, mortgages in arrears rose dramatically. Simultaneously the home prices across greater Vancouver declined. The most recent example was 2008 – 2009. The recession was short lived, due in large part to the winter Olympics of 2010 coming to town. That made it nearly impossible for the economy to slow down for long. However a 21% recession still managed to occur even during the short time frame.
The 1990’s prices peaked in 1995 and subsequently declined for years. The ultimate bottom occurred once prices dropped over 26%. Prices did not achieve a higher price until 2004, a 9 year market cycle. That cycle was fuelled partially due to the mortgage in arrears produced by a weakened market.
The mortgage in arrears data is accumulated across BC, however in the current market place most of the outlying or tertiary markets are outperforming Greater Vancouver as the exodus from city centers continues. That would imply many of these newly upcoming additions to the delinquent mortgages will be from right here in the highly volatile Greater Vancouver market.
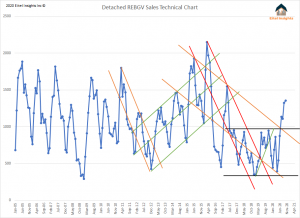
The cold hard facts of the current market decline appear to be at odds with many bullish headlines. That is because the Real Estate Boards continue to paint a rosy picture in order to find a positive sounding headline. Recent example: “Highest October for sales in decades”. While true, a perfect example of a half-truth.
October has never been a high-water mark in any year previous… ever. Comparing strictly historical October data in order to come up with a fantastic headline is simply too big of a pill to swallow. The high data point of 2020 is October, compared to previous years high-water sales data, 2020 was no more than average. Hearing the excitement over average data points, we believe the next phase will lead to sincere weakness, as opposed to tepid strength, reported as herculean. In the sales chart below you can see the “historic high month of October 2020” is smack dab in the middle of the 15 year chart. To get a true historic high data point one would have to discount 177 other months of data leaving just the 14 previous October’s.
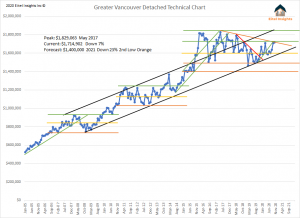
The question is, based on the data, what will occur next? The first six months of 2021 will be crucial, as detached home values based on a 5 year term will be underwater. The initial peak of the detached market occurred during the initial two quarters of 2016. Over that time the average price was $1.790M and 11,400 sales occurred in Greater Vancouver. The overwhelming majority will be up for the 5 year mortgage renewal in the first two quarters of 2021.
The 5 year fixed interest rates have decrease substantially from 2019 when interest rates were around 4%, according to Statscan. Current rates are 2.24%, a significant difference. However compared to the 2016 levels the change is less significant, actually barely noticeable. The first 6 months of 2016 interest rate average was 2.62% making the current interest rates decrease an insignificant factor for those about to go through the renewal process.
A true frenzied market would compare similar to that of 2016 with over 11,400 sales occurring in a six month span with an average sales price of $1.790M. The most recent six months of data, which have been touted as the record breaking, has only achieved 6,300 sales, with an average sales price of $1.645M. So, maybe the market wasn’t as strong as the headlines would have suggested.
All that said markets do ebb and flow. The past few several years of ebb and flow has resulted in the lower highs coupled with lower lows, resulting in a downtrend. Another way to say that would be a period of frenzied strength which created a market top during 2016 -2017 then a market that weakens 2018 – 2019, a period of temporary strength 2020 ultimately resulting in another wave of weakness which results in a market finding the bottom 2021.
2020 technically was supposed to be better than 2019, however the Covid-19 pandemic really emerged as a catalyst for buying up the available detached properties. Prices in January 2020 were just below $1.6M, importantly there was less than 4000 active detached properties. The demand to move from a condo to a detached property was pushed to extremes as most employees began to work from home along with school shutdowns. Parents decided they could not go through another shutdown in a small box, they would rather have a larger building footprint and a yard during the looming second lockdown. There will inevitably come a time when all who wanted and could afford a detached home have purchased. Which will lead to a period of weakened demand.
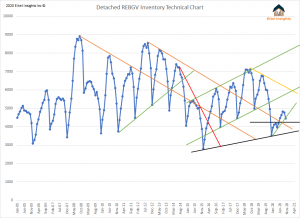
Inventory will be a major story in 2021 one way or the other. If the inventory remains in the doldrums below 5000 active listings, even with less demand there won’t be much of an impetus for sellers to decrease prices. If however, inventory can surpass 5000 or even 6000 active listings prices will fall off with gusto. Given the 11,400 upcoming mortgage renewals it wouldn’t be impossible to see 20% of those come to market in an attempt to stem the losses. That would result in an increase of 2,200 additional inventory. Which would push the data above those key indicating levels.
Can owner occupied demand continue to lift prices to the previous peak of $1.830M in the detached market. The answer is no, since it was not solely owner occupied demand that enabled the market to achieve the all-time highs. There was clearly demand from locals along with many foreign buyers purchasing along with investors continuing to bid each other higher. Now the investors have stopped purchasing, and overseas purchasing has all but stopped. Investing will begin to occur once the proverbial blood hits the streets in the form of distressed sales and foreclosures. As the mortgage in arrears and other analytical indicators suggests that time is coming.
Dane Eitel
Founder & Lead Analyst, Eitel Insights
604 813-1418
Watch Eitel Insight’s latest video here:

In 2020, Warren Buffett has been lying low. Preferring to play his cards close to his chest, he hasn’t revealed much about what he’s been buying and selling. However, once every quarter, he is forced to reveal what he was up to in the quarter before. As it turns out, the “Oracle of Omaha” massively reduced his exposure to Canadian stocks this year.
In the second quarter, Warren Buffett sold out of Restaurant Brands International completely. That move was well publicized, leaving two Canadian stocks in his portfolio. He has trimmed both of those positions throughout the year as well. If this continues, Buffett may be out of Canadian stocks completely by the end of the year. That’s not a great sign for the Canadian economy but — as you’re about to see — there’s a silver lining. CLICK for complete article

The World Economic Forum in Davos, Switzerland is “where billionaires go to lecture millionaires how ordinary people live.”
James Delingpole, British writer, journalist


-
I know Mike is a very solid investor and respect his opinions very much. So if he says pay attention to this or that - I will.
~ Dale G.
-
I've started managing my own investments so view Michael's site as a one-stop shop from which to get information and perspectives.
~ Dave E.
-
Michael offers easy reading, honest, common sense information that anyone can use in a practical manner.
~ der_al.
-
A sane voice in a scrambled investment world.
~ Ed R.
Inside Edge Pro Contributors

Greg Weldon

Josef Schachter

Tyler Bollhorn

Ryan Irvine

Paul Beattie

Martin Straith

Patrick Ceresna

Mark Leibovit

James Thorne

Victor Adair