
Energy & Commodities
Josef is concerned about new Coronavirus Outbreaks and lockdowns in Europe and how they diminish energy demand. As well as how a new OPEC price war is now more than likely. Key support now US$36.63/b.
Each week Josef Schachter will give you his insights into global events, price forecasts and the fundamentals of the energy sector. Josef offers a twice monthly Black Gold newsletter covering the general energy market and 27 energy and energy service companies with regular updates. He holds quarterly subscriber webinars and provides Action BUY and SELL Alerts for paid subscribers. Learn more and subscribe.
EIA Weekly Data:. The EIA data on Thursday October 15th showed commercial stocks falling by 3.8Mb and US production fell by 500Kb/d to 10.5Mb/d or by 3.5Mb on the week as Hurricane Delta shut in offshore US production of both crude oil and natural gas. The estimate had been for a decline of 2.8Mb on the week. Gasoline inventories fell by 1.6Mb and total inventories excluding the SPR fell 16.8Mb on the week. Refinery runs fell 2 points to 75.1% from 77.1% in the prior week. US Production is now down 2.1Mb/d from 12.6Mb/d last year. Commercial stocks are 54.3Mb above last year or up by 12.5%. Cushing oil inventories rose by 2.9Mb to 59.4Mb compared to 43.0Mb last year at this time.
Total product demand rose last week by 1.13Mb/d to 19.48Mb/d but remains 1.46Mb/d or 7% lower than last year’s 20.9Mb/d. Gasoline demand fell last week due to the bad weather in the South falling 320Kb/d to 8.58b/d. It is down 778Kb/d or 8.0% from last year’s level of 9.35Mb/d of consumption. Jet fuel remains the weakest area. Consumption last week was 1.17Mb/d, but remains 441Kb/d or 278% below last year’s level of 1.61Mb/d. Overall product inventories remain high at 1.92Bb or 117.7Mb (6.1%) above the previous year’s level. Excluding the SPR, the commercial stocks are 120.2Mb or 9.4% above the prior year’s 1.28Bb. This high stock level of total product storage should put pressure on WTI crude prices.
Baker Hughes Rig Data: Last week Friday the Baker Hughes rig survey showed an increase in the US land rig count. The US rig count rose by three rigs (up five rigs last week) to 269 rigs working, but remains down 69% from 856 rigs working a year ago. The Permian basin saw an increase of one rig (up four rigs last week) to 130 rigs working but this is still down by 69% from a year earlier level of 421 rigs. The US oil rig count rose by four rigs to 193 rigs but is down 73% from 712 rigs working last year.
Canada saw a rise of five rigs (up four rigs last week) to 80 rigs working. The rig increase in recent weeks now has activity down only 45% from a year ago when 146 rigs were working. In the breakdown the most encouraging data point was rigs working for natural gas which was at 41 rigs (up three on the week) versus 44 rigs working last year. Natural gas stocks have held up better than oily names during the correction over the last few months as it is expected that we will see strong AECO prices this winter as storage in Canada is below normal.
OPEC Monthly Report: The OPEC report with September data came out on Tuesday and they have lowered expected demand in Q3 and Q4 of this year due to the expanded lockdowns or partial closures across Europe and the US. To them oil demand now appears to be fragile. For 2020 they see demand at 90.3Mb/d and for 2021 at 96.8Mb/d. Only in 2022 do they see demand returning to pre-pandemic levels. In September OPEC produced 24.1Mb/d with a net decline in
the month of 47Kb/d. The UAE had the largest decline at 239Kb/d while Libya saw a rise of 53Kb/d and Saudi Arabia of 35Kb/d. Surprisingly Venezuela was able to sneak more oil sales around the tough sanctions it is facing and their volumes rose 32Kb/d to 383Kb/d. Overall OECD inventories at 3.211Bb and are nearly 300Mb above normal. Days of forward consumption are at 110 days versus 94 days in Q3/19. With OPEC producing 24.1Mb/d in September and the call on them at 22.4Mb/d it is clear that OPEC needs to cut production not increase production by 1.9Mb/d as they are currently planning for January 2021.
Conclusion: As we write this, WTI for November is at US$40.50/b. The price is up on the week by nearly US$1/b as the tug of war of the following have occured. As production in the gulf returns in the coming weeks and Norway’s workers strike ends, we expect crude prices will continue to decline.
Positives for crude prices:
- US Gulf Coast production was shut in due to Hurricane Delta. Crude production of 1.67Mb/d or 92% of gulf production. In addition, 62% of the region’s natural gas production was shut in or 1.675Bcf/d. The gulf produces 15% of US crude production and 5% of natural gas production.
- Norway’s strike by energy workers shut in six offshore fields with production of nearly 966Kb/d. Both sides have now agreed to arbitration so this production should be brought back on.
- Colder weather has arrived and demand normally picks up.
Negatives for crude prices:
- Germany, Italy and Austria are reporting record increases in case loads. Tracing is becoming tougher to do in those countries.
- Amsterdam has gone to a four week partial lockdown (restaurants and bars) as it has the highest per capita infection rate in the world.
- Tougher socializing measures (curfews) are being applied to hot spots in London and Paris.
- In 38 US states and Washington DC the number of new cases have increased. In some they are at record levels and some states have hospitals that are at max on their ICU beds.
- Russia plans on increasing its production shortly as it appears to be breaking with OPEC+.
- Libya is reopening its exports and produced 156Kb/d in September. Earlier this week it rose to 355Kb/d as more ports were opened. When the large Sharara field comes on shortly they will raise production by 300Kb/d to 655Kb/d. Of note, before the civil war Libya was producing over 1.1Mb/d.
Downside pressure is expected in the coming weeks as the pandemic caseload rises and production increases around the world. The next breach level to watch is US$36.63/b and we see this occurring later this month. We have been range bound between US$41.47/b at the high end and US$36.63/b at the low end as the weather and shut-ins dominate the price of crude. Once production returns and if the pandemic expands as Wave Two takes hold, we should depressed crude prices and a breach of the US$36.63/b key level.
Most energy and energy service stocks have significant downside risk. The most vulnerable companies are energy and energy service companies with high debt loads, high operating costs, declining production, current balance sheet debt maturities of some materiality within the next 12 months and those that produce heavier crude barrels. Results for Q3/20 should start next week and continue through November. Most results will not be investor friendly.
Hold cash and remain patient for the next low risk BUY window expected during tax loss selling season during Q4/20.
The S&P/TSX Energy Index has fallen from the June high at 96.07 to the current level today of 67.75. Overall the index is now down by 30% in under four months. We see much more downside over the coming months as unfavourable Q3/20 results impact the stocks even more. We will be watching to see how companies discuss their debt loads and lender support. Companies with pessimistic views about their reserve base lending, cutbacks in lines of credit and potential additional impairment write-downs will face significant stock price pressure. The next support for the S&P/TSX Energy Index is at 60.38 (the low two weeks ago). Further lows are likely in Q4/20 as tax loss selling is likely to be very nasty this year. We see the likelihood that the final low for the index could be in the 32-36 area during tax loss selling season. We expect to see a very attractive BUY signal generated during Q4/20 and will recommend new ideas as well as highlight our favourite Table Pounding BUYS which should trade at much lower levels than now.
Subscribe to the Schachter Energy Report and receive access to our two monthly reports, all archived Webinars (our next webinar will be held at 7PM on Thursday November 26th), Action Alerts, TOP PICK recommendations when the next BUY signal occurs, as well as our Quality Scoring System review of the 27 companies that we cover. We go over the markets in much more detail and highlight individual companies in our reports. If you are interested in the energy industry this should be of interest to you.
Please become subscribers before the November 26th webinar as we will be discussing the best ideas to invest in during the tax loss selling season. In addition during the 90 minute webinar we will discuss the third quarter results of many of the companies we cover versus our expectations.
To get access to our research go to http://bit.ly/2OvRCbP to subscribe.

America’s big banks make more than $11 billion worth of overdraft and related fees every year, and 2020 could break even more records due to the uncertainty caused by the pandemic. They’re counting on customers being disorganized, strapped for cash–or both.
But now, those practices are coming under intensified scrutiny.
The Center for Responsible Lending (CRL) recently released a report concluding that the biggest banks, “engage in a number of abusive practices that combine to drain massive sums from their customers’ checking accounts”.
The bulk of those fees, according to CRL, are “shouldered by banks’ most vulnerable customers, often driving them out of the banking system altogether”.
Last year, the report found that JPMorgan Chase pocketed $2.1 billion in income from overdraft and insufficient funds fees, followed by Wells Fargo and Bank of America (BAC) with $1.7 billion and $1.6 billion, respectively. According to CRL, TD Bank’s overdraft fees represent about one-third of its non-interest income.
The banks typically charge overdraft fees when the customer overdraws on their checking account. Rather than allowing a debit card to be declined or a check to bounce, the bank will cover the difference and charge an overdraft fee, usually about $30 to $35. CLICK for complete article

Highs sale numbers and increased prices come as a relief to many homeowners looking to exit the Greater Vancouver market during September 2020. Entry level markets have seen near term highs in prices while the higher end market has begun sell albeit at much lower than expected prices. The beginning of the school year had a major imprint to the 2020 Real Estate Vancouver market. As the colossal impact of the Covid-19th dust continues to settle, we anticipate less ferocious purchasing going forward, as the pent up demand has seemingly been relinquished with the return of the school year.
Diving into the data, the completed sales did occur in higher volume, many of which were for multi million dollars. The high end of the market was very active this month with seemingly money flowing from weak hands to strong ones. A property was listed for 13.388 Million in 2019, cancelled early in 2020 and then relisted during May at 12.998 Million the sale just was achieved at 9.85Million a cool loss of 3.538 Million dollars. Another seller who achieved a sale had been waiting for more than one year. A property that had been on the market for 533 days just sold for 4.7Million, a nice sale price however, the original ask was 6.88 Million in 2018 then 5.68Million during 2019. The eventual sale price was 2.18 Million less than the asking price during 2018. Even while these sellers were bent over the proverbial barrel the high end sales enabled the average sales price to increase to just over 1.7 Million.
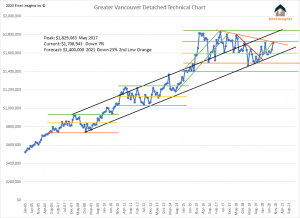
Technically speaking, current prices are testing both the long term downtrend and the low end of the upper echelon in the current market cycle. A triple top indicates a market reversal. That triple top occurred over the course of 2016 -2017. That triple top began the overall downtrend orange line that has forced prices lower and ultimately to test the long term uptrend indicated by the black uptrend lines on the chart. Due to the triple top prices did break below the upper channel of the long term up trend during 2019 which sent prices to the upper end of the low echelon. Eitel Insights believes the triple top and subsequent downtrend will again test the prolonged uptrend and eventually break the trend, which will force prices to retest the low end of the market cycle.
The Real Estate Board has been reminding everyone how well sales during September 2020 are doing compared with September 2019, they conveniently leave out that compared to the overall peak (peak price 1.830 Million), prices are still down 7% along with lower sale numbers. Eitel Insights had indicated over the past year or more, any property can sell, however at continually lower levels until the market bottoms likely in 2021 for most areas across Greater Vancouver. The many examples of current homeowners having to chase the market lower will ultimately push prices to retest the prolonged uptrend.
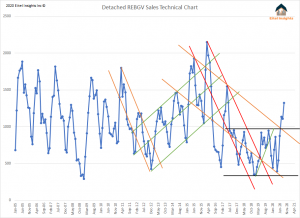
Going forward we believe the demand will dissipate, as that rush to buy land before the school year was a major factor in the recent bump to sales data. The Covid-19 reaction had families moving from condos to a detached property which caused a spike in completed sales. The sales total which is taken from the amount of completions at land titles accumulated to 1325 which is the highest over the previous 3 years. 2020 has changed the way many people work and how youngsters are learning. If a hard second shut down was to occur parents would become teachers again. The desire for the kids to have a back yard to play in has massively increased. With parents knowing this year mattered more than past or even upcoming years we believe that is what drove the completions during September to be the high water market of the current sales cycle. As time wears on Eitel Insights does not believe this type of intense demand will keep up.
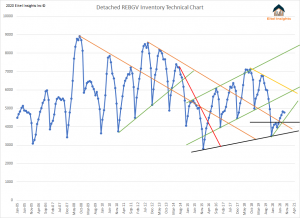
The Detached inventory has remained low during 2020 and is still lower than December 2018 data with only 4773 active properties. Contrast that with the Condo market hitting the highest new monthly listings in the past 15 years and the contrast of the two market becomes obvious. The rapid demand for a back yard from young families surely gobbled up many of the newly listed properties.
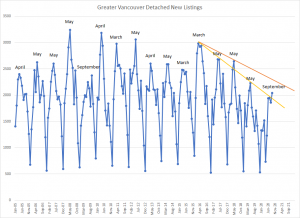
The overall inventory did not increase for the first time in the past several months, however the new monthly listings hit the highest since in over a year with 2042 newly activated detached listings. As suggested in months past the seasonal norms will likely not hold true for the remainder of 2020.
The previous yearly high water market for new active listings has always occurred before May each and every year except for 2009 and now again, here in 2020. The major difference between now and then…. No 2010 Vancouver Olympics around to corner to ensure construction and the actual economy doesn’t stop, rather than a couple governments offering meager handouts in order to be re-elected.
The effects of the Covid-19 impact is still percolating in the real economy. While yes, offering free money to everyone, whether previously employed or not, is a boon to the economy at the beginning. Longer term, this will mean more taxes. An unwelcome thought for business owners who are already struggling to keep their doors open. Secondary properties are hitting the market in droves already, as the condo inventory hits the highest point in the past 5 years.
In summary, September was a nice bump higher and ideally sellers took advantage, but ultimately, this great data point, in hindsight, will be seen as nothing more than a lower high on the way to the bottom.
Dane Eitel, Eitel Insights
Founder & Lead Analyst
604 813-1418
Watch Eitel’s latest video here:
Economists have come up with every variation of applying a letter of the alphabet to the economic recovery. Whether it’s an “L,” a “W” or a “V,” there is a letter that suits your view. But what is a “K”-shaped recovery?
Take a closer look at the letter “K.” It’s a “V” on the top, and an inverted “V” on the bottom.
According to Investopedia:
“A K-shaped recovery occurs when, following a recession, different parts of the economy recover at different rates, times, or magnitudes. This is in contrast to an even, uniform recovery across sectors, industries, or groups of people. A K-shaped recovery leads to changes in the structure of the economy or the broader society as economic outcomes and relations are fundamentally changed before and after the recession.
Creative Destruction
Following the economic shutdown, much of the data shows strong signs of improvement. However, several different economic phenomena are driving a K-shaped recovery.
One of the more interesting aspects of the recovery has been that of “creative destruction:”
“Creative destruction is a concept in economics which since the 1950s has become most readily identified with economist Joseph Schumpeter. Schumpeter derived it from the work of Karl Marx and popularized it as a theory of economic innovation and the business cycle.
According to Schumpeter, the ‘gale of creative destruction’ describes the ‘process of industrial mutation. The process continuously revolutionizes the economic structure from within, incessantly destroying the old one, incessantly creating a new one’” – Wikipedia
Industries like technology, retail, and software services are leading the way in “creative destruction.” Technology companies like Apple Inc., Alphabet Inc., and Microsoft Corp. saw earnings expand during the economic recession. General merchandise retailers such as Target, Walmart, and Costco, along with online video entertainment giants Netflix Inc., Walt Disney Co., and YouTube, made sizeable gains as the economy closed. Biotech, Pharmaceuticals, and, of course, “Work From Home” firms like Slack and Zoom blossomed with online retailers like Amazon and Shopify.
However, while the “fire of necessity” gave birth to a host of new companies, simultaneously others got lost. Travel, airlines, cruises, movie theaters, traditional retailers, and real estate remain under significant financial pressures. CLICK for complete article
A painfully slow economic recovery and elevated unemployment, combined with an abrupt end to government aid and no new stimulus in sight has Americans cutwith the end of government’s aid, has caused Americans to significantly cut back on their borrowing.
According to the newest Federal Reserve figures, consumer borrowing unexpectedly fell in August as credit card balances declined for a sixth consecutive month.
Total credit card debt decreased by $7.2 billion in the month of August after an upwardly revised $14.7 billion gain in July. It also represents the first decline since a $12-billion plunge in May.
Compared with July, revolving debt fell by $9.4 billion in the category that covers credit cards, the sixth decline in that area starting with a $25.4-billion drop in March.
But auto and student loans have defied that gravity, with the combined category rising by $2.2 billion in August, its fourth gain after its first decline in April.
The $2.2 trillion distributed by the government under the CARES Act passed in March is already spent. A $600-a-week federal benefit expired more than two months ago and the sequel of government aid any time soon is now unlikely.
According to new research by a team of economists from four American and European universities, the majority of the money from the first stimulus was spent on rent and bill payments, with extra for food and personal care.
Earlier this week, President Donald Trump called off negotiations on another coronavirus relief package and rescheduled them for after the November election. CLICK for complete article

-
I know Mike is a very solid investor and respect his opinions very much. So if he says pay attention to this or that - I will.
~ Dale G.
-
I've started managing my own investments so view Michael's site as a one-stop shop from which to get information and perspectives.
~ Dave E.
-
Michael offers easy reading, honest, common sense information that anyone can use in a practical manner.
~ der_al.
-
A sane voice in a scrambled investment world.
~ Ed R.
Inside Edge Pro Contributors

Greg Weldon

Josef Schachter

Tyler Bollhorn

Ryan Irvine

Paul Beattie

Martin Straith

Patrick Ceresna

Mark Leibovit

James Thorne

Victor Adair