
Personal Finance
Too Tired to Think
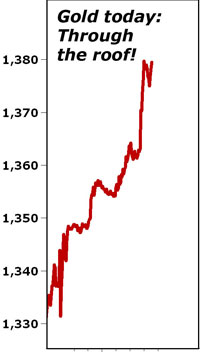
“Gold Buying Up – consider this from Bloomberg:”
On Sunday night, we returned from a two-day horseback trip up into the Argentine mountains.
After 18 hours of riding over the worst terrain you can imagine – and sleeping on the hard stone floor of an unheated refuge at 9,500 feet – we showed up at the house bruised… worn-out… windburned… and sun beaten.
It was a great trip, in other words.
But your editor is too tired to think… or write.
In the sixth grade, at Owensville Elementary, our career path was decided for us. The entire class was told to write an essay. Pencils descended onto paper immediately. Except for our pencil, that is. We sat looking up the ceiling.
Mrs. Marshall came to our desk.
“What are you doing?” she asked.
“Thinking,” we replied.
“Well, don’t think. Write.”
Which is about what we’ve been doing ever since.
But right now, we can barely sit. Writing will have to wait for tomorrow.
Please bear with us.
Gold Buying Up
In the meantime, consider this from Bloomberg:
Central banks bought the most gold since 1964 last year just before the collapse in prices into a bear market underscored investors’ weakening faith in the world’s traditional store of value.
Nations from Colombia to Greece, to South Africa, bought gold as prices rose for an 11th year in 2011, highlighting the reversal of a three-decade-long bout of selling that diminished the world’s biggest bullion hoard by 19%. The World Gold Council says it added 534.6 metric tons to reserves in 2012, the most in almost a half-century, and expects purchases of 450-550 tons this year, valued now at as much as $25.3 billion.
Whoa!
Central banks are printing newfangled money at a record rate. They are also buying gold, the old-fashioned money, at a record rate.
Question: What are they using to buy the old-fashioned money?
Answer: Directly or indirectly, they are using the printing-press money they create.
Small Potatoes
Here’s Matt Taibbi in Rolling Stone:
Banks have been manipulating global interest rates, in the process messing around with the prices of upward of $500 trillion (that’s trillion, with a “T”) worth of financial instruments. When that sprawling con burst into public view last year, it was easily the biggest financial scandal in history – MIT professor Andrew Lo even said it “dwarfs by orders of magnitude any financial scam in the history of markets.”
That was bad enough, but now Libor may have a twin brother. Word has leaked out that the London-based firm ICAP, the world’s largest broker of interest-rate swaps, is being investigated by American authorities for behavior that sounds eerily reminiscent of the Libor mess. Regulators are looking into whether or not a small group of brokers at ICAP may have worked with up to 15 of the world’s largest banks to manipulate ISDAfix, a benchmark number used around the world to calculate the prices of interest-rate swaps.
Interest-rate swaps are a tool used by big cities, major corporations and sovereign governments to manage their debt, and the scale of their use is almost unimaginably massive. It’s about a $379 trillion market, meaning that any manipulation would affect a pile of assets about 100 times the size of the United States federal budget.
Mr. Taibbi is concerned with the way the swaps market is rigged. But that’s small potatoes, compared with the way the entire world financial system is tricked up.
More on this tomorrow, when we are able to sit down for longer than 10 minutes.
Regards,
![]()
Biill
Buy and Hold Is Dead
Let’s face it. The old ways of investing are obsolete. Thanks to an upcoming tax hike, courtesy of Obama and Congress, even blue-chip dividend stocks aren’t safe.
If you’re stuck in the old ways, you need to consider moving your portfolio out of stocks. I’ve found an investment that’s much safer — and more potentially lucrative.
In this video, I’ll show you an investment that’s gone up every year since 1950 — without touching the stock market.

 Goldman Sachs Group Inc. cut its “near-term” outlook for commodities and reduced forecasts for oil and coffee amid prospects for weak demand from China to Europe. The bank also exited a bet on lower gold prices.
Goldman Sachs lowered its three- and 12-month return forecasts for the Standard & Poor’s GSCI gauge of 24 commodities to 2.5%, from 6% in three months and 3% in 12 months, and cut its near-term outlook on commodities to neutral from overweight, according to the report, dated today. It exited its bet on lower gold prices, with a potential gain of 10%, while saying bullion may fall even more.
…..read more HERE
For a couple of years now I’ve maintained my view that the Dow Industrials and broad U.S. equity markets were entering a new bull market. One of the tools I used to come to that conclusion back in 2008 was the ratio of the Dow Industrials to the price of gold.
I wrote extensively about it in my July 2008 issue of Real Wealth Report. I also reported on it several times in other pieces I wrote. Today, I want to update the analysis for you.
First some background. At the peak of the ratio in the year 2000, the Dow Industrials would have purchased just over 51 ounces of gold. That’s because the Dow was at a high in real, inflation-adjusted terms, while gold was at its bottom at the $255 to $275 level.
During the financial crisis of 2007 – 2009, as equities plunged and gold rallied (since its bottom in 2000) the ratio collapsed all the way down to the 6 to 7 level.
In other words, in terms of gold — what I like to call “honest money” — the Dow Industrials had lost more than 87 percent of the entire equity bull market from 1980 to 1999.

In my Real Wealth Report issue of July 2008, I called for the bottom in the ratio to come in around the 5 to 6 level.
It bottomed slightly above that level, then retested it with a slightly lower low in September 2011.
Since then, stocks have vastly outperformed gold.
As a result, the ratio of the Dow Industrials to gold has widened back out, and has broken out of a resistance level as you can see on the chart.
Now trading at about the 10-to-1 level, the Dow/Gold ratio is set to widen much further.
So what does this all mean? And what does it hold for the future for the Dow? For gold?
I’ll answer those questions now. But I urge you to put your thinking cap on, because the analysis of the Dow/Gold ratio is not easy to grasp, yet it’s critically important to understanding the future.
FIRST, the collapse in the Dow to Gold ratio was not caused simply by a crash in equity prices. It was also due to a crash in the value of the dollar, as reflected in the soaring value of gold from the year 2000 on.
SECOND, the breakout in the ratio means that the Dow is now beginning to inflation-adjust, to reflect the lower value of the dollar (as reflected in the higher price of gold).
This inflation-adjusting of equities is perfectly normal and one of the main reasons I am very bullish equities over the next several years.
All asset classes eventually recalibrate their price levels to the new reality of the purchasing power of the underlying currency, which in this case, is the dollar, which in turn, is nowhere near what it was worth back in the year 2000.
A simple exercise here will show you how the Dow will adjust. For the Dow/Gold ratio to climb back to the 18 to 20 resistance level you see on my chart, the Dow would have to explode higher to the 28,000 level, assuming gold’s current price of roughly $1,400.
 Naturally, the price of gold is not going to remain at $1,400. It will probably fall back to the $1,030 level, which is my target for gold’s bottom. Let’s say it does that. Then a 20-to-1 ratio for Dow/Gold, with gold at $1,030, would still imply a Dow eventually hitting the 20,600 level.
And what would happen if gold were to move to $2,000 … $3,000 … or higher? Then to reach a 20-to-1 ratio, the Dow would have to explode even higher.
At $2,000 gold, a 20:1 ratio would see the Dow eventually hit 40,000.
Take the other extreme: Gold falls to say, $600. A 20:1 ratio puts the Dow at 12,000.
Do this exercise for any price level of gold you wish, and you will see that the downside risk in the Dow is minimal and the upside potential is enormous.
That’s not to say there won’t be pullbacks in the Dow. There will be. This kind of analysis simply shows you that …
THIRD, the monetary system has changed dramatically. More specifically, the dollar has lost another huge chunk of purchasing power ? value that it will most likely never get back, even if the dollar stages a rally in the Forex markets, as it has been doing and will do some more.
Naturally, the ratio between the Dow and gold will vary considerably over the next few years.
But given the breakout from the bottom of the ratio … and the normal tendency from all markets, no matter what they are, to retrace good portions of what they have lost …
I believe it’s a very safe assumption to make that the Dow/Gold ratio will continue to climb. And that means much higher prices to come for the Dow, and U.S. equity markets in general.
You can do this sort of exercise with any asset class you want. You can look at real estate values in terms of honest money, gold … even with collectibles such as art.
And each time you do that comparison, with the price of gold, you will find that the value of the dollar has changed dramatically over the last 12 years, so much so that almost all asset prices will eventually be forced to inflate much higher.
As for gold and silver right now, the bounce you’ve seen is nothing more than a dead cat bounce. The precious metals, and commodities in general, have NOT bottomed.
So please don’t buy yet, and don’t fall prey to the pitches from all the snake-oil salesmen out there who are trying so desperately to sell you metal and mining shares now so they can earn an extra commission.
I repeat my warnings:
Gold will not bottom until it hits major long-term support at $1,030.
Silver will not bottom until it tests major long-term support at the $17 level.
If you’ve acted on any of my suggestions to purchase inverse ETFs such as the ProShares UltraShort Gold (GLL) and the Direxion Daily Gold Miners Bear 3x Shares (DUST) … or even the ProShares UltraShort Silver (ZSL) for a play on silver’s downside …
Continue to hold those positions!
Best wishes,
Larry
POSTED BY LARRY EDELSON
 This investment news is brought to you by Money and Markets. Money and Markets is a free daily investment newsletter from Martin D. Weiss and Weiss Research analysts offering the latest investing news and financial insights for the stock market, including tips and advice on investing in gold, energy and oil. Dr. Weiss is a leader in the fields of investing, interest rates, financial safety and economic forecasting. To view archives or subscribe, visit http://www.moneyandmarkets.com/.


U.S. GDP underwhelmed market
Mixed economic numbers this friday morning.
A disappointing advance GDP report contributed to the early caution as GDP grew at an annualized rate of 2.5% during the first quarter of 2013. That is up the fourth quarter’s gain of 0.4%, but below the Briefing.com consensus expectation of a 2.8% gain. The University of Michigan’s final April Consumer Sentiment Survey rose to 76.4 from the 72.3 that was posted in the preliminary Survey. The Briefing.com consensus expected the reading would tick up to 72.4.
It ‘feels’ like the markets are forming a ‘double-top’ as we approach in the widely ‘pooh-poohed’ ‘Sell May and Go Away’ axiom.
Asian stocks today closed mostly lower: Japan -0.30%, Hong Kong +0.65%, China CSI 300 index -0.83%, Taiwan unch, Australia -0.10%, Singapore +0.33%, South Korea -0.57%, India -0.62%, Turkey -0.42%. .
The Dow Jones Industrials were are down 2.92 at 14697.65. On April 19 we traded down to 14444.03 which was a new low as compared to the 14887.51 record high from April 11. The October, 2007 peak of 14198.10 is a theoretical pullback number, but unless we take out 14444.03, forget about the correction to 14198.
The Dow Transports were down 11.13 at 6099.53. They have held recent lows: 5902.82 from April 15 and 5878.12 from April 5. The Transports formed a double-top, i.e., 6215.90 from April 10 versus 6291.65 from March 19. Confirmation of the resumption of the decline would be confirmed under the April 5 low of 5878.22, look for the 5500-5600 area as next support. Bigger picture, possible bullish reverse ‘head and shoulders’ patterns have formed: 1) From July, 2011 to present and 2) May, 2008 to present. The upside measurements are astronomical anywhere from 2600 points from the former to 3400 points to the latter ABOVE CURRENT HIGHS! If this is true and if the Transports are indeed the market leader I believe it is, we have a long way to go in this bull market! But, we would have to take the ‘double-top’ first to give this bullish scenario any more credence.
The S&P 500 was down 6.44 at 1578.73. On April 18, we touched 1536.03 intraday as compared to the new all-time high that was 1597.35 posted back on April 11. It looks like were headed to 1625.00 in the SPX. That said, the next theoretical downside target is 1497 if we take out 1536.03.
The Nasdaq Composite was down 19.03 at 3271.10. The recent low was April 18 at 3154.96 as compared to the 3306.95 bull market high from April 11. We are long PSQ, the inverse ETF for the QQQ and the Nasdaq 100. Under 3154.96, a correction is likely confirmed.
The broad-based NYSI (New York Stock Exchange Index) was down 36.73 at 9152.13. We touched 8890.34 on April 18 as compared to the recent high of 9256.13 which was posted on April 11. Under 8890.15, a correction is likely confirmed.
The CBOE Volatility Index (VIX), which measures the cost of using options as insurance against declines in the S&P 500 (i.e., the higher the number, the more fear in the marketplace) is up .46 at 14.08. On April 18 it surged to 18.20 intraday. On Friday, March 15, it traded as low as 11.21, the lowest level since February 2007, so I guess these are our parameters going forward. The higher we go in the VIX, the more likely a bear cycle is upon us. It looks like we may be headed into the 20s.
Elsewhere in the news:
>The Senate late yesterday before leaving for a week-long recess approved a bill that would halt air-traffic controller furloughs by allowing the FAA to move about $250 million among accounts within its budget. The House is in session today and could approve the bill and pass it along to the President for his signature. That would end four days of flight delays that are causing disruptions for airlines as well as businesses.
>The Bank of Japan at its 2-day policy meeting left its aggressive new QE plan unchanged. The median estimate of BOJ board members is that Japan’s core inflation rate, excluding fresh food and sales tax increases, will rise to +1.9% y/y in the 2015-16 fiscal year (starting in April 2015) from the current -0.5% y/y level. The general market opinion is that the BOJ will have significant difficulty hitting that target given the deflationary forces in the Japanese economy. The BOJ may ease further later this year if inflation has not started rising quickly enough.
Japan’s March national CPI eased to -0.9% y/y from -0.7% in Feb and was weaker than market expectations of -0.8%. March CPI ex-fresh food fell by -0.5% y/y from -0.3% y/y in Feb and was weaker than market expectations of -0.4% y/y. Tokyo’s April CPI improved to -0.7% y/y from -1.0% in March. The April Tokyo CPI ex-fresh food improved to -0.3% y/y from -0.5% in March. >The German March import price index fell to -2.3% y/y from -1.6% in Feb and was in line with market expectations.
>Eurozone March M3 eased to +2.6% y/y from +3.1% in Feb and was weaker than market expectations of +3.0%.
—————————————- Eight of the nine market sectors are lower today.
XLB -1,67% Materials XLE -0.72% Energy XLF -0.75% Financial XLI -0.39% Industrial XLK -0.33% Technology XLP -0.05% Consumer Staples XLU +0.27% Utilities XLV -0.26% Health Care XLY -0.68% Consumer Discretionary ——————————————— NYSE Advance/Decline 1272/2581. NASDAQ Advance/Decline 754/1570 NYSE UP volume to DOWN volume was 1 to 2. NASDAQ UP volume to DOWN volume was 3 to 5. ——————————————– From the VRtrader.com website here is a link to World Market Indices:
http://www.vrtrader.com/vr_free/worldmarkets/index.asp ——————————————- Gold and silver (spot) – action alert – bull-more bullish as the price declines!
Spot gold is down 15.50 at 1452.70, but was higher earlier trading t 1484.10, almost exactly up a $150 from the 1334.90 low from April 15. In overnight trading we touched 1487.50. Next potential upside is 1520 on a further technical rebound, but I’m not holding my breath. Have we seen the lows? I believe we’re in a complicated base-building process which may include new lows. Since we satisfied long standing downside potential into the 1300-1400 range, it is possible the worst is also behind us. All we can do is take it a day at a time.
Following this week’s surge in gold prices, the majority of analysts in the weekly Kitco News Gold Survey expect prices to continue to rise. In the Kitco News Gold Survey, out of 35 participants, 24 responded this week. Of those 24 participants, 14 see prices up, while eight see prices down, and two see prices moving sideways or are neutral. Market participants include bullion dealers, investment banks, futures traders, money managers and technical-chart analysts. Many of the participants were encouraged by the unprecedented demand in the physical gold market and the influence that’s had on lifting benchmark futures prices. Because of the $100-plus an ounce rebound from last week’s lows, they see values marching higher. There others who are bullish, but said the speed of the rallies should be watched carefully. “I remain short-term positive, but get nervous at the $1,520-$1,530 level, if we get there quickly,” said Mark Leibovit, editor of the VR Gold Letter. The few participants who were neutral or expected range-bound prices said the market might just be in a holding period for the time being.
Long-term investors can begin accumulating more physical gold here with the understanding downside risk could be toward or under 1100 if we equal the 1975 45% correction seen at that time. Another theoretical downside target would be 1000 points off the top or 922. Keep these in mind as you accumulate gold. we could have also seen the lows. we will only know in the fullness of time! This entire washout was, in my view, ‘intentional’ price destruction to discourage buyers as the risk of a default at the COMEX and elsewhere drew close. Too many investors demanding physical delivery and with the inability to deliver, the ‘powers that be’ had to drive ‘paper’ prices lower to discourage those wishing to take delivery – in the hope they could also replenish their dwindling stockpile of needed physical. Resistance above 1520.00 is 1618.50, 1663.20, 1698.80 and 1796.70 from October 4, 2011 to make a call for a breakout above the September, 2011 peak at 1922. —————- Silver is off .60 at 23.80 touching 24.64 earlier in the session. Next bounce potential is resistance at the old 26.00 old. We touched 22.52 on Tuesday, the lowest low of the current downleg. If that low comes out, next support is 21.00 then 19.00 with downside potential even to 14.00. To re-establish the uptrend we need to clear 28.20, 29.48, 32.58 and then 35.32, but a technical bounce back to resistance at 26.00 can occur anytime. —————-
Bonds – action alert – neutral
Thirty-year Treasury bonds (June) are higher up 29/32 to 148 27/32. They traded at 149 6/32 (a new rally peak) on April 23. If TLT fills an upside gap at 119.67, we may consider going long again. That said, longer term my work points lower toward the 133 to 138 range in the Treasury Bonds themselves which would roughly equate to TLT in the 104 to 109 range
——————————————– COMMODITIES AND RESOURCES ——————————————— Platinum – summary
Platinum is up 9.00 at 1472.00, now trading at a slight premium over gold. Yesterday, gold and platinum were trading at the same price. Next resistance is 1495.00. The April 15 low is 1394.00 is the current reaction low as compared to the 1745.00 posted on February 7. The big low of 731 on October 27, 2008 and the record high of 2308.80 that preceded it back on March 4, 2008. There is still plenty of upside potential here, but I currently have no new technical projections in either direction.
——————————————– Palladium – summary
Palladium is unchanged at 680.00, but traded a new recovery peak of 691.00 earlier in the session. The April 15 low was 651.00. Next resistance is 701.00. The recent high is 791.00 from March 8. I have technical projections in Palladium into the 825-875 range down the road, so Palladium is a buy on weakness, but I am hoping to get volume confirmation of a bottom before doing any new buying. After trading at a 10-year high of 862 on February 18, 2011, the big low was posted back on November 28, 2008 at 154. Looking way back, however, Palladium hit an all-time high of 968.00 back in December, 2000. As you know, Palladium’s fortune as is with Platinum is somewhat tied to the economy and the automobile industry. ——————————————–Copper – summary
Copper is off .0495 at 3.1850. On Tuesday, we touched a new reaction at 3.0570. The current short-term trading range is bounded by yesterday’s 3.0570 low and the April 9 peak of 3.4405. Resistance is now here at 3.25, then 3.44, 3.48, 3.5605, 3.5905, 3.7935 and the 3.8520 high from September 14, 2012. Support is 3.06 and 2.85. The record high of 4.6495 was posted on February 15, 2011. With Copper being both volatile a leading indicator for world economies, watching its trend becomes very important. In my work, the next upside target is 4.00 followed by 4.50, 5.05, 5.55 and then possibly 7.00 over the next few years. Recall, Copper had hit a bear market low of 1.2710 back on December 26, 2008. Recall, Copper had hit a bear market low of 1.2710 back on December 26, 2008.
——————————————— U.S. dollar and other currencies – summary
The U.S. dollar is down .257 at 82.487. Corrective risk remains first at 80.87. If we continue to push higher and take out the April 4 high of 83.494, the next upside target would be the July, 2012 high at 84.25 with potential to the June, 2010 high of 88.80. I still, however, have my longer term negative bias. When and if we break under 70.008, the correction resumes, possibly quite significantly. My downside target range is a low target of .30 and a high target of .66. Its recent low was posted on September 14th at 78.601. ——————————————– Uranium – summary
Spot Uranium traded down to 40.25 off .50 in the April 22 posting at www.uxc.com. This is the cash market. Uranium has swung from the June 13, 2007 high of 154.95 down to current levels. There is no sign of a meaningful bottom in uranium or the shares at this time ——————————————- Crude oil – summary
Crude Oil is down .84 at 92.80. The April 18 low was 85.61. So, the current trading range is now bounded by the 98.24 high from January 30 and 85.61 from April 18. As I told you, a technical bounce back to 95.00 appears to be underway and, so far, we touched 94.87 on Thursday. Resistance is first 93.87, 95.00 followed by 97.80, 98.24 and 104.00. Support is at 83.00. ——————————————— Natural gas – summary
Natural gas is down .074 at 4.093.. We exited UNG – the Natural Gas ETF on April 15 and have been watching from the sidelines looking to get back long UNG. The recent high is 4.429 on April 18. Natural gas hit a 10-year low of 1.902 on April 20, 2012. ———————————————Canadian summary: ——————————————— The Canadian dollar (using FXC) was up .58 at 97.55. On April 4 we ‘rang the register’ in our long FXC position. The forecasted technical bounce back to 98.10-98.60 range occurred when we traded at 98.42. Previously, a new reaction of 96.15 was posted on March 6 as compared to the September 14 high at 102.96. I cannot say whether 96.15 will hold or not. Support numbers are 96.15, 95.30, 94.72, 93.20, 92.50 91.82, 91.00, 89.75, 87.50 and 85.18. Resistance is 9810-98.60, 99.88. 101.74, 102.07, 103.08, 105.59, 108.00, 110.00, 113.00. We need a rally above 101.29 to re-establish the uptrend. My next upside target was 110.00. Big picture potential is, believe it or not, 200.00, so I am patient, but we’re now clearly in a correction.
The TSX is down 124.54 at 12204.97. The April 17 correction low is 11916.64, as compared to the 12875.35 peak from back on January 24. We could bounce up to 12415.00 over the short-term.
The TSX Venture is down 4.42 at 960.25. The April 17 correction low was 917.83 as compared to the previous 1017.59 low from back on April 4. We could bounce back to 1017.59.
CANADIAN TSX:
Resistance is 12,555, 12,415, 12,623, 12,904, 13,000, 13,120, 13,517, 13,901, 14,089, 14,329, 14,715, 15,000, 15,600. Support is 11,916, 11,761, 11,630, 11,475, 11,366, 11,256, 10,798-10,848, 10,700, 10,200.
CANADIAN TSX Venture:
Resistance: 1017, 1068, 1090, 1113, 1122, 1153, 1170, 1191, 1245, 1259, 1306, 1322, 1348, 1436, 1473, 1573. Support: 917 and beyond that unknown. ———————————————
 About the Author:
Mark Leibovit’s career in the financial industry spans more than 35 years, beginning as a market maker on the Chicago Board Options Exchange and the Midwest Options Exchange where he made a market in many issues, including Newmont Mining, and continuing on to serve as Director of Technical Research at Rodman and Renshaw, later leaving to publish his own stock market research letter. He is both a Certified Investment Management Analyst (CIMA) and Accredited Investment Fiduciary (AIF), and is also a member of the Market Technicians Association and the CFA Institute. Mr.Leibovit’s extensive media television profile includes seven years as a consultant ‘Elf’ on “Louis Rukeyser’s Wall Street Week” television program, and over thirty years as a Market Monitor guest for PBS “The Nightly Business Report”. He also has appeared on Fox Business News, CNBC, BNN (Canada), and Bloomberg, and has been interviewed in Barrons, Business Week, Forbes and The Wall Street Journal to name a few. Mr.Leibovit’s specialty is Volume Analysis with his proprietary Leibovit Volume Reversal Indicator. He is well known for forecasting accurate signals of trend direction and reversals in the equity, metals and futures markets. He has historical experience recognizing, bull and bear markets and signaling alerts prior to market crashes. His comprehensive study on Volume Analysis, The Trader’s Book of Volume was recently released by McGraw-Hill 2011. Mark has appeared in speaking engagements and seminars in the U.S. and Canada and provides customized Volume Analysis for managers and institutions. He publishes a newsletter on the gold, metals and mining markets which can be found at (www.vrgoldletter.com) . His flagship service, VRtrader.com covers all markets. Mr. Leibovit is currently Timer Digest’s #2 Gold Market timer for 2011, and has also been named the #1 Gold Market timer for the 5 year period ending in 2010, and the #1 Intermediate Stock Market timer for the 10-year period ending in 2007.


-
I know Mike is a very solid investor and respect his opinions very much. So if he says pay attention to this or that - I will.
~ Dale G.
-
I've started managing my own investments so view Michael's site as a one-stop shop from which to get information and perspectives.
~ Dave E.
-
Michael offers easy reading, honest, common sense information that anyone can use in a practical manner.
~ der_al.
-
A sane voice in a scrambled investment world.
~ Ed R.
Inside Edge Pro Contributors

Greg Weldon

Josef Schachter

Tyler Bollhorn

Ryan Irvine

Paul Beattie

Martin Straith

Patrick Ceresna

Mark Leibovit

James Thorne

Victor Adair