
Mike's Content
Ellis Ross (@ellisbross) Tweeted:
My First Nations band went from being one of the poorest to one that could contribute 300k to our local hospital to fight covid. All this from working with, not against, our resource sector. Its amazing not being beggers in our own house anymore.
https://twitter.com/ellisbross/status/1289943553301336064?s=20

Minneapolis’s 3rd Precinct, whose police station was burned down by rioters, reported 100 robberies and 20 carjackings in July… the current attacks on law enforcement, accompanied by demands to dismantle the city’s police department, threaten to make the city uninhabitable.
– powerlineblog.com
Greater Toronto Area Market Update
The Greater Toronto market has experienced a prolonged uptrend which has propelled prices up 127% since 2010. The aggregate average sales price had initially peaked in 2017 at $920K (125% Growth over 7 years), with June 2020 recording a $930K price. These two data points are seemingly creating a double top for the GTA real estate prices.
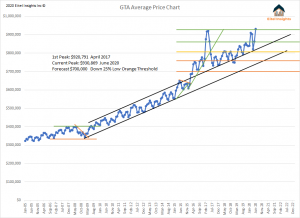
The first break in the armour was the rapid uptrend (green line) established in 2016, which rose prices over $290,000 in a year and a four months. That uptrend broke in 2017. The rapid uptrend was not sustainable growth rate, prices subsequently retreated back to our forecasted higher echelon of the lower threshold $750K during the end of 2017 and into 2018.
Eitel Insights analytics is noticing a double top is forming in the GTA prices. After the creation of the first peak in 2017 with current prices representing the second peak. After peaks comes valleys, the GTA has remained in an impressive uptrend since the market took a temporary pause in 08-09. That uptrend (black line) is about to encounter a serious test which will cause market volatility.
Prices will begin to search for their market cycle lows, just like every other market cycle previous. The chart has identified a few pricing thresholds that will be tested in the upcoming months and likely years. Eitel Insights anticipates the market bottom to occur and create a channel which the market will remain likely until 2025.
With a double top forming in the price chart, we next take a look at the supply demand factors. Inventory has seen the bottom during December 2016 with only 4700 active properties. The most recent bottom came during 2019 with over 7400 active listings. Still well below the 15 year average of 17,800 actives, but a higher low none the less. Equally as important, the data is officially breaking the downtrend that had been in play since 2013 signalling that trend has completely come to its end. Going forward we anticipate inventory to continue in an uptrend meaning with higher lows and higher highs in the reported data.
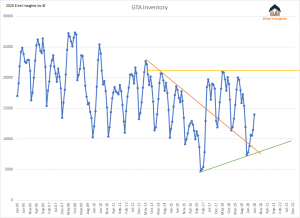
The magical number of 21,000 active listings which hasn’t been broken in the past 7 years, will eventually relent in the upcoming several quarters. Inventory had been getting sold in record time and record money in years previous, this in turn has kept the inventory a nominal levels, while increasing the asking price.
The sales chart demonstrates there has been less demand at current prices, a trend which has been developing seemingly unnoticed by most. Sales are not low in 2020 solely due to Covid-19. No, they have been trending lower since 2016. In fact sales have not remained above 10,000 since 2016. June 2016 had over 10,000 sales and the month ended with 12,000 inventory. Since then inventory levels have surpassed 19,000 each summer with ease, however the sales have not risen above 10,000 since, with one data point being the exception during 2017. That signals to Eitel Insights, increasing demand to sell with decreasing demand to buy.
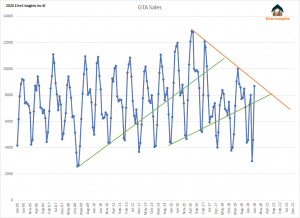
Demand has waned. Up next anticipate an increase to the supply without nearly the amount of a buyer as years previous. This upcoming reality inevitably creates competition amongst sellers, which in turn, leads to lower asking prices. As with any cycle, the overheated frenzied activity eventually ends, and gives way to a whole new kind of chaos on the other end of the spectrum.
The condo market in particular will see a chaotic atmosphere, as newly completed properties begin to enter the GTA market in 2021 and predominantly in 2022. The flood of inventory that is on the horizon is eerie enough, throw in the investor market that hasn’t received rent since Covid-19 hit and cannot evict the tenant going through the proper channels until who knows when. Once the investors do get their properties back, selling will be on the mind. Unfortunately this example will occur by the hundreds, and the market will flood with new and older inventory.
The historical chart is calling for a similar market cycle to the one that occurred from 1989-2002. After a 4 year uptrend prices shot up 167% to reach the all-time high of $261K in April 1989. After peaking the search began for the market cycle bottom, which occurred multiple times throughout the 11 year price channel.
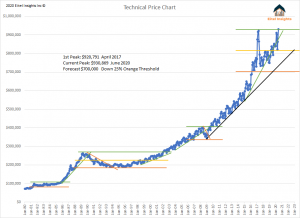
Eitel Insights is not calling for an 11 year channel, however we are stating that the market cycle began in 2017. 3 years later and the current data is simply confirming the previous high, as time marches on prices will begin to work their way lower and find that market bottom. We are forecasting a 24% correction, indicating prices will test the $700K threshold in the upcoming years. The bottom will likely occur in 2022, once the inventory has flooded the GTA.
Not all markets in Canada are created equal, some areas are closer to the bottom. While others still have significant percentage losses upcoming. Become an Eitel Insights client to find out which are which.
Dane Eitel, Eitel Insights

Boeing’s miserable results and outlook yesterday will be reinforced by similar dire numbers from Airbus. The US plane maker delivered a mere 20 aircraft in Q2. Revenues from passenger plane sales tumbled 68% while income from service and maintenance nose-dived. It’s cutting production as orders are delayed or cancelled. It doesn’t expect aviation to return to normal for 3 years, and plans to lay off…Click to read full article.
This week Josef comments on how US product consumption rose last week with the help of decent summer weather.
Each week Josef Schachter will give you his insights into global events, price forecasts and the fundamentals of the energy sector. Josef offers a twice monthly Black Gold newsletter covering the general energy market and 28 energy and energy service companies with regular updates. He holds quarterly subscriber webinars and provides Action BUY and SELL Alerts for paid subscribers. Learn more and subscribe.
EIA Weekly Data: Wednesday July 29th EIA weekly data was positive as summer energy demand rose and net imports fell sharply. The headline number for commercial crude stocks showed a decline of 10.6Mb versus the forecast of a decline of 0.4Mb. Net imports fell by 1.01Mb/d or by 7.1Mb in the week, which if it had been flat on the week, would have meant a build of only 3.5Mb. Motor Gasoline inventories rose by 0.7Mb as refinery utilization rose 1.6% to 79.5% from 77.9%. Overall stocks fell by 6.5Mb. Cushing saw its fourth weekly increase with a rise of 1.3Mb to 51.4Mb. US production of crude held steady at 11.1Mb/d.
Product supplied/consumed rose 8% to 19.1Mb/d or by 1.44Mb but is still down 2.2Mb/d or 10% from last year’s level of 21.3Mb/d. Finished motor gasoline demand rose 3% on the week to 8.81Mb/d or up by 259Kb/d on the week but is still down 8% from 9.56Mb/d last year. Jet fuel usage fell 55Kb/d last week to 1.02Mb/d and is still down 870Kb/d or 46% less than last year’s 1.89Mb/d.
Baker Hughes Rig Data: Last week Friday the Baker Hughes rig survey showed a decline in the US rig count of 2 rigs (prior week down 5 rigs) to 251 rigs and down 73% from 946 rigs working a year ago. The US oil rig count rose by 1 to 181 rigs (down 1 rig last week) and down 77% from 776 rigs working last year. The Permian started to show a recovery with two rigs being added and now have 126 rigs working. This is still down 72% from a year ago when 443 rigs were working. Three more rigs for US natural gas were taken out last week and this rig count is down 60% from last year’s level of 169 rigs to 68 rigs.
A more optimistic scene is the recovering Canadian sector. Canada’s rig count rose by 10 (up by 6 rigs last week) to 42 rigs working but is still down by 77% from 127 rigs working at this time last year.
US companies have announced that they will restart production given the current US$40/b prices and this week’s data hsa yet to show this return of production. We are in the bottoming process for the service industry but we may not see decent demand growth until winter 2020-2021 when a vaccine for the coronavirus is available.
For Canada, the Petroleum Service Association of Canada (PSAC) lowered its forecast for drilling in Canada this year from 3,100 (April forecast) to 2,800 now. Provincially they see 1,360 wells in Alberta (prior 2,155 or down 37%), Saskatchewan 1,055 wells (prior 1,795 or down 41%), BC 285 wells (prior 345 or down 17%) and Manitoba 80 wells (down from 190 wells or down 58%).
Conclusion: As we write this, WTI is at US$41.29/b for August, down just a dime from last week when we wrote this. The energy market is getting comfort from other commodity boards (precious metals and lumber) and the hope that a coronavirus vaccine will be ready by year end (as more pharmaceutical companies announce progress) and that a new US stimulus package of US$2-3T is approved by Congress by Friday of this week. We are skeptical a fiscal deal can come together before the heated election campaign season gets fully underway. If no funding for the unemployed gets passed this week and no forbearance for renters who face eviction for non-payment of rent, then we face a deteriorating economic condition in the US with rapidly rising unemployment, business closures and rising tensions in the streets as the election cycle unfolds.
For WTI crude we see a decline starting shortly (US$38.54/b next breakdown level). Longer term we see a breach of US$30/b triggering aggressive selling of energy and energy service stocks. Demand for energy should weaken as layoffs should pick up in August. We also expect to see more corporate bankruptcies as Q3 unfolds.
The energy and energy service companies with the most downside are those with high debt loads, high operating costs, declining production, have current balance sheet debt maturities of some materiality over the next 12 months and those that produce heavier crude barrels. Results for Q2 have started to come out this week and so far have been disappointing with negative comparison and rising debt levels. The bulk of the energy and energy service companies reports come out in August.
Hold cash and remain patient for the next low risk BUY window. If over-invested hopefully you have already taken appropriate defensive action.
The S&P/TSX Energy Index is at 76.64 down nearly 4 points or 4% from last week’s level of over 80. This Index is down 20% from the early June high of 96.07 when we turned bearish again. The next downside short term support is 71.76 and then we see downside to the 50 level. For the S&P/TSX Energy Index we see a bottom at the 32-36 level as the next major bottom low. Downside for the Dow Jones Industrials to breakdown is 24,800 (now 26,446) with much lower levels in Q3/Q4, 2020.
Our August Interim Update comes out next Thursday August 7th and we go over five companies on our Coverage List that will be reporting by our cut-off date of July 31st. We update our bearish views on the general stock market. The underpinnings of the recent market strength are the handful of tech-heavy NASDAQ “at home” beneficiaries and these are now showing signs of weakness.The rest of the market has been showing internal deterioration for some time. We expect a near term market breakdown.
Once the general market plunges and we get closer to the climactic bottom we will profile our best Table Pounding energy and energy service BUY ideas to consider owning by subscribers and add new ideas to our Action Alert BUY List.
I will be on with Michael Campbell on MoneyTalks radio on August 8th on the Corus network. Please listen in for our discussion about the energy and energy service industry with Michael at 10:00AM MT. With some energy and energy companies reporting disappointing Q2/20 financial results we will talk about them and my optimistic view for 2021.
Subscribe to the Schachter Energy Report and receive access to our previous Webinars (next webinar Thursday August 13th), our Action Alerts, our TOP PICK recommendations when the next BUY signal occurs as well as our Quality Scoring System review of the 28 companies that we cover.
Our August 13th SER webinar will be of interest to those wanting to get an understanding of recent quarterly results in the sector and our outlook for the energy industry through the end of 2020 and into 2021. We expect a key energy and energy stock BUY signal to come out during Q4/20 and we will discuss our favourite energy and energy service ideas for investors to do their homework on so that they are ready to BUY when the next low risk BUY signal is activated.
To get access to our research please go to http://bit.ly/2OvRCbP to subscribe.
(Note: Please share this comment on Facebook and Twitter. If you know someone who would enjoy more content like this please recommend they visit our website and sign up for our free eblast.)

-
I know Mike is a very solid investor and respect his opinions very much. So if he says pay attention to this or that - I will.
~ Dale G.
-
I've started managing my own investments so view Michael's site as a one-stop shop from which to get information and perspectives.
~ Dave E.
-
Michael offers easy reading, honest, common sense information that anyone can use in a practical manner.
~ der_al.
-
A sane voice in a scrambled investment world.
~ Ed R.
Inside Edge Pro Contributors

Greg Weldon

Josef Schachter

Tyler Bollhorn

Ryan Irvine

Paul Beattie

Martin Straith

Patrick Ceresna

Mark Leibovit

James Thorne

Victor Adair