
Energy & Commodities
Paul Gill, CEO of Lomiko Metals and Lomiko Technologies shares with Mike some of the critical (and scarce) metal markets that will be key to supporting the green technology revolutions – and why $1500 Telsa shares Do make sense!

Since the March 23rd lows, retail investors have jumped into the equity market with little concern about the potential risk. The “Pavlovian” response to the Fed’s massive monetary interventions has pushed “risk-taking” to extremes. Unfortunately, the odds are stacked against investors in a post-COVID economy.
In a recent newsletter, we discussed our process of “taking profits” in positions that had reached more extreme overbought conditions. As is usual in a market where “momentum” is in vogue, we received numerous emails about the “folly” of selling our technology holdings.
It Isn’t Folly.
It is a usual practice of mitigating risk to protect capital for our long-term investment cycle. Interestingly, while there is little doubt that patience is a virtue for investors, exercising prudence is equally important. Despite the basic math, and historical evidence proving its usefulness, investors typically ignore prudence, especially when it is required most. The “siren’s song” of a momentum-driven market fueled by a “speculative greed” is inevitably too compelling for many investors…CLICK for complete article

Trust is a fickle thing. It’s there until it isn’t. This is especially true with paper currencies. Their value is based on trust that the sovereign issuer will act faithfully and responsibly. The standards for a reserve currency are even higher given their status in global trade and finance. Throughout history, there have been many reserve currencies and they have all failed, eventually. Every one.
The average shelf life of a reserve currency is approximately 100 years. Can anyone today recall the importance of the French Livre or the Dutch Guider in world trade? They were the “U.S. dollar” of their day. At their height, no one questioned their durability much the same as, until recently, most didn’t question the durability of the U.S. dollar. But for a few keen observers, the writing has been on the wall for several decades.
It first caught my attention in the late 1990s. I started to see a change in behaviour by the Federal Reserve under Alan Greenspan. He was coming to the rescue of markets under the guise of protecting the financial system with increasing frequency. First it was the bail out caused by the demise of the hedge fund Long Term Capital Management in 1998. During this same period, Greenspan — with the assistance of the media — helped fuel the dot com bubble which finally burst in 2000. By the time the 9/11 terrorist attacks occurred in September 2001, the Fed, under Greenspan, began its policy of keeping interest rates “accommodative“ permanently and also showing blatant disregard of its independence from federal government policy. Full Article
Condo sales prices were higher in June compared to May and the year previous, similarly sales were higher than the previous month and year as well. However to say that the Condo market is forecasted to go higher and that there is pent up demand, is simply a fallacy. There will always be a need to buy and sell, currently that is the case there… some demand and a lower demand than previous years. As prices continue to trend lower beyond the 10% current drop there will continue be sales. The market will never flat line, but remember just because the Greater Vancouver Condo market has a pulse, doesn’t mean it is out of critical condition.
In reality with how the current market sits, it is very hard to be positive about the Greater Vancouver Condo market, yet some still are. We explain why we are not and you shouldn’t be either.
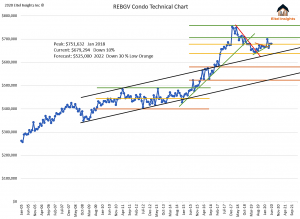
Prices as mentioned were higher in June with the average price finishing at $679,294 albeit a measly 1 thousand dollars from May’s sales price of $678,495. Hard to get excited about those numbers. Especially since June was the month when the supposed pent up demand was expected to be released, after being housebound for 2 months. Prices are still down over 10% from the market peak in 2018. The pent up demand is a whisper in the wind compared to the rising pent up need to sell.
As the market progresses to feel the effects of the Covid-19 the mortgage deferrals will eventually come to an end. The tenants that haven’t paid will be asked to leave. Not to mention all the presold properties that will flood the market as the completions continue which a whole beast on its own. The inventory has no choice but to skyrocket.
Another sign of a faltering market is prices remaining steady while the price per square foot falls.
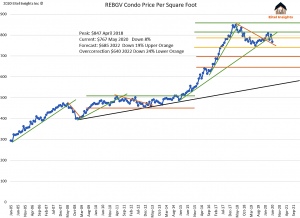
The price per square foot has fallen from the peak in April 2018 when condos were selling for $847 on average, to currently selling at $767 PPSQFT. The month over month drop was $34 per foot, the largest drop since 2018. The per square foot prices has fallen back to the upper edge of the downtrend.
This is signalling larger properties are selling for less money. With the average price remaining steady and the PPSQFT dropping results in a negative forecast for the condo market. Once higher valued properties sell at discount there will be less willing purchasers at the lowered valued properties as they begin to perceive the market is headed lower.
While we anticipate the Condo average price dropping around 30%, while we anticipate a 19-24% drop in the price per square foot chart. As the newly completed units become for sale or resale, the buyers will want new properties with warranties as the insurance issue continues. As a result elder buildings with higher square footage will sit on the sidelines until they drastically reduce their prices.
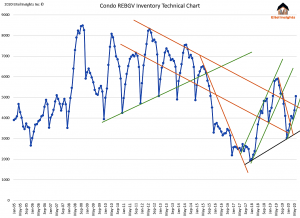
Inventory has finally broken out of the prolonged downtrend that propelled the inventory lower since 2012. During 2019 the inventory had temporarily surpassed the downtrend only to relent and retreat back into the comfort of a long term trend. Going forward we anticipate the downtrend to be broken for good, as inventory works its way back up to 5900 active listings, the near term high achieved in 2019.
With inventory surpassing 5000 for the first time since September 2019. Market prices are undoubtedly headed into the buyers favour as inventory continues to rise in 2021 and 2022.
There were over 2800 newly listed Condos in June the highest single monthly total since May 2012. Which elicits our point of pent up need to sell being more prevalent than any supposed pent up demand to buy let alone, invest. Furthermore the inventory rose over 1000 from new listing in May as the rise in Sales only ticked up 451 during the same time frame. The data is indicating a doubling of the inventory rise to that of sales.

As stated the Sales for the Greater Vancouver Condo market did rise to over 1000 sales in June, a significant rise from 655 in May. The numbers are better but far from glorious. The sales were the 2nd worst June on the chart which goes back 15 years. The chart depicts the sales data squarely in the middle of both the downtrend and the low sales channel.
Not all markets in Greater Vancouver are created equal, some areas are closer to the bottom. While others still have significant percentage losses upcoming. Become an Eitel Insights client to find out which are which.
Dane Eitel, Eitel Insights
Watch Eitel’s latest video here:

-
I know Mike is a very solid investor and respect his opinions very much. So if he says pay attention to this or that - I will.
~ Dale G.
-
I've started managing my own investments so view Michael's site as a one-stop shop from which to get information and perspectives.
~ Dave E.
-
Michael offers easy reading, honest, common sense information that anyone can use in a practical manner.
~ der_al.
-
A sane voice in a scrambled investment world.
~ Ed R.
Inside Edge Pro Contributors

Greg Weldon

Josef Schachter

Tyler Bollhorn

Ryan Irvine

Paul Beattie

Martin Straith

Patrick Ceresna

Mark Leibovit

James Thorne

Victor Adair